ACPD
11, 20521–20573, 2011PM10, PM2.5 and PM1.0
at Gosan ABC superstation
S. Lim et al.
Title Page
Abstract Introduction
Conclusions References
Tables Figures
◭ ◮
◭ ◮
Back Close
Full Screen / Esc
Printer-friendly Version
Interactive Discussion
Discussion
P
a
per
|
Dis
cussion
P
a
per
|
Discussion
P
a
per
|
Discussio
n
P
a
per
|
Atmos. Chem. Phys. Discuss., 11, 20521–20573, 2011 www.atmos-chem-phys-discuss.net/11/20521/2011/ doi:10.5194/acpd-11-20521-2011
© Author(s) 2011. CC Attribution 3.0 License.
Atmospheric Chemistry and Physics Discussions
This discussion paper is/has been under review for the journal Atmospheric Chemistry and Physics (ACP). Please refer to the corresponding final paper in ACP if available.
Ionic and carbonaceous compositions of
PM
10
, PM
2
.
5
and PM
1
.
0
at Gosan ABC
superstation and their ratios as source
signature
S. Lim1,*, M. Lee1, G. Lee2, S. Kim3, S. Yoon3, and K. Kang4 1
Dep. of Earth and Environmental Sciences, Korea University, Seoul, South Korea
2
Dep. of Environmental Science, Hankuk University of Foreign Studies, Seoul, South Korea
3
School of Earth and Environmental Sciences, Seoul National University, Seoul, South Korea
4
Graduate program in Marine Meteorology, Jeju National University, Jeju, South Korea
*
now at: Laboratoire de Glaciologie et G ´eophysique de l’Environnement (LGGE), CNRS/University of Grenoble, Grenoble, France
Received: 26 April 2011 – Accepted: 15 June 2011 – Published: 19 July 2011
Correspondence to: M. Lee ([email protected])
ACPD
11, 20521–20573, 2011PM10, PM2.5 and PM1.0
at Gosan ABC superstation
S. Lim et al.
Title Page
Abstract Introduction
Conclusions References
Tables Figures
◭ ◮
◭ ◮
Back Close
Full Screen / Esc
Printer-friendly Version
Interactive Discussion
Discussion
P
a
per
|
Dis
cussion
P
a
per
|
Discussion
P
a
per
|
Discussio
n
P
a
per
|
Abstract
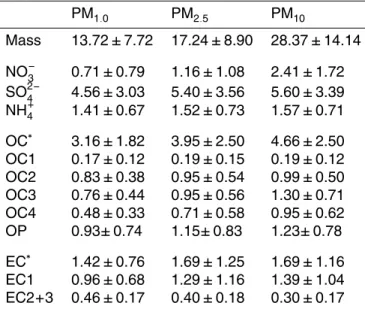
PM1.0, PM2.5, and PM10were sampled at Gosan ABC Superstation on Jeju Island from
August 2007 to September 2008. The carbonaceous aerosols were quantified with the thermal/optical reflectance (TOR) method, which produced five organic carbon (OC) fractions, OC1, OC2, OC3, OC4, and pyrolyzed organic carbon (OP), and three
ele-5
mental carbon (EC) fractions, EC1, EC2, and EC3. The mean mass concentrations of
PM1.0, PM2.5, and PM10 were 13.72 µg m−3, 17.24 µg m−3, and 28.37 µg m−3,
respec-tively. The averaged mass fractions of OC and EC were 23.0 % and 10.4 % for PM1.0,
22.9 % and 9.8 % for PM2.5, and 16.4 % and 6.0 % for PM10. Among the OC and EC
sub-components, OC2 and EC2+3 were enriched in the fine mode, but OC3 and OC4
10
in the coarse mode. The filter-based PM1.0 EC agreed well with black carbon (BC)
measured by an Aethalometer, and PM10 EC was higher than BC, implying less light
absorption by larger particles. EC was well correlated with sulfate, resulting in good
re-lationships of sulfate with both aerosol scattering coefficient measured by
Nephelome-ter and BC concentration. Our measurements of EC confirmed the definition of EC1 as
15
char-EC emitted from smoldering combustion and EC2+3 as soot-EC generated from
higher-temperature combustion such as motor vehicle exhaust and coal combustion. In particular, EC1 was strongly correlated with potassium, a traditional biomass burning
indicator, except during the summer, when the ratio of EC1 to EC2+3 was the lowest.
We also found the ratios of major chemical species to be a useful tool to constrain
20
the main sources of aerosols, by which the five air masses were well distinguished: Siberia, Beijing, Shanghai, Yellow Sea, and East Sea types. Except Siberian air, the continental background of the study region, Beijing plumes showed the highest EC1 (and OP) to sulfate ratio, which implies that this air mass had the highest net warming by aerosols of the four air masses. Shanghai-type air, which was heavily influenced by
25
southern China, showed the highest sulfate enhancement. The highest EC2+3/EC1
ACPD
11, 20521–20573, 2011PM10, PM2.5 and PM1.0
at Gosan ABC superstation
S. Lim et al.
Title Page
Abstract Introduction
Conclusions References
Tables Figures
◭ ◮
◭ ◮
Back Close
Full Screen / Esc
Printer-friendly Version
Interactive Discussion
Discussion
P
a
per
|
Dis
cussion
P
a
per
|
Discussion
P
a
per
|
Discussio
n
P
a
per
|
of China. The high ratio results from the longer residence time and less sensitivity to
wet scavenging of EC2+3 compared to EC1, indicating that soot-EC could have greater
consequence in regional-scale warming.
1 Introduction
Atmospheric aerosols play an important role in climate change by influencing the global
5
radiation balance both directly and indirectly. The direct effect is the mechanism by
which aerosols scatter and absorb shortwave and longwave radiation, thereby alter-ing the radiative balance of the Earth-atmosphere system (IPCC, 2007). The relative importance of these processes depends on the chemical composition and size distri-bution of aerosols (Ramachandran, 2009). Aerosols also cause a negative radiative
10
forcing indirectly through changes in cloud properties. This indirect effect includes the
role of aerosols in modifying cloud droplet number concentration and cloud lifetime (IPCC, 2007; Haywood and Boucher, 2000).
Because the chemical composition and size distribution of aerosols are important in
quantifying their radiative effects (Brasseur et al., 1999; Ramanathan et al., 2001;
Bu-15
zorius et al., 2004), knowledge of the chemical composition of atmospheric aerosols of a given size is required to assess their impact on the environment. Aerosols are often classified into submicron and supermicron particles; the former are of particular concern to public health and climate change because they mainly originate from
an-thropogenic sources and interact more efficiently with sunlight. Anthropogenic sources
20
contribute almost as much as natural sources to the global aerosol optical depth (AOD) (Hansen et al., 1997; Robertson et al., 2001). Anthropogenic aerosols are typically composed of various inorganic and organic species (IPCC, 2007), among which sul-fate, nitrate, and carbonaceous aerosols including black carbon (BC) and organic car-bon (OC) are of major interest due to their atmospheric abundances. In particular,
25
ACPD
11, 20521–20573, 2011PM10, PM2.5 and PM1.0
at Gosan ABC superstation
S. Lim et al.
Title Page
Abstract Introduction
Conclusions References
Tables Figures
◭ ◮
◭ ◮
Back Close
Full Screen / Esc
Printer-friendly Version
Interactive Discussion
Discussion
P
a
per
|
Dis
cussion
P
a
per
|
Discussion
P
a
per
|
Discussio
n
P
a
per
|
2000; Yang et al., 2005). They are composed of light-absorbing carbon as well as light-scattering carbon. The radiative forcing at the top of the atmosphere is found to change sign from negative to positive when carbonaceous aerosols are abundant over highly reflecting surfaces such as land and snow, which results in higher atmospheric heating (Ramanathan and Carmichael, 2008; Ramachandran, 2009).
5
These carbonaceous aerosols are mainly divided into two categories: elemental carbon (EC), often called BC or soot, and OC. Especially for EC, there are various definitions and analytical methods to quantify its atmospheric concentration (Andreae and Gelens ´er, 2006; Han et al., 2010). EC is usually referred to a near-elemental soot-carbon-like composition and to the fraction of carbon that is oxidized in combustion
10
analysis above a certain temperature threshold. Soot carbon may be defined as aggre-gates of spherules made of grapheme layers, consisting almost purely of carbon, with minor amounts of bound heteroelements, especially hydrogen and oxygen, whereas soot is referred to a black, blackish or brown substance formed by combustion, present in the atmosphere as fine particles. BC generally implies to have optical properties
15
and composition similar to soot carbon (Andreae and Gelens ´er, 2006). While EC is usually determined by thermal methods based on its chemical properties, BC is mea-sured using its optical properties. Therefore, BC is considered as light-absorbing EC and is generally lower in concentration than EC. EC enters the atmosphere exclusively as a primary (i.e., direct particulate) emission originating nearly completely from
pyrol-20
ysis during incomplete combustion, mainly of biomass and fossil fuel (Nunes and Pio, 1993; Bond et al., 2007). Because EC is optically absorptive and highly polyaromatic, it has recently been a subject of interest in many studies encompassing local to global scales. In particular, EC (or BC) could be the next most important contributor to global
warming, in terms of direct forcing, after CO2 (Kuhlbusch and Crutzen, 1995;
Jacob-25
ACPD
11, 20521–20573, 2011PM10, PM2.5 and PM1.0
at Gosan ABC superstation
S. Lim et al.
Title Page
Abstract Introduction
Conclusions References
Tables Figures
◭ ◮
◭ ◮
Back Close
Full Screen / Esc
Printer-friendly Version
Interactive Discussion
Discussion
P
a
per
|
Dis
cussion
P
a
per
|
Discussion
P
a
per
|
Discussio
n
P
a
per
|
On the other hand, OC is commonly considered as the non-absorptive fraction of the carbonaceous aerosol. It has more molecular forms and a lower molecular weight than EC. OC is produced from both direct emission and gaseous precursors by atmospheric oxidation or oligomerization (Jacobson et al., 2000; Kanakidou et al., 2005; Tsigaridis et al., 2006). The main primary source of OC is combustion along with EC emissions
5
and biogenic emissions. In addition, OC is produced from oxidation of precursor gases in the atmosphere, constituting what is called secondary organic aerosol (SOA) (Ja-cobson et al., 2000). A considerable proportion of organic aerosols is hygroscopic, thereby serving as cloud condensation nuclei (CCN) along with sulfate aerosols. On the other hand, EC particles are hydrophobic when they are emitted, but the sulfates or
10
water soluble organic compounds (WSOC) that become attached to EC particles can
change them from hydrophobic to hydrophilic, eventually making them efficient CCN
(Decesari et al., 2002; Persiantseva et al., 2004; Petzold et al., 2005). When EC was coated with reflecting compounds like OC, the absorption by EC was found to increase at least by a factor of 1.5 (Bond et al., 2006). In addition, carbonaceous aerosols, when
15
mixed with atmospheric dust, have the potential to influence the atmospheric chemistry
of several trace gases such as NO2, O3, and SO2(Dentener et al., 1996).
Although the definition and measurement techniques for atmospheric EC or BC have long been subjects of scientific controversy, the recent discovery of light-absorbing carbon that is not black but brown (or yellowish) makes it imperative to reassess and
20
redefine the components that make up light-absorbing carbonaceous matter in the atmosphere (Andreae and Gelencs ´er, 2006). There has been growing evidence for the contribution of brown carbon to light absorption in atmospheric aerosols from chemical aerosol measurements and laboratory studies (Mukai and Ambe, 1986; Havers et al.,
1998; Hoffer et al., 2006; Alexander et al., 2008; Park et al., 2010).
25
ACPD
11, 20521–20573, 2011PM10, PM2.5 and PM1.0
at Gosan ABC superstation
S. Lim et al.
Title Page
Abstract Introduction
Conclusions References
Tables Figures
◭ ◮
◭ ◮
Back Close
Full Screen / Esc
Printer-friendly Version
Interactive Discussion
Discussion
P
a
per
|
Dis
cussion
P
a
per
|
Discussion
P
a
per
|
Discussio
n
P
a
per
|
Therefore, finding a source and a source region of major components of aerosols, such as carbonaceous species, sulfate, and nitrate, is crucial for the assessment of
their radiative effect. In particular, Asia is the main source of global anthropogenic
aerosol emission. At present, anthropogenic emissions of gaseous pollutants in Asia are larger than those in Europe and North America and will continue to increase in the
5
future (Akimoto, 2003). An emission inventory study in Asia suggests that 30–60 % of the total emission of aerosol gaseous precursors and primary BC and OC are
emit-ted in China. In particular, ∼41 % of submicron BC emissions is originated in China
(Streets et al., 2003). The recently documented linear increase of primary BC and OC between 1850 and 2000 highlights the importance of continuous measurements of
car-10
bonaceous particles (Bond et al., 2007). Additionally, the frequent presence of desert dust makes the East Asian atmosphere more complex because of both scattering of sunlight and absorption of radiation (Hubert et al., 2003).
In recent decades, carbonaceous aerosols, both EC and OC, have been measured in many regions of Northeast Asia, including South Korea, China, and Japan (Ohta et
15
al., 1998; Kim et al., 2000; Park et al., 2001; Cao et al., 2005; Hagler et al., 2006; Lee et al., 2007, 2008, 2009; Shen et al., 2007; Moon et al., 2008; Aggarwal and Kawamura, 2009). The areas covered have included urban areas (Park et al., 2001; Lee et al., 2009), developing regions (Hagler, 2006), and sandlands (Cao et al., 2005;
Shen et al., 2007). However, most of these studies focused on PM2.5 or PM10 and
20
were conducted during a specific season, such as spring (Lee et al., 2007; Shen et al., 2007), spring and early summer (Aggarwal and Kawamura, 2009), or fall and winter (Cao et al., 2005). There have been few year-round studies of both fine and coarse aerosols, particularly at a site where it is feasible to monitor long-range transport and the atmospheric processes involving air pollutants emitted from the Asian continent.
25
ACPD
11, 20521–20573, 2011PM10, PM2.5 and PM1.0
at Gosan ABC superstation
S. Lim et al.
Title Page
Abstract Introduction
Conclusions References
Tables Figures
◭ ◮
◭ ◮
Back Close
Full Screen / Esc
Printer-friendly Version
Interactive Discussion
Discussion
P
a
per
|
Dis
cussion
P
a
per
|
Discussion
P
a
per
|
Discussio
n
P
a
per
|
In the present study, we measured soluble ionic and carbonaceous compositions
of PM1.0, PM2.5, and PM10at Gosan ABC Superstation on Jeju Island throughout the
year from August 2007 to September 2008. The main objective was threefold: to un-derstand distributions and behavior of major components, particularly carbonaceous components, of both fine and coarse aerosols; to identify the sources of these
com-5
ponents; and finally to examine the relationships between chemical compositions and optical properties.
2 Measurement
PM1.0, PM2.5, and PM10 were measured at Gosan ABC Superstation on Jeju Island
during August 2007–September 2008. Gosan station (33.17◦N, 126.10◦E, 70 m a.s.l.,
10
Fig. 1) served as a base for the ACE-Asia experiment in 2001 and was designated as one of the ABC Superstations (Lee et al., 2007). It has been considered to be an ideal location to monitor Asian outflows and assess their impact on air quality over the
northern Pacific (Carmichael et al.,1996, 1997; Chen et al.,1997).
In the present study, the concentrations of water-soluble inorganic ions, EC, OC, and
15
mass in PM1.0, PM2.5,and PM10 were measured for about one year. Ambient air was
collected through PM1.0, PM2.5,and PM10sharp-cut cyclone coated with Teflon (URG,
USA) at 16.7 LPM, and cumulative flow was measured with a dry gas-meter. These low-volume samplers were installed at the top of a 10-m tower. Particles were collected on pre-weighed mm Teflon filters for mass and ion analysis, and on pre-heated
37-20
mm quartz-fiber filters (Pall corp., USA) for carbon analysis.
Sampling was conducted usually once every six days. It started at 0900 LST and lasted for 24 h. There was less number of samples collected during summer and winter monsoon periods because of rain, snow, or strong wind. With additional samples during particular events such as Asian dust and pollution plumes, a total of 41 sets of
25
ACPD
11, 20521–20573, 2011PM10, PM2.5 and PM1.0
at Gosan ABC superstation
S. Lim et al.
Title Page
Abstract Introduction
Conclusions References
Tables Figures
◭ ◮
◭ ◮
Back Close
Full Screen / Esc
Printer-friendly Version
Interactive Discussion
Discussion
P
a
per
|
Dis
cussion
P
a
per
|
Discussion
P
a
per
|
Discussio
n
P
a
per
|
Eight species of water-soluble ions, which included SO24−, NO−3, Cl−, NH+4, K+, Na+,
Ca2+, and Mg2+, were determined by ion chromatography (Dionex 4500, Dionex, USA).
More details on this method of analysis can be found in Lim (2009). EC, OC, and TC were analyzed at the Desert Research Institute (Reno, NV, USA) following the Interagency Monitoring of Protected Visual Environments (IMPROVE) thermal/optical
5
reflectance protocol. Thermal/optical methods assume EC is a low-volatility carbon
fraction that is not liberated in an oxygen-free environment until a temperature of>600◦
is attained, allowing it to be separated from the more volatile OC that evolves at lower
temperatures. Eight fractions of carbon, including four fractions of OC (at 120◦ for
OC1, at 250◦ for OC2, at 450◦ for OC3, and at 550◦ for OC4 in a He atmosphere),
10
three fractions of EC (at 550◦ for EC1, at 700◦ for EC2, and at 800◦ for EC3 in a 2 %
O2/98 % He atmosphere), and OP, pyrolyzed (or charred) OC, were determined by this
analysis method. OP is measured after the introduction of a He/O2 atmosphere but
before reflectance or transmittance returns to its initial value (Chow et al., 2005). In conjunction with chemical composition, BC concentration was determined by
15
absorption at 7 wavelengths, 370, 450, 520, 590, 660, 880, and 950 nm, using an
Aethalometer (AE-31, Magee Scientific Corp., USA) every 10 min. Scattering coeffi
-cients were obtained at 450 nm, 550 nm, and 700 nm by a Nephelometer (model 3563, TSI Inc., USA) every 10 min. For these measurements, ambient air was pulled through a sampling manifold without cut-points. These optical measurement data are
avail-20
able since January 2008. Gaseous pollutants, including O3, NO2, CO, and SO2, and
a meteorological suite were measured hourly by the National Institute of Environmen-tal Research (NIER) and the Korea Meteorological Administration (KMA), respectively. These data were averaged hourly or daily for comparison with the chemical composi-tion data.
ACPD
11, 20521–20573, 2011PM10, PM2.5 and PM1.0
at Gosan ABC superstation
S. Lim et al.
Title Page
Abstract Introduction
Conclusions References
Tables Figures
◭ ◮
◭ ◮
Back Close
Full Screen / Esc
Printer-friendly Version
Interactive Discussion
Discussion
P
a
per
|
Dis
cussion
P
a
per
|
Discussion
P
a
per
|
Discussio
n
P
a
per
|
3 Size-fractionated ionic and carbonaceous compositions
The daily concentrations of PM1.0, PM2.5, and PM10 varied between 1.26 µg m
−3
and
29.51 µg m−3, 3.94 µg m−3 and 39.17 µg m−3, and 7.52 µg m−3 and 69.7 µg m−3,
re-spectively. Mean mass concentrations were 13.72 µg m−3 for PM1.0, 17.24 µg m
−3
for
PM2.5, and 28.37 µg m
−3
for PM10 (Fig. 2 and Table 2), suggesting that the daily mass
5
well represented episodic events associated with pollution and dust plumes. Caution needs to be exerted when comparing these values with annual mean because there is relatively less number of samples during summer and winter monsoon periods. The
no-ticeable feature was a large fraction of PM1.0against PM10(48.4 %) and against PM2.5
(60.8 %) on average. PM2.5accounted for 79.6 % of PM10.
10
In particulate matter of all sizes, the most abundant constituents were water-soluble ions, which were followed by OC and EC (Fig. 2). We did not convert OC to OM, and the following discussion is pertinent only to OC. The concentrations of ions were almost twice as high as those of OC, and OC was nearly two times higher than EC. The average mass fractions of ions, OC, and EC were 53.9 %, 23.0 %, and 10.4 %
15
for PM1.0, 52.4 %, 22.9 %, and 9.8 % for PM2.5, and 43.4 %, 16.4 %, and 6.0 % for
PM10, revealing that carbonaceous compounds were the most abundant in PM1.0and
PM2.5. A considerable fraction of mass other than water-soluble ions, OC, and EC was
possibly due to trace metals and silica, which were not measured.
The ratios of OC/EC were 2.2, 2.3, and 2.8 for PM1.0, PM2.5, and PM10, respectively.
20
These mean OC/EC ratios were much lower than those measured at the regional
back-ground (RB) site in Western Mediterranean (∼11 for PM2.5) (Pey et al., 2009) and at
two RB sites in western China (∼12 for PM10) (Qu et al., 2009), and still lower than
those of most RB sites in Europe (OC/EC>4) (Pey et al., 2009). The difference in
OC/EC ratios is likely due to relatively higher EC concentration than OC in this study
25
area. Our OC/EC ratios were, however, comparable to those for PM2.5(2.4) and PM10
ACPD
11, 20521–20573, 2011PM10, PM2.5 and PM1.0
at Gosan ABC superstation
S. Lim et al.
Title Page
Abstract Introduction
Conclusions References
Tables Figures
◭ ◮
◭ ◮
Back Close
Full Screen / Esc
Printer-friendly Version
Interactive Discussion
Discussion
P
a
per
|
Dis
cussion
P
a
per
|
Discussion
P
a
per
|
Discussio
n
P
a
per
|
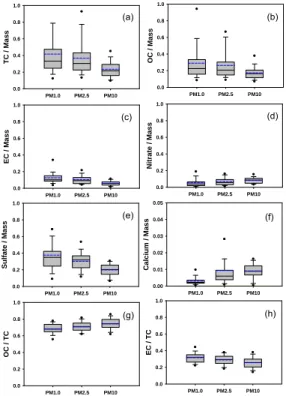
The distributions of TC/mass, OC/mass, and EC/mass among particle sizes were very similar, increasing with decrease in particle diameter (Fig. 3a, b, and c). The trends imply substantial anthropogenic influence and atmospheric processing such as condensation, gas-to-particle conversion, or surface-limited oxidation processes. For fine mode OC, there could be contribution from biogenic emissions as well as
an-5
thropogenic sources. Additionally, EC/mass distributions were slightly sharper than OC/mass with decrease in particle size, indicating a larger contribution of EC to fine particles. For water-soluble ions, sulfate was the most abundant single species, and
its concentration was comparable to that of TC, accounting for 20∼30 % of the mass
(Fig. 3e). Also, the sulfate-to-mass ratio was found to be slightly more shifted toward
10
PM1.0 than was the TC-to-mass ratio, while being similar in size distribution. This shift
is probably due to a large amount of non-sea-salt sulfate (nss-SO24−) originating from
anthropogenic sources, which contributed about ∼75–99 % of total sulfate aerosols,
and is dependent on gas-to-particle conversion processes. The concentrations of nss components were calculated from the measured sodium concentrations and the ratio
15
of the component to sodium in seawater.
In contrast to the carbonaceous aerosols and the sulfate, significant differences in
size distributions were observed for calcium and nitrate (Fig. 3d and f). These species
were much higher in PM10 than in the other size fractions. In the case of nitrate, the
next most abundant species among the water-soluble ions, this is due to its chemical
20
and physical characteristics, especially its volatility. Nitrate, being more volatile than sulfate, will tend to evaporate from smaller particles and deposit on large particles,
where surface curvature effects on vapor pressure are minimal, while sulfate, being
essentially non-volatile, has a size distribution controlled by gas-phase diffusion and
will tend to accumulate in small particles (Bassett and Seinfeld, 1984). For calcium,
25
its main sources are soils and sea salt in general; however, the soil-derived calcium would be a more abundant component of total calcium in the present study because
non-sea-salt-calcium (nss-Ca2+) accounts for∼43–97 % of the total calcium in all
ACPD
11, 20521–20573, 2011PM10, PM2.5 and PM1.0
at Gosan ABC superstation
S. Lim et al.
Title Page
Abstract Introduction
Conclusions References
Tables Figures
◭ ◮
◭ ◮
Back Close
Full Screen / Esc
Printer-friendly Version
Interactive Discussion
Discussion
P
a
per
|
Dis
cussion
P
a
per
|
Discussion
P
a
per
|
Discussio
n
P
a
per
|
heterogeneous reactions including nitrogen oxides and by absorption of nitric acid on the surface of soil particles (Mamane and Gottlieb, 1989; Zhang et al., 1994). At the
Gosan station, the correlation between nitrate and calcium in PM10 was significant
(R2=0.51) for all measurements, including the high PM10 episodes that were affected
by Asian dust event. The correlation implies that there is a mineral affinity of nitrate in
5
coarse mode particles and that some of the nitrate could have been formed on dust particles enriched with calcium. In fact, there have been intensive studies on the link between anthropogenic nitrate or sulfate and mineral constituents of Asian dust (Wang et al., 2007; Lin et al., 2008; Geng et al., 2009) and Saharan dust particles (Talbot et al., 1986; Mace et al., 2003; Koc¸ak et al., 2004). Particularly, Geng et al. (2009)
10
reported that the nitrate-containing secondary soil-derived particles were markedly in-creased in coarse mode during Asian dust period. Asian dust was also suggested to
provide a removal mechanism for NOx (or HNO3) and perhaps contribute to nitrogen
deposition in the Yellow Sea (Wu and Okada, 1994).
The ratios of OC and EC to TC as a function of particle diameter (Fig. 3g and h)
re-15
flect the oxidation and condensation mechanisms of carbonaceous compounds. Gas-to-particle conversion and heterogeneous chemistry in the atmosphere control chem-ical and physchem-ical properties of aerosols, but these processes are not understood well enough to predict accurately the evolution of the gas and particle-phase composition of the troposphere (Ravishankara, 1997; Maria et al., 2004). In particular, the formation
20
and the mixing state of carbonaceous aerosols are important due to their consider-able anthropogenic source and high concentration. As shown in Figures 3g and 3h, the EC-to-TC ratio increased with decrease in particle size, while the OC-to-TC ratio showed an opposite trend. Particles generated through condensation of hot vapor or from direct emissions can become oxidized through heterogeneous reactions that are
25
ACPD
11, 20521–20573, 2011PM10, PM2.5 and PM1.0
at Gosan ABC superstation
S. Lim et al.
Title Page
Abstract Introduction
Conclusions References
Tables Figures
◭ ◮
◭ ◮
Back Close
Full Screen / Esc
Printer-friendly Version
Interactive Discussion
Discussion
P
a
per
|
Dis
cussion
P
a
per
|
Discussion
P
a
per
|
Discussio
n
P
a
per
|
2004). Although EC is mixed with organic compounds in the atmosphere,
surface-limited oxidation may easily occur because organic compounds often have efficient
surface reactivity (Maria et al., 2004; Russell et al., 2002). In the case of OC,
inter-estingly, the OC/TC ratio was highest in the coarse mode and lowest in PM1.0. The
OC enrichment in coarse mode could be attributed to the formation of secondary
or-5
ganic aerosols (SOA) and subsequent increase in size during aging processes (Liu et
al., 2009). The relatively higher OC/EC ratio (2.5 for PM2.5 and 3.3 for PM10) in spring
and summer implies SOA formation at higher temperature, even though OC concentra-tions were lower than those in winter. Mochida et al. (2007) performed size-segregated
aerosol measurements offthe coast of East Asia and found a high OC proportion in the
10
supermicron mode of up to 61 %, suggesting primary emission of organics associated with sea salt and dust particles or other primary sources (e.g., plant waxes, soil-derived microbes, and anthropogenic particles). In this measurement, a similar behavior of OC and EC was observed during an Asian dust event in May 2008 (Lim et al., 2010), in which the ratio of OC to EC was raised in dust-laden air possibly due to the impact
15
of dust-related primary OC. Therefore, it is suggested that there was a considerable contribution of primary OC as well as SOA to total OC concentration particularly in the present study.
The ratios of OC and EC subcomponents to TC (Fig. 3i–o) were divided into three types. The first group includes OC1, OP, and EC1, whose ratios against TC did not
20
show a clear tendency to vary with particle size (Fig. 3i, m, and n). OC1 may represent semi-volatile organic carbon because OC1 not only is the first carbon evolved at the lowest temperature but also is observed to be the most abundant and variable in con-centration among the 5 OC fractions in our blank filters. OP is a measure of pyrolyzed organic carbon, and its characteristics are well described by Andreae and Gelencs ´er
25
(2006), who explained that OP can be released as a gas or in solid form and become associated with submicron or supermicron particles. Similarly, EC1 was defined as charred EC (Han et al., 2010), and a detailed discussion of EC1 is given in Sect. 5.
ACPD
11, 20521–20573, 2011PM10, PM2.5 and PM1.0
at Gosan ABC superstation
S. Lim et al.
Title Page
Abstract Introduction
Conclusions References
Tables Figures
◭ ◮
◭ ◮
Back Close
Full Screen / Esc
Printer-friendly Version
Interactive Discussion
Discussion
P
a
per
|
Dis
cussion
P
a
per
|
Discussion
P
a
per
|
Discussio
n
P
a
per
|
the smaller size particles (Fig. 3j and o). This enhancement strongly supports the view that a condensation process or surface-limited oxidation was involved in the formation
of OC2 and EC2+3. Particularly, OC2 is thought to be a secondary organic carbon,
which will be further discussed in Sect. 6. In contrast to OC2, the fractions OC3 and OC4 clearly increased with increasing particle size (Fig. 3k and l), and their
concentra-5
tions were also higher in PM10 than in PM1.0, suggesting the characteristic of primary
aerosols.
4 Seasonal characteristics
The monthly variations of meteorological parameters include those of temperature,
which varied between 4.4◦C and 25.8◦C, and relative humidity, which ranged from
10
37.2 % to 87.6 % over the whole period, showing distinct seasonal patterns. The mode
of wind direction in degrees from 0◦to 360◦was chosen for each month and categorized
into eight groups from N to NW. Throughout the winter and the spring, the prevailing wind was northwesterly under the influence of the winter monsoon over East Asia, with
high wind speeds up to 13 m s−1, suggesting a greater influence during that period from
15
Asian continental outflows. With the arrival of summer, the wind direction was shifted to
easterly with lower wind speeds below 3 m s−1, indicating reduced continental outflows
(Kim et al., 2007).
Seasonal mass fractions of major components (OC, EC, nitrate, and, sulfate) and
mass concentrations are compared in Fig. 5. The average PM1.0 and PM2.5 levels
20
were highest during winter at 16.3 µg m−3 and 20.3 µg m−3, respectively, followed by
spring, when the highest seasonal PM10 was observed (35.2 µg m−3). The enhanced
mass concentrations were associated with anthropogenic sources, mostly from the Asian continent during the winter monsoon season and with Asian dust events in the spring. The lowest mass concentrations at all sizes were due to frequent rain and small
25
continental effects during the summer season (Lim et al., 2010a, b). While sulfate was
ACPD
11, 20521–20573, 2011PM10, PM2.5 and PM1.0
at Gosan ABC superstation
S. Lim et al.
Title Page
Abstract Introduction
Conclusions References
Tables Figures
◭ ◮
◭ ◮
Back Close
Full Screen / Esc
Printer-friendly Version
Interactive Discussion
Discussion
P
a
per
|
Dis
cussion
P
a
per
|
Discussion
P
a
per
|
Discussio
n
P
a
per
|
winter, with a fraction of 7–11 %. The occurrence of the highest sulfate fraction in spring
compared with other seasons was due to the combination of enough SO2 sources
mainly from Asian continent and favorable meteorological conditions for converting SO2
to sulfate. In summer, on the other hand, sulfate concentrations were low because
of the lowest SO2 concentrations below 1.0 ppbv even under favorable conditions for
5
sulfate conversion and wet removal of precursor gases and particles. Seasonal nitrate levels were inversely related to ambient temperature, being highest in winter at 7–11 %, moderate in spring and fall at 5–9 %, and lowest in summer at 3–8 %.
In this study, carbonaceous fractions were higher in summer and fall under low mass and sulfate concentrations but lower in winter and spring under high mass and sulfate
10
concentrations. Particularly, the OC and EC fractions of PM1.0 were highest in fall. It
is likely due to the formation of secondary organic aerosols from biomass burning. In
spring, biomass burning also takes place but its effect is diluted by high anthropogenic
emissions of sulfur and nitrogen. In addition, most of the fall samples were taken under stable atmospheric conditions, which were favorable for the formation and buildup of
15
secondary organic aerosols and pollutants.
5 Characteristics of EC
The EC was compared with BC measured by Aethalometer (Fig. 6a). In contrast to EC quantification by thermochemical analysis, BC concentration was obtained by optical analysis, which estimates light absorption of particles and converts it into mass
con-20
centration. The slope of the regression equation of PM1.0 EC against BC at 880 nm
was 1.0, whereas the slope for PM10 EC against BC was 1.5. This result implies that
mass absorption efficiency is higher for smaller particles and that the greater fraction
of coarse EC may not absorb as much BC as fine EC does.
It can be seen in Fig. 6b that EC and sulfate were well correlated. Due to
con-25
ACPD
11, 20521–20573, 2011PM10, PM2.5 and PM1.0
at Gosan ABC superstation
S. Lim et al.
Title Page
Abstract Introduction
Conclusions References
Tables Figures
◭ ◮
◭ ◮
Back Close
Full Screen / Esc
Printer-friendly Version
Interactive Discussion
Discussion
P
a
per
|
Dis
cussion
P
a
per
|
Discussion
P
a
per
|
Discussio
n
P
a
per
|
sufficiently mixed with sulfate in places under the influence of substantial anthropogenic
sources. That is why sulfate shows not only a good correlation with scattering efficiency
measured by Nephelometer but also a reasonable correlation with BC measured by
Aethalometer (Table 3). EC was also well correlated with scattering efficiency and BC.
It has been shown that more hygroscopic particles, such as sulfate of a given size,
5
will grow more under humid conditions, scattering more incident light (Jimenez et al., 2009). Other studies have reported Mie calculations of soot particles with sulfate coat-ings showing enhanced absorption (Martins et al., 1998; Fuller et al., 1999). These results suggest a positive contribution of sulfate coatings to net warming.
EC is not a single chemical compound. It can be subdivided into two classes based
10
on our analytical method: char-EC and soot-EC. Char was defined as carbonaceous material obtained by heating organics and formed directly from pyrolysis or as an im-pure form of graphitic carbon obtained as a residue when carbonaceous material is par-tially burned or heated with a limited supply of air. Soot was defined as only those car-bon particles that form at high temperature via gas-phase processes. Previous studies
15
showed that char and soot had different chemical and physical properties (Kuhlbusch,
1997; Masiello, 2004), as well as optical properties (Bond, 2001; Bond et al., 2002; Kirchstetter et al., 2004). We adopted the operational definitions of EC fractions that
Han et al. (2010) suggested to demonstrate the different characteristics of char and
soot, based on their previous lab experiment (Han et al., 2007). Their experiment
re-20
sult supported the use of the TOR method to discriminate between char- and soot-EC. The activation energy was lower for char- than soot-EC; char materials always oxidized
at low-temperature (550◦, at EC1 stage), while Diesel and n-hexane soot samples
ex-hibited similar EC2 peaks (at 700◦) and carbon black samples peaked at both EC2 and
EC3 (800◦). In our study, therefore, char-EC and soot-EC are operationally defined as
25
EC1 and as EC2+3, respectively. In the present work, the mean EC1 concentrations
were almost two times higher than the mean EC2+3 concentrations for all size cuts,
ranging from 0.96 µg m−3 to 1.39 µg m−3 for EC1 and from 0.30 µg m−3 to 0.46 µg m−3
ACPD
11, 20521–20573, 2011PM10, PM2.5 and PM1.0
at Gosan ABC superstation
S. Lim et al.
Title Page
Abstract Introduction
Conclusions References
Tables Figures
◭ ◮
◭ ◮
Back Close
Full Screen / Esc
Printer-friendly Version
Interactive Discussion
Discussion
P
a
per
|
Dis
cussion
P
a
per
|
Discussion
P
a
per
|
Discussio
n
P
a
per
|
We compared the relationships between EC1 and EC2+3 in the different seasons.
They showed the strongest correlation in winter and spring (R2=0.4−0.6 for PM1.0,
PM2.5, and PM10), which suggests common combustion sources such as biomass
burning, residential heating, and coal combustion. In contrast, they were poorly
cor-related in summer (R2=0.03−0.2 for PM1.0, PM2.5, and PM10), which was likely due
5
to reduced burning sources. Furthermore, the overall correlation between EC1 and
EC2+3 was better in PM10rather than PM1.0. This seems to be associated with particle
size: EC1 has larger size (∼1–100 µm) than EC2+3, which is emitted as gas or smaller
particles (∼hundreds of nm).
Although, generally, the concentration of aerosols in the study area is mainly
deter-10
mined by the amounts of emission from the Asian continent, transport processes and
wet scavenging as well as emission have an effect on the level of each material. Here,
we examined the impact of precipitation on the mass difference between EC1 and
EC2+3 using the ratio of the concentration during non-rainy days (31 days) to the
con-centration during rainy days (10 days) (Table 4). EC2+3 showed little wet scavenging
15
effect with a ratio of 1.0∼1.3. On the other hand, EC1 had a difference in
concentra-tion between non-rainy and rainy days. These results imply a longer residence time of
EC2+3 in the atmosphere, meaning that soot aerosols are suspended and transported
longer. In general, since char-EC is composed of large particles (>∼1 µm) as well as
small particles, it could be easily removed by wet deposition. Soot, consisting of
submi-20
cron particles of grape-like clusters, can remain suspended for time scales of the order of a month (Ogren and Charlson, 1983) and has strong light absorption characteristics with little spectral dependence (Schnaiter et al., 2003; Kirchstetter et al., 2004). Thus soot could have greater consequence for warming.
The soot-EC/char-EC ratio depends upon the mixing function of the different
25
ACPD
11, 20521–20573, 2011PM10, PM2.5 and PM1.0
at Gosan ABC superstation
S. Lim et al.
Title Page
Abstract Introduction
Conclusions References
Tables Figures
◭ ◮
◭ ◮
Back Close
Full Screen / Esc
Printer-friendly Version
Interactive Discussion
Discussion
P
a
per
|
Dis
cussion
P
a
per
|
Discussion
P
a
per
|
Discussio
n
P
a
per
|
depending on the type of coal (Han et al., 2010). To apply the definitions of Han et
al. (2010) to our study, we compared seasonal EC2+3/EC1 ratios (Fig. 7). Seasonally
averaged EC1 concentration was highest in winter and lowest in summer. This order
is very well matched with the intensity of continental outflows. In contrast, EC2+3 did
not show clear seasonal variation, but the highest concentrations were found in spring
5
and the lowest concentrations in fall and winter. As a result, the ratios of EC2+3/EC1
were highest in summer, when all air masses reached at Gosan from the east passing through South Korea or/and Japan with the least influence by the continent and greater
influence by South Korea and Japan (See Fig. 9e). EC2+3 emitted during winter and
spring may have remained suspended in the atmosphere due to its smaller size and
10
kept its proportion through increased motor vehicle sources from South Korea and Japan, in spite of the wet scavenging caused by frequent precipitation during summer. Han et al. (2010) collected EC particles in Xi’an, a sandland in China, of which result are consistent with our observation that EC1 had a minimum level in summer, but in
contrast to our observations, the level of EC2+3 was also minimum in summer. Higher
15
EC2+3 concentrations during summer in our data imply increased influence of South
Korea and Japan on EC concentrations. Hence, EC2+3 is considerably enhanced, but
EC1 is markedly less because of limited contact with industrial regions in China. There-fore, our study supports the classification of char-EC and soot-EC proposed by Han et
al. (2010), and the ratio of EC2+3 to EC1 can serve as an indication of a continental
20
effect. This result agrees well with air mass trajectories, which will be discussed in the
following section. For example, the EC2+3/EC1 ratios for the days shown in Fig. 9 are
(a) 0.96, (b) 0.17, (c) 0.32, (d) 0.47, and (e) 1.79.
Except for summer, EC1 was closely correlated with potassium, which, among the water-soluble ions, is traditionally well known as an indication of biomass burning (Silva
25
et al., 1999; Guazzotti et al., 2003). Because char-EC has a wide variety of sources and its concentration itself does not provide accurate information about the source, this approach can suggest the contribution of biomass burning to EC1 concentration
ACPD
11, 20521–20573, 2011PM10, PM2.5 and PM1.0
at Gosan ABC superstation
S. Lim et al.
Title Page
Abstract Introduction
Conclusions References
Tables Figures
◭ ◮
◭ ◮
Back Close
Full Screen / Esc
Printer-friendly Version
Interactive Discussion
Discussion
P
a
per
|
Dis
cussion
P
a
per
|
Discussion
P
a
per
|
Discussio
n
P
a
per
|
accounted for∼50–99 %, which could be associated with mineral dust as well as
com-bustion aerosols. In PM10, nss-K+ was well correlated with nss-SO24− (R2=0.70), but
moderately correlated with nss-Ca2+ (R2=0.53). In addition, nss-K+ and nss-SO24−
showed similarity in size distribution of being enriched in fine mode. Among OC sub-components, OC2, thought to be secondary, was significantly correlated with sulfate
5
and potassium. In the airborne measurements of trace elements produced from sa-vanna biomass burning, Gaudichet et al. (1995) indicated that near the emission, K
was mainly present as KCl, evolving to K2SO4 in the ambient samples. Thus, our
potassium would be likely to represent the effect of biomass burning, even if it may
include some of fossil fuel combustion, dust, and sea salt as well.
10
Li et al. (2006) quantified EC and OC concentrations in Horquin sandland in north-eastern China by a thermal method and reported the strongest correlation of EC with potassium among five elements, suggesting a significant contribution of rural biomass burning to regional carbonaceous aerosol concentrations. A previous study estimated the emissions of BC in China and pointed out that biomass burning is one of the main
15
sources of BC in China (Streets et al., 2003). Gustafsson et al. (2009) used 14C to
distinguish fossil fuel and biomass-burning contributions to BC during pollution events in South Asia. They found a far larger contribution of biomass combustion to BC emis-sions. Biomass burning occurs on a global scale by fires due to slash-and-burn land clearance, waste burning in agriculture and forestry, and residential wood
combus-20
tion. In particular, East Asia contains biomass burning sources in undeveloped re-gions of China, Siberia, and North Korea. Biomass combustion-derived materials are likely generated throughout, with the strongest correlations in winter and spring, and transported to the study area. In summer, it is possible that reduced burning and
rel-atively increased sea-salt potassium (ss-K+) lead to a poor correlation between EC1
25
and potassium, and that EC1 may deposit on the surface of larger and hygroscopic
ss-K+, leading to better correlation in PM10 than PM1.0. It is less likely that Siberian
ACPD
11, 20521–20573, 2011PM10, PM2.5 and PM1.0
at Gosan ABC superstation
S. Lim et al.
Title Page
Abstract Introduction
Conclusions References
Tables Figures
◭ ◮
◭ ◮
Back Close
Full Screen / Esc
Printer-friendly Version
Interactive Discussion
Discussion
P
a
per
|
Dis
cussion
P
a
per
|
Discussion
P
a
per
|
Discussio
n
P
a
per
|
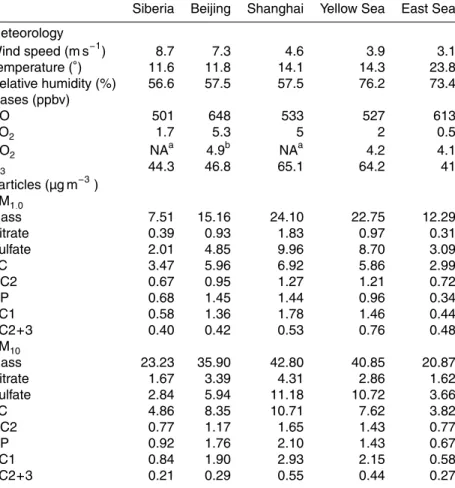
6 Source fingerprint
To examine the source signature of aerosols and the effect of transport paths on
aerosol composition, we categorized air masses into 5 regimes based on meteorolog-ical and chemmeteorolog-ical characteristics and air mass trajectories every 3 h using the FLEX-PART Lagrangian particle dispersion model (Stohl et al., 2005) (Fig. 9). In this analysis,
5
samples which were affected by precipitation or did not show constant trajectories in
time were excluded. The five types are labeled “Siberia”, “Beijing”, “Shanghai”, “Yellow Sea”, and “East Sea” according to the major geographical regions over which an air mass passed during transport. The Siberia, Beijing, Shanghai, Yellow Sea, and East Sea types included 6 days from October to March, 10 days from October to May, 4
10
days from October to May, 2 days in April, and 6 days from June to September, respec-tively. The characteristic regimes of each air type are summarized in Table 5. It should
be noted that the study region is heavily affected by the monsoon system, and
stag-nant conditions often developed during transition periods, when trajectories tended to spread over wider areas.
15
From late fall to early spring, the study region is under the influence of frontal system in association with a Siberian high that is periodically extends towards the southeastern China. As a high pressure approaches, air is usually transported directly from Siberia to Jeju along with a trough. Then high pressure center shifts its way to the southeast and wind turns to northwesterly. While the former represents the continental background
20
air descending from the free troposphere in Siberian region, the latter is classified as Beijing type air that passed fast over Mongolia and Beijing region. As the high pressure is weakened, the air slowly moves down to the southern part of China or over the Yellow Sea before reaching Gosan. The former is classified as Shanghai type that captured the emissions from the southern (Shanghai) as well as northern (Beijing) part of China.
25
ACPD
11, 20521–20573, 2011PM10, PM2.5 and PM1.0
at Gosan ABC superstation
S. Lim et al.
Title Page
Abstract Introduction
Conclusions References
Tables Figures
◭ ◮
◭ ◮
Back Close
Full Screen / Esc
Printer-friendly Version
Interactive Discussion
Discussion
P
a
per
|
Dis
cussion
P
a
per
|
Discussion
P
a
per
|
Discussio
n
P
a
per
|
air mass in summer. Siberia type can be regarded as clean background air of the northeast Asia (Fig. 9a). The Beijing and Shanghai types represent fresh continental and aged continental plume, respectively (Fig. 9b and c). As being aged over the ocean, the Yellow Sea type exhibits characteristics of continental plumes (Fig. 9d) and is distinguished from East Sea type air (Fig. 9e).
5
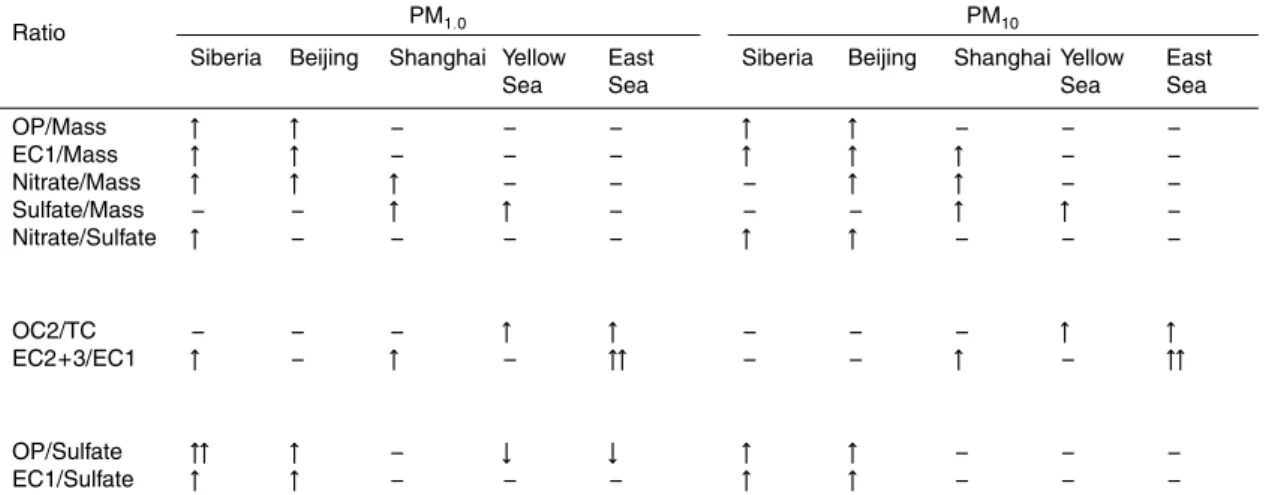
For each air mass category, the ratios of major constituents in submicron and su-permicron aerosols are compared in Table 6. Siberia air showed the lowest levels of
CO, sulfate, and PM1.0 mass concentrations, resulting in high ratios of chemical
con-stituents. In Beijing type air, the ratios of OP, EC1, and nitrate to mass were the highest. In contrast, an enhanced sulfate/mass ratio was recognizable in Shanghai and Yellow
10
Sea air masses. For these two air masses, the high sulfate content was the result of fa-vorable meteorological conditions such as weak winds and high relative humidity over a warm sea surface (Fig. 9c and d) (Lim et al., 2010a, b) in conjunction with sources from nearby land. The higher nitrate/sulfate ratios in Beijing type air mass are largely due to the temperature dependency of nitrate because the Beijing air was more
fre-15
quently encountered at Gosan in the colder seasons. Therefore, Beijing and Shanghai
plumes were unambiguously differentiated by the ratios of EC1, OP, and nitrate against
sulfate.
It is noteworthy that the OC2 fraction against total carbon was also much higher in the Yellow Sea and East Sea types, which could be characterized as relatively aged
20
marine air masses (Fig. 9d and e). It is supporting evidence for the secondary nature of OC2, such that its ratio to TC tended to be higher in the smaller particle sizes (Fig. 3j).
In addition, the ratio of EC2+3 to EC1 was distinctly higher in the East Sea air mass.
This result agrees with the findings of Han et al. (2010) and this study that the ratio of
EC2+3 to EC1 can serve as an indicator of continental effects and suggests a greater
25
influence of motor vehicle emissions from South Korea and Japan, with a reduced influence from China. This ratio is also likely to be increased in aged air due to the
ACPD
11, 20521–20573, 2011PM10, PM2.5 and PM1.0
at Gosan ABC superstation
S. Lim et al.
Title Page
Abstract Introduction
Conclusions References
Tables Figures
◭ ◮
◭ ◮
Back Close
Full Screen / Esc
Printer-friendly Version
Interactive Discussion
Discussion
P
a
per
|
Dis
cussion
P
a
per
|
Discussion
P
a
per
|
Discussio
n
P
a
per
|
In the present study, OP was recognized as a major component of OC and found to be a source signature of the Beijing type air mass. Through the entire period of ob-servation, OP was noticeably elevated when wind speed was high under the influence of a strong continental high or a migratory cyclone. As a result, high ratios of OP to EC1 were observed in fast-moving air parcels carried by northwesterly winds in winter
5
or northerly winds in spring, which could bring relatively fresh emissions from Beijing and its vicinity and plumes due to biomass burning in Mongolia (Kim et al., 2007) and Siberia if they existed (Fig. 9a). In contrast, OP remained low in the warmer seasons, which were characterized by stagnant air masses, leading to low OP/EC ratios. These variations are evident in Table 6, in which it can be seen that the ratio of OP/EC1 was
10
quite low in Yellow Sea and East Sea air masses. Therefore, the main sources of OP are likely to be coal combustion and biomass burning.
OP is defined as charred OC having characteristics similar to those of EC1; that is, it is likely a light-absorbing aerosol. The BC absorption spectrum measured by
Aethalometer revealed different tendencies among 7 wavelengths (Lim et al., 2011),
15
for some of which the absorption of short wavelength (370 nm) was greater than that of longer wavelengths. It is generally known that soot, which is composed of submicron particles of grape-like clusters, exhibits strong light absorption characteristics with little spectral dependence (Schnaiter et al., 2003; Kirchstetter et al., 2004). In the present study, the enhanced absorption of shortwave radiation was clear for samples containing
20
large amounts of OP. Thus, we believe that OP is light-absorbing organic carbon or a strong candidate for brown carbon. It has been reported in previous studies that particles from smoldering combustion (Patterson and McMahon, 1984), residential coal combustion (Bond, 2001), or biogenic emissions of humics and lignin (Andreae and Gelencs ´er, 2006) can contain substantial amounts of brown carbon. Clarke et al (2007)
25
found enhanced shortwave absorption by refractory OC from biomass burning, which was likely to be a primary aerosol.
ACPD
11, 20521–20573, 2011PM10, PM2.5 and PM1.0
at Gosan ABC superstation
S. Lim et al.
Title Page
Abstract Introduction
Conclusions References
Tables Figures
◭ ◮
◭ ◮
Back Close
Full Screen / Esc
Printer-friendly Version
Interactive Discussion
Discussion
P
a
per
|
Dis
cussion
P
a
per
|
Discussion
P
a
per
|
Discussio
n
P
a
per
|
carbon, makes it imperative to reassess and redefine the components that make up light-absorbing carbonaceous matter in the atmosphere (Andreae and Gelencs ´er, 2006; Alexander et al., 2008). There is a continuum of carbonaceous substances in atmospheric aerosols, where refractory organics included in a thermochemical clas-sification are consistent with colored organics in an optical clasclas-sification. These
so-5
called brown carbons have a sharply increased absorption efficiency toward shorter
wavelengths, although the absorption is much less than that of soot carbon at the wave-length of 550 nm, and this spectral dependence causes the material to appear brown and makes their absorption in the UV potentially significant due to the large amounts
occurring in continental aerosols (Kirchstetter et al., 2004; Hoffer et al., 2006).
How-10
ever, their optical properties, origin, and chemical composition are poorly understood and thus need further investigation.
The results discussed above highlight the fact that the Beijing air mass is distin-guished not only by higher ratios of EC1 and OP to mass but also by higher ratios of EC1 (and OP) to sulfate. This implies that air masses from the Beijing area may have
15
a more significant influence on net warming than do air masses from the other regions. This result confirms the main conclusion of Ramana et al. (2010), who estimated the impact of BC/sulfate ratios of air masses transported from the Beijing and Shanghai areas on net warming based on surface and aircraft measurements conducted over the Yellow Sea in spring and summer.
20
7 Conclusions
Daily PM1.0, PM2.5, and PM10 samples were taken at Gosan ABC Superstation on
Jeju Island from August 2007 to September 2008. The mass concentrations of PM1.0,
PM2.5, and PM10 varied between 1.26 µg m
−3 and 29.51 µg m−3, 3.94 µg m−3 and
39.17 µg m−3, and, 7.52 µg m−3 and 69.76 µg m−3, respectively. PM1.0 and PM2.5
ac-25
count for 48.4 % and 79.6 % of PM10, respectively, indicating a large portion of
ACPD
11, 20521–20573, 2011PM10, PM2.5 and PM1.0
at Gosan ABC superstation
S. Lim et al.
Title Page
Abstract Introduction
Conclusions References
Tables Figures
◭ ◮
◭ ◮
Back Close
Full Screen / Esc
Printer-friendly Version
Interactive Discussion
Discussion
P
a
per
|
Dis
cussion
P
a
per
|
Discussion
P
a
per
|
Discussio
n
P
a
per
|
made up 10.4 %, 9.8 %, and 6.0 % of PM1.0, PM2.5, and PM10, respectively. Unlike
EC, OC accounted for 23.0 %, 22.9 %, and 16.4 % in PM1.0, PM2.5, and PM10,
respec-tively. The size distributions of OC subcomponents such as OC3 and OC4 reflected substantial contributions of primary sources such as dust, sea salt, or biogenic matter. The definition and measurement techniques for atmospheric EC (or BC) have long
5
been subjects of scientific controversy. We compared our observed EC with BC
measurements obtained by Aethalometer and found a perfect relationship with a slope
of 1.0 for PM1.0EC1 (but not for PM10). This result indicates that coarse particles have
lower light-absorbing efficiency than fine particles. In our data, EC and sulfate were
well correlated, meaning that there is difficulty in distinguishing absorbing aerosols from
10
scattering aerosols. For EC, the definition of EC1 as char-EC and EC2+3 as soot-EC
applied well to our measurements; the former is emitted from smoldering combustion (such as biomass burning and residential and coal combustion), and the latter is gen-erated from flaming combustion (such as motor vehicle exhaust and coal combustion).
The mean EC1 concentrations were almost two times higher than the mean EC2+3
15
concentrations for all three particle sizes, ranging from 0.96 µg m−3 to 1.39 µg m−3 for
EC1 and from 0.30 µg m−3to 0.46 µg m−3for EC2+3. EC1 was strongly correlated with
potassium throughout the year except for summer. While EC2+3 was more enriched in
PM1.0, EC1 favored PM2.5 or PM10. As a result, EC1 was more sensitive to wet
scav-enging, and the ratio of EC1 to EC2+3 was higher in summer. This difference was likely
20
linked with a longer residence time of EC2+3 than that of EC1 in the atmosphere. This
result implies a role of EC2+3 as a contribution to warming, particularly at a regional
scale, due to its longer lifetime, even though its concentrations in the atmosphere are lower.
This study highlights the ratios of major chemical species as useful tools to
distin-25
ACPD
11, 20521–20573, 2011PM10, PM2.5 and PM1.0
at Gosan ABC superstation
S. Lim et al.
Title Page
Abstract Introduction
Conclusions References
Tables Figures
◭ ◮
◭ ◮
Back Close
Full Screen / Esc
Printer-friendly Version
Interactive Discussion
Discussion
P
a
per
|
Dis
cussion
P
a
per
|
Discussion
P
a
per
|
Discussio
n
P
a
per
|
influenced by China, the Korean emissions affected the Yellow Sea and East Sea type
air masses. For the East Sea air, Japanese and Korean influences were dominant. The Beijing type air was the freshest and was distinguished by higher concentrations of EC
and OP relative to sulfate, signifying a higher net warming effect of aerosols in this air
type than in the other three types. OP was also suggested as a light-absorbing form
5
of carbon. On the other hand, sulfate was remarkably enhanced in air that had been slowly transported over China or the Yellow Sea, which was the case of the Shanghai and Yellow Sea air masses. The aged air masses of Yellow Sea and East Sea types in particular showed lower OP to sulfate ratios and higher OC2 to TC ratios. The latter implies a secondary role among OC fractions in conjunction with a tendency of
enrich-10
ment at smaller aerosol sizes. Furthermore, the highest ratio of EC2+3 to EC1 was
found in the East Sea air, in sharp contrast with the other air mass categories, which showed more impact of Chinese emissions.
Acknowledgements. Authors thank to Stohl for allowing us to use Flexpart results at Gosan.
This study was supported by the Korea Research Foundation through a grant KRF-2008-314-15
C00402.
References
Aggarwal, S. G. and Kawamura, K.: Carbonaceous and inorganic composition in long-range transported aerosols over northern Japan: Implication for aging of water-soluble organic fraction, Atmos. Environ., 43,(16), 2532–2540, 2009.
20
Akimoto, Hajime: Global Air Quality and Pollution, Science, 302, 5651, 1716–1719, doi:10.1126/science.1092666, 2003.
Alexander, D. T. L., Crozier, P. A., and Anderson, J. R.: Brown Carbon Spheres in East Asian Outflow and Their Optical Properties, Sci., 321, 833–836, doi:10.1126/science.1155296, 2008.
25
ACPD
11, 20521–20573, 2011PM10, PM2.5 and PM1.0
at Gosan ABC superstation
S. Lim et al.
Title Page
Abstract Introduction
Conclusions References
Tables Figures
◭ ◮
◭ ◮
Back Close
Full Screen / Esc
Printer-friendly Version
Interactive Discussion
Discussion
P
a
per
|
Dis
cussion
P
a
per
|
Discussion
P
a
per
|
Discussio
n
P
a
per
|
Andrews, E., Saxena, P., Musarra, S., Hildemann, L. M., Koutrakis, P., McMurry, P. H., Olmez, I., and White, W. H.: Concentration and composition of atmospheric aerosols from the 1995 SEAVS experiment and a review of the closure between chemical and gravimetric measure-ments, J. Air Waste Manage. Assoc., 50, 648–664, 2000.
Bassett, M. E. and Seinfeld, J. H.: Atmospheric equilibrium model of sulfate and nitrate 5
aerosols-II. Particle size analysis, Atmos. Environ., 18, 1163–1170, 1984.
Bond, T. C.: Spectral dependence of visible light absorption by carbonaceous particles emitted from coal combustion, Geophys. Res. Lett., 28, 4075–4078, doi:10.1029/2001GL013652, 2001.
Bond, T. C., Covert, D. S., Kramlich, J. C., Larson, T. V., and Charlson, R. J.: Primary par-10
ticle emissions from residential coal burning: Optical properties and size distributions, J. Geophys. Res., 107(D21), 8347, doi:10.1029/2001JD000571, 2002.
Bond, T. C., Habib, G., and Bergstrom, R. W.: Limitations in the enhancement of visible light absorption due to mixing state, J. Geophys. Res., 111, D20211, doi:10.1029/2006JD007315, 2006.
15
Bond, T. C., Bhardwaj, E., Dong, R., Jogani, R., Jung, S., Roden, C., Streets, D. G., and Trautmann, N. M.: Historical emissions of black and organic carbon aerosols from energy-related combustion, 1850–2000, Global Biogeochem. Cy., 21, GB2018, doi:10.1029/2006GB002840, 2007.
Brasseur, G. P., Orlando, J. J., and Tyndall, G. S.: Atmospheric Chemistry and Global Change. 20
Oxford University Press., Oxford, UK, 654, 1999.
Buzorius, G., McNaughton, C. S., Clarke, A. D., Covert, D. S., Blomquist, B., Nielsen, K., and Brechtel, F. J.: Secondary aerosol formation in continental outflow conditions during ACE-Asia, J. Geophys. Res., 109(15), D24203, doi:10.1029/2004JD004749, 2004.
Cao, J. J., Lee, S. C., Ho, K. F., Zhang, X. Y., Zou, S. C., Fung, K., Chow, J. C., and Watson, J. 25
G.: Characteristics of carbonaceous aerosol in Pearl River Delta Region, China during 2001 winter period, Atmos. Environ., 37, 11, 1451–1460, 2003.
Cao, J. J., Wu, F., Chow, J. C., Lee, S. C., Li, Y., Chen, S. W., An, Z. S., Fung, K. K., Wat-son, J. G., Zhu, C. S., and Liu, S. X.: Characterization and source apportionment of atmo-spheric organic and elemental carbon during fall and winter of 2003 in Xi’an, China, Atmos. 30
Chem. Phys., 5, 3127–3137, doi:10.5194/acp-5-3127-2005, 2005.