ACPD
10, 24961–24992, 2010On the potential contribution of open
lead particle emissions
A. Held et al.
Title Page
Abstract Introduction
Conclusions References
Tables Figures
◭ ◮
◭ ◮
Back Close
Full Screen / Esc
Printer-friendly Version Interactive Discussion
Discussion
P
a
per
|
Dis
cussion
P
a
per
|
Discussion
P
a
per
|
Discussio
n
P
a
per
|
Atmos. Chem. Phys. Discuss., 10, 24961–24992, 2010 www.atmos-chem-phys-discuss.net/10/24961/2010/ doi:10.5194/acpd-10-24961-2010
© Author(s) 2010. CC Attribution 3.0 License.
Atmospheric Chemistry and Physics Discussions
This discussion paper is/has been under review for the journal Atmospheric Chemistry and Physics (ACP). Please refer to the corresponding final paper in ACP if available.
On the potential contribution of open lead
particle emissions to the central Arctic
aerosol concentration
A. Held1,2, I. M. Brooks3, C. Leck2,4, and M. Tjernstr ¨om2,4
1
University of Bayreuth, Bayreuth Center of Ecology and Environmental Research, 95440 Bayreuth, Germany
2
Stockholm University, Department of Meteorology, 10691 Stockholm, Sweden
3
University of Leeds, School of Earth and Environment, Leeds, LS2 9JT, UK
4
Bert Bolin Center for Climate Research, Stockholm University, 10691 Stockholm, Sweden Received: 10 September 2010 – Accepted: 18 October 2010 – Published: 25 October 2010 Correspondence to: A. Held ([email protected])
ACPD
10, 24961–24992, 2010On the potential contribution of open
lead particle emissions
A. Held et al.
Title Page
Abstract Introduction
Conclusions References
Tables Figures
◭ ◮
◭ ◮
Back Close
Full Screen / Esc
Printer-friendly Version Interactive Discussion
Discussion
P
a
per
|
Dis
cussion
P
a
per
|
Discussion
P
a
per
|
Discussio
n
P
a
per
|
Abstract
During the ice-breaker borne ASCOS expedition (Arctic Summer Cloud Ocean Study) direct eddy covariance measurements of aerosol number fluxes were carried out in August 2008 on the edge of an ice floe drifting in the central Arctic Ocean between 2◦– 10◦W longitude and 87◦–87.5◦N latitude. The median aerosol transfer velocities over
5
different surface types (open water leads, ice ridges, snow and ice surfaces) ranged from 0.27 to 0.68 mm s−1 during deposition-dominated episodes. Emission periods were observed more frequently over the open lead, while the snow behaved primarily as a deposition surface. Directly measured aerosol fluxes were compared with particle deposition parameterizations in order to estimate the emission flux from the observed
10
net aerosol flux. Finally, the contribution of the open lead particle source to atmo-spheric variations in particle number concentration was evaluated and compared with the observed temporal evolution of particle number. The direct emission of aerosol particles from the open lead can only explain 5–10% of the observed particle number variation in the mixing layer close to the surface.
15
1 Introduction
The Arctic region north of 80◦N provides a unique setting to investigate the impact of aerosol particles on the climate system. Complex aerosol-cloud-ice-ocean interac-tions can be studied under very limited anthropogenic influence especially during the summer months (Leck and Persson, 1996). While the influx of polluted mid-latitude air
20
and extended aerosol residence times lead to elevated aerosol concentrations during the winter to early spring Arctic haze period (Heintzenberg and Leck, 1994), minimum effects from continental sources are encountered during summer from June to August when the central Arctic lower atmosphere is effectively isolated from anthropogenic emissions due to the prevailing atmospheric circulation patterns and near-surface
pro-25
ACPD
10, 24961–24992, 2010On the potential contribution of open
lead particle emissions
A. Held et al.
Title Page
Abstract Introduction
Conclusions References
Tables Figures
◭ ◮
◭ ◮
Back Close
Full Screen / Esc
Printer-friendly Version Interactive Discussion
Discussion
P
a
per
|
Dis
cussion
P
a
per
|
Discussion
P
a
per
|
Discussio
n
P
a
per
|
The complex aerosol-cloud-radiation interactions in the Arctic constitute a warming factor for the regional climate during most of the year (e.g. Intrieri et al., 2002; Tjern-str ¨om, 2005). This is due partly to the semi permanent ice cover, raising the surface albedo compared to that of the ocean surface, and partly to the very clean air, reducing the cloud albedo. Under clean air conditions as observed in the Arctic summer, even
5
small numbers of ice nuclei (Bigg, 1996) potentially play a key role in cloud develop-ment, and thus, the regional climate (e.g. Prenni et al., 2007; M ¨ohler et al., 2007). As long as there are no major intrusions of polluted air (e.g. Carrio et al., 2005), extremely low aerosol particle and cloud condensation nuclei (CCN) concentrations in the high Arctic (e.g. Bigg et al., 1996; Bigg and Leck, 2001; Leck et al., 2002; Lohmann and
10
Leck, 2005) will result in low concentrations of relatively large cloud droplets, leading to a relatively low cloud albedo and to frequent formation of drizzle (e.g. Rasmussen et al., 2002). Previous studies indicate that drizzle formation is likely to affect bound-ary layer motions on different temporal scales (e.g. Feingold et al., 1999). Optically thin stratiform clouds play a prominent role over the central Arctic Ocean. While they
15
are the single most important factor determining the surface radiation budget, current climate models are unable to yield a realistic description of Arctic clouds and their im-pact on the surface radiation (e.g. Walsh et al., 2002; Tjernstr ¨om et al., 2008; Karlsson and Svensson, 2010), and they are far from incorporating the relevant cloud-ice-ocean feedbacks. Model projections suggest that the Arctic regional climate could transition
20
into a new stable regime with no summer sea-ice within only a few decades (Lenton et al., 2008). This would impact considerably on the Arctic Ocean ecosystem and affect large-scale atmospheric and oceanic circulation patterns. Refined parameterizations of aerosol-cloud feedbacks in global and regional climate models require development of novel observational capabilities and extensive field investigations to identify and
quan-25
tify aerosol sources, sinks, and transport and transformation processes.
ACPD
10, 24961–24992, 2010On the potential contribution of open
lead particle emissions
A. Held et al.
Title Page
Abstract Introduction
Conclusions References
Tables Figures
◭ ◮
◭ ◮
Back Close
Full Screen / Esc
Printer-friendly Version Interactive Discussion
Discussion
P
a
per
|
Dis
cussion
P
a
per
|
Discussion
P
a
per
|
Discussio
n
P
a
per
|
lead to decreased ice melt, while an increase in ice melt would lead to a decreased surface albedo through formation of melt ponds on the ice (Leck et al., 2004). Over the central Arctic Ocean, a local biogenic source of aerosol particles from bursting bubbles at the water-air interface has been suggested (e.g. Leck and Bigg, 1999, 2005a; Leck et al., 2002). It links marine biological activity, clouds and climate through the
ejec-5
tion of organic microcolloids (Wells and Goldberg, 1991) from the surface microlayer of open leads (Bigg et al., 2004) into the atmosphere. Once airborne, some of these par-ticles may act directly as CCN, while others are activated after condensational growth (Leck and Bigg, 2005b). Even though this source of CCN may explain some important aspects of the Arctic aerosol-cloud-climate relationship, many of the controlling
mech-10
anisms, e.g. the dependence of the bubble-bursting mechanism on wind, temperature, salinity, and possibly other factors, remain unknown.
This study aims to evaluate the relevance of particles emitted directly from open leads in Arctic aerosol-ice-cloud interactions, and quantifying its contribution to the atmospheric aerosol burden by direct measurements of the net particle flux.
15
Previously, turbulent particle fluxes have been measured in the high Arctic over the open sea and over the pack ice (Nilsson and Rannik, 2001). However, the measure-ment footprints over the pack ice were generally large, and Nilsson and Rannik (2001) acknowledge that most measurements were influenced by a mix of open lead and ice surfaces. In this study, turbulence measurements were performed closer to the
sur-20
face and close to the edge of a lead, thus decreasing the footprint areas and allowing for a better separation of measurements influenced by the open lead and by the ice and snow surfaces, respectively, depending on the wind direction. Still, the problem remains that eddy covariance flux measurements yield a net flux which is a superposi-tion of particle emission and deposisuperposi-tion fluxes. In order to derive the emission flux, an
25
ACPD
10, 24961–24992, 2010On the potential contribution of open
lead particle emissions
A. Held et al.
Title Page
Abstract Introduction
Conclusions References
Tables Figures
◭ ◮
◭ ◮
Back Close
Full Screen / Esc
Printer-friendly Version Interactive Discussion
Discussion
P
a
per
|
Dis
cussion
P
a
per
|
Discussion
P
a
per
|
Discussio
n
P
a
per
|
2 Method and site
Turbulent aerosol number fluxes were measured from an ice floe drifting in the central Arctic Ocean between 2◦–10◦W and 87◦–87.5◦N from 17 August to 1 September, 2008. An eddy covariance system was set up on the edge of an open lead at 2.5 m above the surface. Depending on the wind direction, the measured turbulent fluxes were
5
influenced by the open lead or by the ice floe. The system consisted of a Gill R3 sonic anemometer (Gill, Lymington, UK) for three-dimensional wind measurements, a Licor LI-7500 gas analyzer (Licor, Lincoln, NE, USA) for carbon dioxide (CO2) and water (H2O) vapor concentration measurements, and a condensation particle counter CPC 3760A (TSI, St. Paul, MN, USA) for number concentration measurements of particles
10
greater than 11 nm in diameter. The response time of the particle counter, including the sampling line, was approximately 1.4 s. Wind and CO2/H2O data were logged at 20 Hz, while particle number concentration data at 10 Hz, using a MOXA UC7420 computer (Moxa Inc., Brea, CA, USA). All instruments were battery-operated during the entire measuring period.
15
Aerosol number fluxes were calculated according to standard eddy covariance pro-cedures, with 30 min averaging, after a coordinate rotation using the planar fit method (Wilczak et al., 2001), and linear detrending of the aerosol number time series. Be-cause of the traveling time of the aerosol sample from the sampling point through the inlet tubing to the particle counter, and the traveling time in the particle counter,
20
a constant time lag of 2.6 s was used to synchronize the wind with the aerosol time series. This time lag was confirmed by maximizing the covariance given by the cross-correlation function of the vertical wind speed and particle number concentration. The passage through the sampling line also degraded the response time of the system with regard to ambient aerosol concentration changes. It is important to bear in mind
25
ACPD
10, 24961–24992, 2010On the potential contribution of open
lead particle emissions
A. Held et al.
Title Page
Abstract Introduction
Conclusions References
Tables Figures
◭ ◮
◭ ◮
Back Close
Full Screen / Esc
Printer-friendly Version Interactive Discussion
Discussion
P
a
per
|
Dis
cussion
P
a
per
|
Discussion
P
a
per
|
Discussio
n
P
a
per
|
wind speeds of less than 3 m s−1, we found the magnitude of this correction to be typi-cally less than 50%. No additional corrections were applied to the aerosol fluxes.
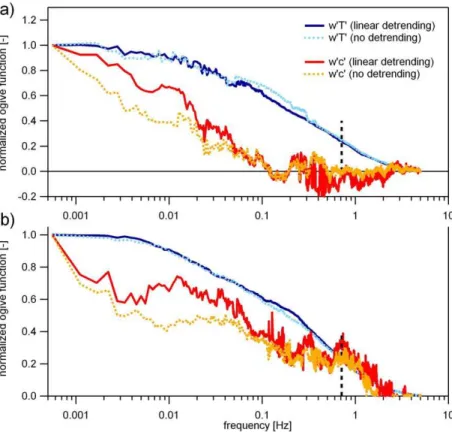
Spectral analysis of the aerosol number concentration time series confirmed the lim-ited response time of the eddy covariance setup. Figure 1 presents normalized ogive functions, i.e. cumulative cospectra of the vertical wind speed w vs. sonic
tempera-5
tureT and aerosol numberc, during two different measurement periods on 20 August and 24 August 2008. The buoyancy flux ogives exhibit a typical shape with flux con-tributions in the frequency range from 0.03 Hz to 5 Hz. In general, the aerosol ogives show much higher scatter. On 20 August, shown in Fig. 1a, there are only negligible contributions to the aerosol cospectrum at frequencies above 0.2 Hz. In contrast, on
10
24 August shown in Fig. 1b, we observe high frequency flux contributions even be-yond the frequency corresponding with the approximate response time of the particle counter (1.4 s, dashed vertical line). On 24 August, the cospectral shape of aerosol and temperature are rather similar. However, at low frequencies, the buoyancy flux ogive flattens out around 0.03 Hz, whereas the aerosol ogive deviates from this behavior in
15
the range from 0.002 to 0.02 Hz.
Data quality was evaluated by testing the stationarity of the time series according to Foken and Wichura (1996). Data were discarded when the average of six 5 min in-tervals of the standard deviation of the particle number concentration (or temperature) deviated by more than 70% from the 30 min standard deviation. We also discarded
20
data if the 30 min standard deviation of the particle number concentration was larger than 30 cm−3, indicating particle pollution from, for example, snow mobiles or helicopter flights. Moreover, the integral turbulence characteristic of the vertical wind was calcu-lated as the ratio of the standard deviation of the vertical wind speed, σw, and the friction velocity,u∗, and compared to the parameterization recommended by Thomas
25
ACPD
10, 24961–24992, 2010On the potential contribution of open
lead particle emissions
A. Held et al.
Title Page
Abstract Introduction
Conclusions References
Tables Figures
◭ ◮
◭ ◮
Back Close
Full Screen / Esc
Printer-friendly Version Interactive Discussion
Discussion
P
a
per
|
Dis
cussion
P
a
per
|
Discussion
P
a
per
|
Discussio
n
P
a
per
|
The surface roughness was characterized by an estimate of the roughness lengthz0 which was derived from
ln z
z0=
u·κ
u∗ (1)
with z: measurement height [m], u: wind speed [m s−1], κ: von Karman constant (=0.40), andu∗: friction velocity [m s−1].
5
Evaluation of the atmospheric stability conditions was based on the stability param-eterz/L, the ratio of the measurement height and the Obukhov lengthL,
L=−
u3∗
κgTw′T′
(2)
with g: gravitational acceleration (9.81 m s−2), T: sonic temperature [K], and w′T′: buoyancy flux [K m s−1] based on the sonic temperature fluctuations.
10
Turbulent particle exchange is widely quantified by normalizing the turbulent particle fluxFcwith the corresponding particle number concentrationc,
vt=−Fc
c (3)
The resulting quantity vt is a normalized flux, often termed “deposition velocity”, or “transfer velocity” in order to include emission and deposition fluxes equally. The
un-15
certainty of the transfer velocity measurements due to counting statistics, ∆vt, was approximated according to Fairall (1984) by
∆vt=−
σw √
N
(4)
withN: number of counted particles in averaging interval [–]. In 90% of the observa-tions, the uncertainty due to counting statistics was less than 30%. Normalizing the flux
20
ACPD
10, 24961–24992, 2010On the potential contribution of open
lead particle emissions
A. Held et al.
Title Page
Abstract Introduction
Conclusions References
Tables Figures
◭ ◮
◭ ◮
Back Close
Full Screen / Esc
Printer-friendly Version Interactive Discussion
Discussion
P
a
per
|
Dis
cussion
P
a
per
|
Discussion
P
a
per
|
Discussio
n
P
a
per
|
number concentration. However, the concept of a transfer velocity according to Eq. (3) is physically unrealistic and contradicts the gradient approach (Foken, 2008). Strictly, the transfer velocity should be defined in terms of the particle number gradient. Then, it can be considered consistent with flux-profile relationships which relate the particle flux and the particle concentration difference between two heights if the effective
turbu-5
lent exchange between these two heights is known. We restrict the application ofvt to particle deposition, where it can be described as a reciprocal resistanceRt controlling the particle flux to the surface, vt=R−1
t . The total resistance Rt is a combination of the aerodynamic resistance,Ra, the quasi-laminar sublayer resistance,Rb, the surface resistance,Rc, and the gravitational settling velocity,vg, thus
10
vt= 1
Rt
= 1
Ra+Rb+Rc
+vg (5)
Applying the resistance analogy, size-resolved particle deposition is calculated using four different parameterizations following the parameterizations presented in Nilsson and Rannik (2001) and Zhang et al. (2001), respectively. The exact parameterizations can be found in these references. Here, we only repeat the different parameterizations
15
of the quasi-laminar sublayer resistance,Rb, which exhibit the most prominent diff er-ences: Nilsson and Rannik (2001) used a parameterization ofRb given by Schack et al. (1985):
Rb,NR=
AD 2
/3u∗
z0 1/2
ν1/6+Bdp2
u ∗
z0 3/2
ν−1/2
−1
(6)
Dis the diffusion coefficient,νis the kinematic viscosity,dpis the particle diameter, and
20
Aand B are empirical parameters depending on the surface type. Nilsson and Ran-nik (2001) usedA=0.4 andB=20, leading to the best agreement of their measured and calculated transfer velocities. For comparison, we also used the original values
ACPD
10, 24961–24992, 2010On the potential contribution of open
lead particle emissions
A. Held et al.
Title Page
Abstract Introduction
Conclusions References
Tables Figures
◭ ◮
◭ ◮
Back Close
Full Screen / Esc
Printer-friendly Version Interactive Discussion
Discussion
P
a
per
|
Dis
cussion
P
a
per
|
Discussion
P
a
per
|
Discussio
n
P
a
per
|
A simple parameterization ofRbis given by EMEP (2003) for gas-phase species:
Rb,EMEP= 2
κu∗
ν
0.72D
2/3
(7)
We acknowledge that this parameterization is intended for gas-phase constituents. However, since the particle number flux is often dominated by sub-50 nm diameter particles which exhibit gas-like behavior (Held et al., 2006), Rb,EMEP is included for
5
comparison.
Finally, Zhang et al. (2001) use the following parameterization ofRb:
Rb,Zh=
ε0u∗
ν
D
−1/2
+ St
2
400+St2
exp
−St 1
/2
−1
(8)
Here,ε0 is an empirical constant taken as 0.1, andStis the Stokes number which is calculated according to Giorgi (1988) as
10
St=vgu 2 ∗
gν . (9)
3 Results and discussion
3.1 Aerosol flux observations – division into sectors
Depending on the wind direction, the fetch of the turbulence measurement was from the open lead, the ice floe, pressure ridges, the floe edge, or a combination of these
15
surface features. Based on the surface roughness, expressed through the roughness lengthz0, six sectors were identified with different fetch characteristics.
ACPD
10, 24961–24992, 2010On the potential contribution of open
lead particle emissions
A. Held et al.
Title Page
Abstract Introduction
Conclusions References
Tables Figures
◭ ◮
◭ ◮
Back Close
Full Screen / Esc
Printer-friendly Version Interactive Discussion
Discussion
P
a
per
|
Dis
cussion
P
a
per
|
Discussion
P
a
per
|
Discussio
n
P
a
per
|
sonic anemometer. While the ice floe was rotating with respect to true North, the given relative wind directions are constant in the local frame of reference as shown in Fig. 2b. The roughness length varies mainly between 10−2and 10−5m showing a clear de-pendence on wind direction due to changes in surface type between sectors. These
z0values are in good agreement with typicalz0values reported for water and ice
sur-5
faces ranging from 10−3to 10−5m (Foken, 2008). Tjernstr ¨om (2005) estimated a mean value of 3×10⁻³m from the Arctic Ocean Experiment 2001, with a similar dependence on wind direction and a span from 10−5 to 10−2m. Persson et al. (2002) report a mean value of 4.5×10⁻⁴m based on measurements from the Surface Heat Budget of the Arctic Ocean (SHEBA) experiment (Uttal et al., 2002) flux tower, while Andreas
10
et al. (2010) obtain a value of 2.3×10⁻⁴ m based on the SHEBA dataset. Figure 2b displays an aerial view of the measurement site and the surface properties of the six sectors. The lowest surface roughness is found in sector D, a smooth ice surface lack-ing large roughness elements. In contrast, the ice surface in sector C contains several pressure ridges and large ice blocks. These roughness elements explain somewhat
15
higherz0values in sector C compared with sector D. The rugged floe edges in sectors B and E lead to increased surface roughness in these sectors. However, large frac-tions of smoother ice and lead surfaces contribute to slightly lowerz0values in sector E. Sector F provides a wide open lead fetch and exhibits relatively low z0 values. In contrast, the open lead fetch in sector A is rather small and the high surface roughness
20
is dominated by the edge of the opposite ice floe. Also, it is important to note that widening and closing of the lead over the measurement period introduces some vari-ability in the contribution of open lead, floe edge and ice surfaces to the measurement fetch from the lead direction.
Figure 3 shows the cumulative distribution of the net aerosol number fluxes in the
25
six different sectors. Each trace starts at the lowest measured aerosol flux, and then indicates the fraction of measurements below a certain aerosol number flux in each sector. For example, the value for Fc=0 m−
2
ACPD
10, 24961–24992, 2010On the potential contribution of open
lead particle emissions
A. Held et al.
Title Page
Abstract Introduction
Conclusions References
Tables Figures
◭ ◮
◭ ◮
Back Close
Full Screen / Esc
Printer-friendly Version Interactive Discussion
Discussion
P
a
per
|
Dis
cussion
P
a
per
|
Discussion
P
a
per
|
Discussio
n
P
a
per
|
of negative (deposition dominated) flux measurements of 80% and 65%, whereas in sectors B, E and F more or less equal fractions of positive and negative fluxes were observed. In sector A, more than 60% of the observed fluxes were dominated by emission. The highest positive (emission dominated) flux measurements were found in sector B, covering rough ice ridges. The rough surface in sector B also leads to
5
very large deposition dominated flux measurements. Strong deposition dominated flux measurements are also found over the ice floe in sectors C and D. These observations cannot be explained by different particle number concentrations, but are also found in the corresponding transfer velocities summarized in Table 1.
For reference, Table 1 also presents the number of 30 min periods dominated by
de-10
position (Ndep) or emission (Nem), the median values of wind speed and particle number concentration as well as friction velocityu∗ and roughness lengthz0. The median val-ues ofu∗andz0, wind speed and particle number concentration within each sector are very similar during emission and deposition dominated periods, except for sector A. Here, high particle numbers (147 cm−3) and low wind speeds (1.2 m s−1) are observed
15
during an emission dominated period on 18 August, and much lower particle num-bers (9 cm−3) yet higher wind speeds (3.1 m s−1) during a deposition dominated period on 25 August. The median values of the transfer velocity range from 0.27 mm s−1 to 0.68 mm s−1during deposition dominated periods. The magnitude of the observed de-position velocities, vt (dep), is in general agreement with earlier estimates of aerosol
20
fluxes over snow and ice surfaces. Ibrahim et al. (1983) report aerosol deposition veloc-ities ofvt=0.39 mm s−
1
under stable stratification andvt=0.96 mm s− 1
under unstable conditions using35S tagged ammonium sulfate particles. Duan et al. (1988) observed an average aerosol deposition velocity of particles in the diameter range from 150 to 300 nm ofvt=0.34 mm s−
1
over a partially snow covered field using optical particle
25
ACPD
10, 24961–24992, 2010On the potential contribution of open
lead particle emissions
A. Held et al.
Title Page
Abstract Introduction
Conclusions References
Tables Figures
◭ ◮
◭ ◮
Back Close
Full Screen / Esc
Printer-friendly Version Interactive Discussion
Discussion
P
a
per
|
Dis
cussion
P
a
per
|
Discussion
P
a
per
|
Discussio
n
P
a
per
|
Rannik (2001) measured aerosol number fluxes by eddy covariance in a similar set-ting in the high Arctic. They report median deposition velocitiesvt=0.26 mm s−
1 over smooth ice surfaces, andvtranging from 0.40 to 0.73 mm s−
1
over open lead surfaces. However, the footprints of their flux measurements were considerably larger than in this study, and also possibly a mixture of open lead and ice surfaces. It is interesting
5
to note that in the current measurements the highest particle number concentrations were found when the measurement is influenced by the open lead, in sectors A and F (Table 1).
In order to compare the aerosol number flux above the open lead and the ice surface, Fig. 4a presents the median aerosol number fluxes in 10◦wind direction bins over the
10
entire measurement period. In addition, the time fraction of emission dominated peri-ods for different relative wind directions is shown in Fig. 4b. One can easily distinguish two different regimes: for relative wind directions from sectors A and F, i.e. measure-ments dominated by the open lead, slightly positive median fluxes indicate aerosol emission, and a high fraction of emission periods can be found. In contrast, for relative
15
wind directions from sectors C and D, i.e. the ice-floe dominated fetch, only very few emission dominated periods are observed (Fig. 4b), and the median flux values are mostly negative indicating net deposition (Fig. 4a). Sectors B and E (grey shading) exhibit a transitional behavior.
3.2 Aerosol flux observations – temporal variability
20
In the following, the temporal variability of the measured fluxes will be discussed. Due to the very low flux estimates, a comparison of cumulative fluxes of momentum, buoy-ancy and particle number concentration is used. This means that emission fluxes will increase the previously accumulated flux value and deposition fluxes will decrease it. Thus, a positive slope indicates emission, a negative slope indicates deposition, and
25
the steeper the slope, the stronger the flux.
ACPD
10, 24961–24992, 2010On the potential contribution of open
lead particle emissions
A. Held et al.
Title Page
Abstract Introduction
Conclusions References
Tables Figures
◭ ◮
◭ ◮
Back Close
Full Screen / Esc
Printer-friendly Version Interactive Discussion
Discussion
P
a
per
|
Dis
cussion
P
a
per
|
Discussion
P
a
per
|
Discussio
n
P
a
per
|
number concentration from 26 to 29 August. During this four-day period, the lead started to freeze over, and it was continuously covered with a thin layer of ice starting from 27 August. In the night from 26 to 27 August emission dominates and there is weak upwards flux of particles, while particle deposition dominates the flux in the afternoon and evening, especially on 28 and 29 August. However, the particle fluxes
5
are very low throughout 27 August while buoyancy and momentum fluxes exhibit a clear increase in magnitude. On this day, the fetch was mostly over the lead in sector F. However, as noted above, the lead was covered with a thin layer of ice at this time.
The observations discussed above corroborate our findings that the open lead in-deed behaved as a source of aerosol particles under certain conditions, yet there is no
10
clear correlation with wind speed or momentum flux. This supports earlier suggestions (e.g. Leck and Bigg, 1999; Leck et al., 2002) that the open lead particle source is not exclusively driven by wind (such as the bubble-bursting mechanism at open sea). Pos-sible non-wind driven sources of bubbles are the release of bubbles trapped in melting sea ice, their transport to the surface by increased turbulence caused by supercooling
15
conditions (Grammatika and Zimmerman, 2001), or bubbles due to respiration of phy-toplankton (e.g. Johnson and Wangersky, 1987). Further investigation of alternative bubble source mechanisms can be found in Norris et al. (2010).
3.3 Deposition parameterizations and net flux observations
The net flux estimates derived from our eddy covariance measurements reflect the
20
combined effect of emission and deposition mechanisms on the turbulent vertical ex-change of particles. In order to obtain the emission flux, the deposition must be sub-tracted from the measured net flux. As mentioned earlier, a variety of size-resolved par-ticle deposition parameterizations exist which can be used to estimate the deposition. However, the uncertainties introduced by the parameterizations add to the
measure-25
ACPD
10, 24961–24992, 2010On the potential contribution of open
lead particle emissions
A. Held et al.
Title Page
Abstract Introduction
Conclusions References
Tables Figures
◭ ◮
◭ ◮
Back Close
Full Screen / Esc
Printer-friendly Version Interactive Discussion
Discussion
P
a
per
|
Dis
cussion
P
a
per
|
Discussion
P
a
per
|
Discussio
n
P
a
per
|
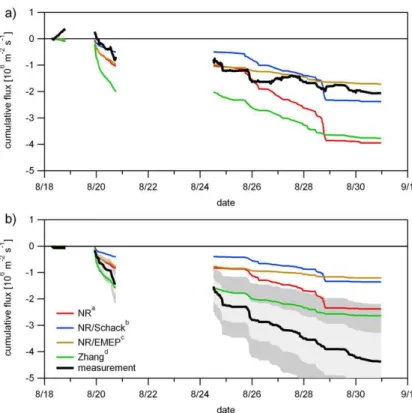
Figure 6a presents the cumulative particle number flux as measured from 18 to 31 August, and the cumulative deposition fluxes derived from four different particle deposi-tion parameterizadeposi-tions. The large data gap from 21 to 24 August is due to heavy riming on the sonic anemometer. When comparing the temporal behavior of the parame-terizations, two different pairs of deposition parameterizations can be found. Nilsson
5
and Rannik (2001) use the original parameterization of the quasi-laminar sublayer re-sistanceRb by Schack et al. (1985), but with different empirical parameters A and B (cf. Eq. 5). Replacing this formulation with a parameterization suggested by EMEP (2003) for gas-phase species yields deposition patterns similar to the parameterization by Zhang et al. (2001), however different absolute values.
10
On 18 August, all parameterizations suggest very low particle deposition indicat-ing that the net flux estimates are close to “true” emission values. On 24 August, a deposition period starts. The NR (Nilsson and Rannik) and NR/S (Nilsson and Ran-nik/Schack) parameterizations show two strong deposition periods during the nights from 25/26 and 28/29 August. The first deposition dominated period can also be found
15
in the observations, whereas the second period is qualitatively different from the ob-served net fluxes. This leads to a strong deviation of the cumulative flux values of the measurement and the NR parameterization at the end of the considered period.
Obviously, none of the deposition parameterizations are intended to reproduce par-ticle emission events. Therefore, in Fig. 6b emission periods are neglected, while only
20
deposition dominated periods are taken into account and added to the cumulative flux. The shaded areas indicate deviations of 25% (light grey) and 50% (dark grey) from the observed net flux. On 20 August, the Zhang parameterization is slightly larger than the observed flux, while all other parameterizations are smaller than the observed flux. However, during the period starting on 24 August, all parameterizations tend to
25
ACPD
10, 24961–24992, 2010On the potential contribution of open
lead particle emissions
A. Held et al.
Title Page
Abstract Introduction
Conclusions References
Tables Figures
◭ ◮
◭ ◮
Back Close
Full Screen / Esc
Printer-friendly Version Interactive Discussion
Discussion
P
a
per
|
Dis
cussion
P
a
per
|
Discussion
P
a
per
|
Discussio
n
P
a
per
|
Qualitatively, the Zhang parameterization tracks the observed net flux best. The EMEP parameterization clearly gives flux values much lower than observed. This may be ex-plained by the fact that the EMEP parameterization is originally designed for gas-phase species.
From this evaluation, there is no individual parameterization that can be considered
5
the “best” description of the deposition flux. All parameterizations show periods when they agree with, and periods when they deviate from, the observed fluxes. However, it is not possible to attribute these deviations to measurement uncertainties, or de-ficiencies of the parameterizations. In general, the EMEP parameterization may be considered a low estimate of particle deposition.
10
3.4 Potential contribution of vertical aerosol fluxes to the airborne particle burden
In order to evaluate the significance of direct particle emission and deposition, and its potential contribution to the atmospheric aerosol burden, the change in particle con-centration due to turbulent particle emission and deposition fluxes will be considered.
15
The goal is to obtain a rough estimate of the order of magnitude of the aerosol flux con-tribution to changes in particle number concentrations – can we expect to explain 1% or 50% or even more of the aerosol number variability just by vertical turbulent transport? For these calculations, the measured net fluxes were used to include both emission and deposition processes. In this simplified thought experiment we consider a closed
20
box. The top boundary is given by the mixing height. We neglect horizontal advection because we want to examine the local effect of vertical particle transport by turbulence only. We also neglect processes such as new particle formation and chemical reac-tions that potentially affect the particle number concentration. Thus, particles enter and leave the box through aerosol emission and deposition at the surface/atmosphere
25
ACPD
10, 24961–24992, 2010On the potential contribution of open
lead particle emissions
A. Held et al.
Title Page
Abstract Introduction
Conclusions References
Tables Figures
◭ ◮
◭ ◮
Back Close
Full Screen / Esc
Printer-friendly Version Interactive Discussion
Discussion
P
a
per
|
Dis
cussion
P
a
per
|
Discussion
P
a
per
|
Discussio
n
P
a
per
|
It should be noted that the net particle flux will be zero as soon as a uniform distribution with height is reached. Nevertheless, as a first-order approximation, we assume that at the end of each time interval particles emitted into or removed from the atmosphere will be distributed uniformly in a well-mixed volume defined by the emission/deposition area and the mixing layer height MLH [m]. Thus, for any emission/deposition fluxFc in
5
units m−2s−1, an estimate of the area fraction of open leadsa
OL, and a given MLH [m], we can derive a change in particle concentration due to the turbulent fluxFc from the open leads,∆f,MLH=Fc·aOL/MLH, and compare it with the measured change of particle concentration,∆c.
In Fig. 7, we compare the measured temporal change of the particle number
con-10
centration with the change as expected due to the turbulent particle fluxes assuming three different mixing layer heights and a given area fraction of the open leads. We assume that 25% of the surface area is covered by open leads (which can be consid-ered a high estimate), and 75% is ice-covconsid-ered; in scenario 1 the mixing height, MLH =2.5 m, in scenario 2, MLH=5 m, and in scenario 3, MLH=25 m. This assumption
15
is a clear oversimplification of the sea-ice-environment and does not take into account any temporal and spatial evolution of the sea-ice-distribution. The emission case in Fig. 7a shows much stronger variability in the measured particle number concentration than can be explained by the measured particle fluxes alone. In this example, the best estimate of the mixing layer height (a truly well-mixed layer, not the full boundary layer
20
depth) as determined by visual inspection of tethersonde profiles considering potential temperature, relative humidity and wind speed is MLH=25 m (scenario 3). This sce-nario results in changes of the particle number concentration of 5–6 cm−3over a time period of 12 h. A change in particle number comparable to the observed changes after 12 h is only produced assuming much shallower mixing layers of scenarios 1 and 2,
25
ACPD
10, 24961–24992, 2010On the potential contribution of open
lead particle emissions
A. Held et al.
Title Page
Abstract Introduction
Conclusions References
Tables Figures
◭ ◮
◭ ◮
Back Close
Full Screen / Esc
Printer-friendly Version Interactive Discussion
Discussion
P
a
per
|
Dis
cussion
P
a
per
|
Discussion
P
a
per
|
Discussio
n
P
a
per
|
concentration cannot be reproduced by ∆f,MLH. In this case, the best estimate of the mixing layer height is 10 m.
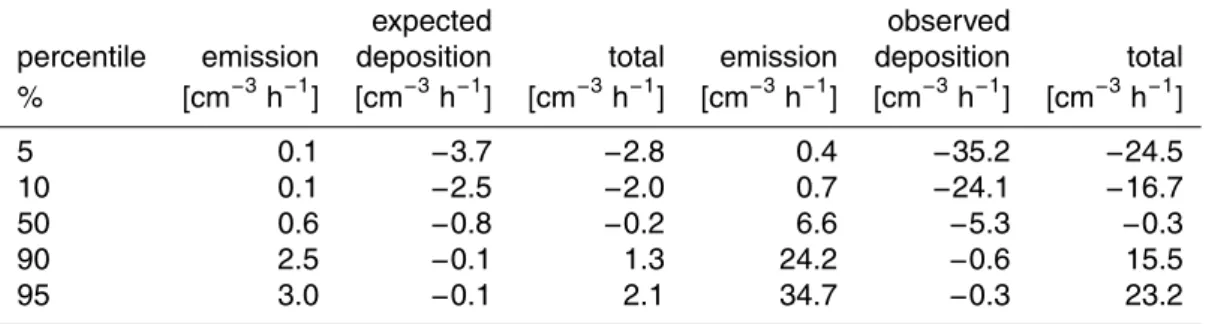
Overall, the evaluation of the aerosol flux contribution to changes in particle number concentrations can only be considered a rough estimate of the order of magnitude of this factor. In particular, the mixed layer depths represent absolute minimum depths
5
over which concentration changes should be evaluated; turbulent mixing will extend above these levels but become increasingly weak. Nevertheless, we find the direct impact of the turbulent particle flux on the atmospheric particle concentration to be minor. In about 85% of the evaluated cases, the flux-derived particle concentration change∆f,25 (assuming a typical mixing layer height of 25 m, and a 25% area fraction
10
of open leads) is less than 1 cm−3h−1, whereas more than 75% of the observed par-ticle concentration changes∆c are greater than 1 cm−
3
h−1. While the shape of the cumulative frequency distributions of∆f,25 and ∆care similar, the absolute magnitude of the particle concentration change differs by a factor of about 10 (cf. Table 2). There-fore, additional processes such as horizontal transport, new particle formation, and
15
chemical transformations will strongly affect the particle number concentration.
4 Conclusions
We have successfully carried out direct eddy covariance measurements of particle number fluxes on an ice floe in the central Arctic Ocean and found episodic aerosol emission from open leads. Simultaneous and independent gradient measurements
20
of particle concentrations (Orsini et al., 2010) corroborate our finding that open leads can indeed act as particle sources in the Arctic Ocean. Overall, the direct contribution of the open lead particle emissions to the atmospheric aerosol number concentration appears to be of minor importance, and can only explain a few percent of the ob-served particle number variability. Additional processes such as advection, chemical
25
ACPD
10, 24961–24992, 2010On the potential contribution of open
lead particle emissions
A. Held et al.
Title Page
Abstract Introduction
Conclusions References
Tables Figures
◭ ◮
◭ ◮
Back Close
Full Screen / Esc
Printer-friendly Version Interactive Discussion
Discussion
P
a
per
|
Dis
cussion
P
a
per
|
Discussion
P
a
per
|
Discussio
n
P
a
per
|
atmospheric particle numbers in the central Arctic (Bigg et al., 1996, 2001; Leck and Persson, 1996). Unfortunately, no information about the size of the emitted particles is available from our direct flux measurements. Thus, it remains unclear if open leads are a significant source of aerosol mass to the Arctic boundary layer. Moreover, we only begin to understand what happens to the emitted particles in the atmosphere. It has
5
been put forward that aerosol particles emitted from open leads in the Arctic are en-riched in organic compounds from the marine surface microlayer (e.g. Leck and Bigg, 2005; Bigg and Leck, 2008; Matrai et al., 2008). These gel-like substances found in the aerosol were postulated to have properties consistent with algal and bacterial exopoly-mer secretions or marine microgels (Decho, 1990). According to Verdugo et al. (2004),
10
the marine microgels span the whole size spectrum from colloidal-size nanogels con-taining single macromolecules entangled to form single-chain networks to micrometer-size gels (loose matrix associated with the aggregates or granular structures) that can aggregate to tight capsules reaching several 100 µm in diameter. The assembly and dispersion of macromolecules can be affected by environmental parameters, such as
15
UV-B radiation (280–320 nm) dispersing or inhibiting microgel formation, and/or pH and temperature inducing microgel volume phase changes (Orellana and Verdugo, 2003; Chin et al., 1998). Thus, one can speculate that degradation and break-up is a po-tential atmospheric fate of the open lead-derived aerosol. As suggested by Leck and Bigg (2010) this can lead to a large number of smaller daughter particles derived from
20
a small number of large parent particles emitted from the open lead.
Finally, the melting of sea ice in a changing climate will further increase the fraction of open leads in the Arctic pack ice, and potentially increase the relevance of the open lead particle source. It is very likely that these particles will then play a role as cloud condensation nuclei, and thus provide a direct feedback to the regional Arctic climate.
25
Re-ACPD
10, 24961–24992, 2010On the potential contribution of open
lead particle emissions
A. Held et al.
Title Page
Abstract Introduction
Conclusions References
Tables Figures
◭ ◮
◭ ◮
Back Close
Full Screen / Esc
Printer-friendly Version Interactive Discussion
Discussion
P
a
per
|
Dis
cussion
P
a
per
|
Discussion
P
a
per
|
Discussio
n
P
a
per
|
search at Stockholm University. ASCOS was made possible by funding from the Knut and Alice Wallenberg Foundation, the Swedish Research Council and the DAMOCLES European Union 6th Framework Integrated Research Project. The Swedish Polar Research Secretariat (SPRS) provided access to the icebreakerOdenand logistical support. We are grateful to the Swedish Polar Research Secretariat logistics staffand to Oden’s captain Mattias Peterson and his crew.
5
ASCOS is an IPY project under the AICI-IPY umbrella and is an endorsed SOLAS project.
References
Andreas, E. L., Persson, P. O. G., Grachev, A. A., Jordan, R. E., Horst, T. W., Guest, P. S., and Fairall, C. W.: Parameterizing turbulent exchange over sea ice in winter, J. Hydrometeorol., 11, 87–104, 2010.
10
Bergin, M. H., Jaffrezo, J.-L., Davidson, C. I., Dibb, J. E., Pandis, S. N., Hillamo, R., Maenhaut, W., Kuhns, H. D., and Makela, T.: The contributions of snow, fog, and dry deposition to the summer flux of anions and cations at Summit, Greenland, J. Geophys. Res., 100, 16275– 16288, 1995.
Bigg, E. K.: Ice forming nuclei in the high Arctic, Tellus, 48B, 322–328, 1996.
15
Bigg, E. K. and Leck, C.: Cloud-active particles over the central Arctic Ocean, J. Geophys. Res., 106, 32155–32166, 2001.
Bigg, E. K. and Leck, C.: The composition of fragments of bubbles bursting at the ocean surface, J. Geophys. Res., 113, D11209, doi:10.1029/2007JD009078, 2008.
Bigg, E. K., Leck, C., and Nilsson, E. D.: Sudden changes in arctic atmospheric aerosol
con-20
centrations during summer and autumn, Tellus, 48B, 254–271, 1996.
Bigg, E. K., Leck, C., and Nilsson, E. D.: Sudden changes in aerosol and gas concentrations in the central Arctic marine boundary layer – causes and consequences, J. Geophys. Res., 106, 32167–32185, 2001.
Bigg,, E. K, Leck, C., and Tranvik, L.: Particulates of the surface microlayer of open water in the
25
central Arctic Ocean in summer, Marine Chem., 91, 131–141, 2004.
Chin, W.-C, Orellana, M. V., and Verdugo, P.: Spontaneous assembly of marine dissolved organic matter into polymer gels, Nature, 39, 568–572, 1998.
Carrio, G. G., Jiang, H., and Cotton, W. R.: Impact of aerosol intrusions on Arctic boundary layer clouds. Part I: 4 May 1998 case, J. Atmos. Sci., 62, 3082–3093, 2005.
ACPD
10, 24961–24992, 2010On the potential contribution of open
lead particle emissions
A. Held et al.
Title Page
Abstract Introduction
Conclusions References
Tables Figures
◭ ◮
◭ ◮
Back Close
Full Screen / Esc
Printer-friendly Version Interactive Discussion
Discussion
P
a
per
|
Dis
cussion
P
a
per
|
Discussion
P
a
per
|
Discussio
n
P
a
per
|
Decho, A. W.: Microbial exopolymer secretions in ocean environments: their role(s) in food webs and marine processes, Oceanogr. Mar. Biol. Ann. Rev., 28, 73–153, 1990.
Duan, B., Fairall, C. W., Thomson, D. W.: Eddy correlation measurements of the dry deposition of particles in wintertime, J. Appl. Meteorol., 27, 642–652, 1988.
EMEP: Transboundary acification, eutrophication and ground level ozone in Europe, Part I:
5
Unified EMEP model description. Status Report 1/2003, 2003.
Fairall, C. W.: Interpretation of eddy-correlation measurements of particulate deposition and aerosol flux, Atmos. Environ., 18, 1329–1337, 1984.
Feingold, G., Cotton, W. R., Kreidenweis, S. M., and Davis, J. T.: The impact of giant cloud condensation nuclei on drizzle formation in stratocumulus: Implications for cloud radiative
10
properties, J. Atmos. Sci., 56, 4100–4117, 1999.
Foken, T. and Wichura, B.: Tools for quality assessment of surface-based flux measurements, Agr. Forest Meteorol., 78, 83–105, 1996.
Foken, T.: Micrometeorology. Springer, Berlin, 306 pp., 2008.
Giorgi, F.: Dry deposition velocities of atmospheric aerosols as inferred by applying a particle
15
dry deposition parameterization to a general circulation model, Tellus, 40B, 23–41, 1988. Grammatika, M. and Zimmerman, W. B.: Microhydrodynamics of flotation processes in the sea
surface layer, Dynam. Atmos. Oceans, 34, 327–348, 2001.
Gr ¨onlund, A., Nilsson, D., Koponen, I. K., Virkkula, A., and Hansson, M.: Aerosol dry depo-sition measured with eddy-covariance technique at Wasa and Aboa, Dronning Maud Land,
20
Antarctica, Ann. Glaciol., 35A, 355–361, 2002.
Heintzenberg, J. and Leck, C.: Seasonal variation of the atmospheric aerosol near the top of the marine boundary layer over Spitzbergen related to the Arctic sulphur cycle, Tellus, 46B, 52–67, 1994.
Held, A., Nowak, A., Wiedensohler, A., and Klemm, O.: Field measurements and size-resolved
25
model simulations of turbulent particle transport to a forest canopy, J. Aerosol Sci., 37, 786– 798, 2006.
Horst, T. W.: A simple formula for attenuation of eddy fluxes measured with first-order-response scalar sensors, Bound. Lay. Meteorol., 82, 219–233, 1997.
Ibrahim, M., Barrie, L. A., and Fanaki, F.: An experimental and theoretical investigation of the
30
dry deposition of particles to snow, pine trees and artificial collectors, Atmos. Environ., 17, 781–788, 1983.
ACPD
10, 24961–24992, 2010On the potential contribution of open
lead particle emissions
A. Held et al.
Title Page
Abstract Introduction
Conclusions References
Tables Figures
◭ ◮
◭ ◮
Back Close
Full Screen / Esc
Printer-friendly Version Interactive Discussion
Discussion
P
a
per
|
Dis
cussion
P
a
per
|
Discussion
P
a
per
|
Discussio
n
P
a
per
|
Moritz, R. E.: An annual cycle of Arctic surface cloud forcing at SHEBA, J. Geophys. Res., 107, 8039, doi:10.1029/2000JC000439, 2002.
Johnson, B. D. and Wangersky, P. J.: Microbubbles: Stabilization by monolayers of adsorbed particles, J. Geophys. Res., 92, 14641–14647, 1987.
Karlsson, J. and Svensson, G.: The simulation of Arctic clouds and their influence on the
5
winter surface temperature in present-day climate in the CMIP3 multi-model dataset, Clim. Dyn., doi:10.1007/s00382-010-0758-6, in press, 2010.
Leck, C. and Persson, C.: Seasonal and short-term variability in dimethyl sulfide, sulfur dioxide and biogenic sulfur and sea salt aerosol particles in the arctic marine boundary layer, during summer and autumn, Tellus, 48B, 272–299, 1996.
10
Leck, C. and Bigg, E. K.: Aerosol production over remote marine areas - a new route, Geophys. Res. Lett., 26, 3577–3580, 1999.
Leck, C., Norman, M., Bigg, E. K., and Hillamo, R.: Chemical composition and sources of the high Arctic aerosol relevant for cloud formation, J. Geophys. Res., 107(D12), 4135, doi:10.1029/2001JD001463, 2002.
15
Leck, C., Tjernstr ¨om, M., Matrai, P., Swietlicki, E., and Bigg, K.: Can marine micro-organisms influence melting of the Arctic pack ice? Eos Trans., 85, 25–36, 2004.
Leck, C. and Bigg, E. K.: Biogenic particles in the surface microlayer and overlaying atmo-sphere in the central Arctic Ocean during summer, Tellus, 57B, 305–316, 2005a.
Leck, C. and Bigg, E. K.: Evolution of the marine aerosol – A new perspective, Geophys., Res.,
20
Lett., 32, L19803, doi:10.1029/2005GL023651, 2005b.
Leck, C. and Bigg, E. K.: New particle formation of marine biological origin, Aerosol Sci. Tech-nol., 44, 570–577, 2010.
Lenton, T. M., Held, H., Kriegler, E., Hall, J. W., Lucht, W., Rahmstorf, S., and Schellnhuber, H. J.: Tipping elements in the Earth’s climate system, PNAS, Online Early Edition, http:
25
//dx.doi.org/10.1073/pnas.0705414105, 2008.
Lohmann, U. and Leck, C.: Importance of submicron surface-active organic aerosols for pristine Arctic clouds, Tellus, 57B, 261–268, 2005.
Matrai, P. A., Tranvik, L., Leck, C., and Knulst, J. C.: Are high Arctic surface microlayer a potential source of aerosol organic precursors? Marine Chem., 108, 109–122, 2008.
30
ACPD
10, 24961–24992, 2010On the potential contribution of open
lead particle emissions
A. Held et al.
Title Page
Abstract Introduction
Conclusions References
Tables Figures
◭ ◮
◭ ◮
Back Close
Full Screen / Esc
Printer-friendly Version Interactive Discussion
Discussion
P
a
per
|
Dis
cussion
P
a
per
|
Discussion
P
a
per
|
Discussio
n
P
a
per
|
Nilsson, E. D. and Rannik, ¨U.: Turbulent aerosol fluxes over the Arctic Ocean: 1. Dry deposition over sea and pack ice, J. Geophys. Res., 106, 32125–32137, 2001.
Norris, S. J., Brooks, I. M., de Leeuw, G., Sirevaag, A., Leck, C., Brooks, B. J., Birch, C. E., and Tjernstrom, M.: Measurements of bubble size spectra within leads in the Arctic summer pack ice, Ocean Sci. Discuss., 7, 1739–1765, doi:10.5194/osd-7-1739-2010, 2010.
5
Orellana, M. V. and Verdugo, P.: Ultraviolet radiation blocks the organic carbon exchange be-tween the dissolved phase and the gel phase in the ocean, Limnol. Oceanogr., 48, 1618– 1623, 2003.
Persson, P. O. G., Fairall, C. W., Andreas, E. L., Guest, P. S., and Perovich, D. K.: Mea-surements near the Atmospheric Surface Flux Group tower at SHEBA: Near-surface
condi-10
tions and surface energy budget, J. Geophys. Res., 107, 8045, doi:10.1029/2000JC000705, 2002.
Prenni, A. J., Harrington, J. Y., Tjernstr ¨om, M., DeMott, P. J., Avramov, A., Long, C. N., Krei-denweis, S. M., Olsson, P. Q., and Verlinde, J.: Can ice-nucleating aerosols affect Arctic seasonal climate?, B. Am. Meteorol. Soc., 88, 541–550, 2007.
15
Rasmussen, R. M., Geresdi, I., Thompson, G., Manning, K., and Karplus, E.: Freezing drizzle formation in stably stratified layer clouds: The role of radiative cooling of cloud droplets, cloud condensation nuclei, and ice initiation, J. Atmos. Sci., 59, 837–860, 2002.
Schack, C. J., Pratsinis, S. E., and Friedlander, S. K.: A general correlation for deposition of suspended particles from turbulent gases to completely rough surfaces, Atmos. Environ., 19,
20
953–960, 1985.
Thomas, C. and Foken, T.: Re-evaluation of integral turbulence characteristics and their param-eterisations. In: Proceedings of the 15th Conference on Turbulence and Boundary Layers, Wageningen, NL, 15–19 July 2002, American Meteorological Society, 129–132, 2002. Tjernstr ¨om, M.: The summer Arctic boundary layer during the Arctic Ocean Experiment 2001
25
(AOE-2001), Bound. Lay. Meteorol., 117, 5–36, 2005.
Tjernstr ¨om, M., Sedlar, J., and Shupe, M.: How well do regional climate models reproduce radiation and clouds in the Arctic? An evaluation of ARCMIP simulations, J. Appl. Meteorol. Clim., 47, 2405–2422, 2008.
Twomey, S.: Pollution and the planetary albedo, Atmos. Environ., 8, 1251–1265, 1974.
30
Uttal, T., Curry, J. A., McPhee, M. G., et al.: Surface Heat Budget of the Arctic Ocean, B. Am. Meteorol. Soc., 83, 255–276, 2002.
ACPD
10, 24961–24992, 2010On the potential contribution of open
lead particle emissions
A. Held et al.
Title Page
Abstract Introduction
Conclusions References
Tables Figures
◭ ◮
◭ ◮
Back Close
Full Screen / Esc
Printer-friendly Version Interactive Discussion
Discussion
P
a
per
|
Dis
cussion
P
a
per
|
Discussion
P
a
per
|
Discussio
n
P
a
per
|
oceanic gel phase: a bridge in the DOM-POM continuum, Marine Chem., 92, 67–85, 2004. Walsh, J. E., Kattsov, W. M., Chapman, W. L., Govorkova, V., and Pavlova, T.: Comparison of
Arctic climate by uncoupled and coupled global models, J. Climate, 15, 1429–1446, 2002. Wells, M. L. and Goldberg, E. D.: Occurrence of small colloids in sea water, Nature, 353,
342–344, 1991.
5
Wilczak, J. M., Oncley, S. P., and Stage, S. A.: Sonic anemometer tilt correction algorithms, Bound. Lay. Meteorol., 99, 127–150, 2001.
ACPD
10, 24961–24992, 2010On the potential contribution of open
lead particle emissions
A. Held et al.
Title Page
Abstract Introduction
Conclusions References
Tables Figures
◭ ◮
◭ ◮
Back Close
Full Screen / Esc
Printer-friendly Version Interactive Discussion
Discussion
P
a
per
|
Dis
cussion
P
a
per
|
Discussion
P
a
per
|
Discussio
n
P
a
per
|
Table 1. Median values of wind speed, particle number concentration, friction velocity u∗, roughness lengthz0, and transfer velocities vt, respectively, for six wind sectors with different surface characteristics (L: lead, IR: ice ridge, I: ice floe). Ndep is the number of deposition dominated 30 min periods in each sector,Nemof emission dominated periods.
sector from to Ndep Nem wind speed particle conc u∗ z0 vt(dep) surface
◦ ◦ – – m s−1
cm−3
m s−1
m mm s−1
A 15 70 15 24 1.35 138 0.09 2.2E-03 0.41 L/IR
B 70 110 30 27 3.32 50 0.23 6.6E-03 0.51 IR
C 110 190 56 14 3.82 38 0.17 4.0E-04 0.68 I
D 190 230 31 16 3.53 43 0.11 1.7E-05 0.44 I
E 230 305 27 27 2.22 12 0.12 1.9E-03 0.56 IR/ I /L
ACPD
10, 24961–24992, 2010On the potential contribution of open
lead particle emissions
A. Held et al.
Title Page
Abstract Introduction
Conclusions References
Tables Figures
◭ ◮
◭ ◮
Back Close
Full Screen / Esc
Printer-friendly Version Interactive Discussion
Discussion
P
a
per
|
Dis
cussion
P
a
per
|
Discussion
P
a
per
|
Discussio
n
P
a
per
|
Table 2. Percentiles of changes in particle number concentration per hour as expected from measured aerosol number flux (expected), and as observed from direct particle number mea-surements (observed).
expected observed
percentile emission deposition total emission deposition total % [cm−3h−1] [cm−3h−1] [cm−3h−1] [cm−3h−1] [cm−3h−1] [cm−3h−1]
5 0.1 −3.7 −2.8 0.4 −35.2 −24.5
10 0.1 −2.5 −2.0 0.7 −24.1 −16.7
50 0.6 −0.8 −0.2 6.6 −5.3 −0.3
90 2.5 −0.1 1.3 24.2 −0.6 15.5
ACPD
10, 24961–24992, 2010On the potential contribution of open
lead particle emissions
A. Held et al.
Title Page
Abstract Introduction
Conclusions References
Tables Figures
◭ ◮
◭ ◮
Back Close
Full Screen / Esc
Printer-friendly Version Interactive Discussion
Discussion
P
a
per
|
Dis
cussion
P
a
per
|
Discussion
P
a
per
|
Discussio
n
P
a
per
|
1
Fig. 1. Normalized ogive functions of vertical wind vs. sonic temperature (w′T′, blue) and
vertical wind vs. aerosol number concentration (w′c′, red). (a)Median ogives from 19 August,
ACPD
10, 24961–24992, 2010On the potential contribution of open
lead particle emissions
A. Held et al.
Title Page
Abstract Introduction
Conclusions References
Tables Figures
◭ ◮
◭ ◮
Back Close
Full Screen / Esc
Printer-friendly Version Interactive Discussion
Discussion
P
a
per
|
Dis
cussion
P
a
per
|
Discussion
P
a
per
|
Discussio
n
P
a
per
|
1
Fig. 4. (a) Median aerosol number fluxes in 10◦ wind direction bins. (b) Time fraction of
emission episodes averaged over 30◦wind bins and plotted every 10◦. Grey shading indicates
ACPD
10, 24961–24992, 2010On the potential contribution of open
lead particle emissions
A. Held et al.
Title Page
Abstract Introduction
Conclusions References
Tables Figures
◭ ◮
◭ ◮
Back Close
Full Screen / Esc
Printer-friendly Version Interactive Discussion
Discussion
P
a
per
|
Dis
cussion
P
a
per
|
Discussion
P
a
per
|
Discussio
n
P
a
per
|
1