HESSD
6, 4411–4448, 2009Hillslope hydrology under glass at
Biosphere 2
L. Hopp et al.
Title Page
Abstract Introduction
Conclusions References
Tables Figures
◭ ◮
◭ ◮
Back Close
Full Screen / Esc
Printer-friendly Version
Interactive Discussion Hydrol. Earth Syst. Sci. Discuss., 6, 4411–4448, 2009
www.hydrol-earth-syst-sci-discuss.net/6/4411/2009/ © Author(s) 2009. This work is distributed under the Creative Commons Attribution 3.0 License.
Hydrology and Earth System Sciences Discussions
Papers published inHydrology and Earth System Sciences Discussionsare under open-access review for the journalHydrology and Earth System Sciences
Hillslope hydrology under glass:
confronting fundamental questions of
soil-water-biota co-evolution at
Biosphere 2
L. Hopp1, C. Harman2, S. Desilets3, C. Graham4, J. McDonnell1, and P. Troch3
1
Department of Forest Engineering, Resources and Management, Oregon State University, Corvallis, USA
2
Department of Geography, University of Illinois at Urbana-Champaign, USA
3
Department of Hydrology and Water Resources, The University of Arizona, Tucson, USA
4
Department of Crop and Soil Sciences, The Pennsylvania State University, University Park, USA
Received: 20 May 2009 – Accepted: 3 June 2009 – Published: 18 June 2009
Correspondence to: L. Hopp (luisa.hopp@oregonstate.edu)
HESSD
6, 4411–4448, 2009Hillslope hydrology under glass at
Biosphere 2
L. Hopp et al.
Title Page
Abstract Introduction
Conclusions References
Tables Figures
◭ ◮
◭ ◮
Back Close
Full Screen / Esc
Printer-friendly Version
Interactive Discussion
Abstract
Recent studies have called for a new unifying hydrological theory at the hillslope and watershed scale, emphasizing the importance of coupled process understanding of the interactions between hydrology, ecology, pedology, geochemistry and geomorphol-ogy. The Biosphere 2 Hillslope Experiment aims at exploring how climate, soil and 5
vegetation interact and drive the evolution of the hydrologic hillslope behavior using a set of three large-scale hillslopes (18 m by 33 m each) that will be built in the climate-controlled experimental biome of the Biosphere 2 facility near Tucson, Arizona, USA. By minimizing the initial physical complexity of these hillslopes, the spontaneous for-mation of flow pathways, soil spatial heterogeneity, surface morphology and vegetation 10
patterns can be observed over time. This paper documents the hydrologic design pro-cess for the Biosphere 2 Hillslope Experiment, which was based on design principles agreed upon among the Biosphere 2 science community. Main design principles were that the hillslopes should promote spatiotemporal variability of hydrological states and fluxes, facilitate transient lateral subsurface flow without inducing overland flow and be 15
capable of supporting vegetation. Hydrologic modeling was used to identify a hills-lope configuration (geometry, soil texture, soil depth) that meets the design objectives. The recommended design for the hillslopes consists of a zero-order basin shape with a 10 degree overall slope, a uniform soil depth of 1 m and a loamy sand soil texture. The sensitivity of the hydrologic response of this design to different semi-arid climate 20
scenarios was subsequently tested. Modeling results show that the timing of rainfall in relation to the timing of radiation input controls the spatiotemporal variability of mois-ture within the hillslope and the generation of lateral subsurface flow. The Biosphere 2 Hillslope Experiment will provide an excellent opportunity to test hypotheses, observe emergent patterns and advance the understanding of interactions.
HESSD
6, 4411–4448, 2009Hillslope hydrology under glass at
Biosphere 2
L. Hopp et al.
Title Page
Abstract Introduction
Conclusions References
Tables Figures
◭ ◮
◭ ◮
Back Close
Full Screen / Esc
Printer-friendly Version
Interactive Discussion
1 Introduction
In a number of recent papers addressing future directions in hydrology and related disciplines a common theme has emerged: that the spatial variability and temporal dynamics of the physical and biological processes controlling water movement in the landscape present a fundamental challenge to our ability to improve hydrologic predic-5
tion, particularly under changing climates and land uses (Sivapalan, 2005; McDonnell et al., 2007; Lin et al., 2006; Wagener et al., 2007; Tetzlaff et al., 2008; Soulsby et al., 2008; Dunn et al., 2008; Troch et al., 2009). There is recognition that observations of these processes represent only the current state of the continuing co-evolution of the hydrologic systems with the biota, soils, geomorphology and micro-climates that 10
make up the critical zone (Brantley et al., 2007). This co-evolution creates patterns of interdependency and connections between processes that may form the basis of new hydrologic theories that transcend the uniqueness of each catchment (Kumar, 2007). Therefore there is a direct tie between gaining a deeper understanding of the process interactions that occur in the landscape (and the patterns that emerge as a result of 15
this interaction) and improving hydrologic prediction (Sivapalan, 2005). Field exper-iments to understand how and why hydrologic co-evolution occurs are fundamentally limited by unknown, and with today’s instrumentation, unknowable boundary conditions (McDonnell et al., 2007). In such open environmental systems, traditional field “exper-imentation” is limited largely to sampling for patterns of hydrological states and fluxes 20
and sampling for model parameters (Eberhardt and Thomas, 1991). So how can we address our most fundamental research challenge of co-evolution in the short term, before the development of techniques that will allow us to illuminate our subsurface boundary conditions in the field? Controlled laboratory (indoor and outdoor) experi-ments may be an important way forward. There are a few examples of large-scale 25
HESSD
6, 4411–4448, 2009Hillslope hydrology under glass at
Biosphere 2
L. Hopp et al.
Title Page
Abstract Introduction
Conclusions References
Tables Figures
◭ ◮
◭ ◮
Back Close
Full Screen / Esc
Printer-friendly Version
Interactive Discussion the Artificial Catchment “Chicken Creek” in Germany (Gerwin et al., 2009). In hillslope
hydrology, controlled experiments have in the past yielded extraordinary new insights into hydrological processes: Hewlett and Hibbert’s (1963) concrete-lined hillslope ex-periment at the Coweeta Hydrologic Laboratory, North Carolina, USA, that exposed the role of soils for baseflow generation; the covered-roof experiments at G ˚ardsj ¨on, Swe-5
den, that illustrated chemical transformations in the subsurface with acid deposition (see Bishop and Hultberg, 1995, and many others); Kendall et al.’s (2001) Hydrohill, China, experiment that defined hillslope-scale flowpaths and mixing. While such ex-periments and many others have provided new insights into how and where processes operate with known boundary conditions, none have yet tackled why such processes 10
occur from an evolutionary standpoint. Such experiments would require a degree of control of climate, soil, and topography that has until now been unimaginable.
Here we report on plans for constructing and instrumenting three experimental hill-slopes at Biosphere 2 near Tucson, Arizona, USA, in order to observe the coupling of geochemical, biological and physical processes, and the resulting co-evolution of the 15
hillslope structure and properties through time. Biosphere 2 is a large-scale earth sci-ence facility under the management of The University of Arizona (www.b2scisci-ence.org). The facility presents a unique opportunity to conduct large-scale physical experiments of landscape processes in a tightly controlled environment (Huxman et al., 2009). The hillslopes will be housed in three 33 m×18 m bays which will allow for controlling the 20
atmospheric conditions and the monitoring of fluxes of water, solutes, sediment and gases with a precision that is not possible in the field, and at a scale that is infeasible in the typical lab setting. The hillslopes will be allowed to evolve over an anticipated lifespan of 10 years. The physical experiments will be complemented with efforts to develop a coupled process model that can be used to more deeply understand the 25
HESSD
6, 4411–4448, 2009Hillslope hydrology under glass at
Biosphere 2
L. Hopp et al.
Title Page
Abstract Introduction
Conclusions References
Tables Figures
◭ ◮
◭ ◮
Back Close
Full Screen / Esc
Printer-friendly Version
Interactive Discussion complex hillslope system behavior? What controls subsurface flow network evolution?
When does the heterogeneity introduced by the vegetation and weathering processes disable our ability to predict the water and energy balances? This amounts to a mech-anistic assessment of the water balance unlike any work to date.
So how does one begin to design such a grand experiment? The spatial and tempo-5
ral design of the Biosphere 2 hillslope experiment represents a novel challenge, as the initial structure of the hillslopes and the climatic forcing must be chosen such that the individual and collective objectives of the scientific community are met. We are specifi-cally pursuing an interdisciplinary approach to experimental design through cultivating a collaborative group that brings together scientists from diverse disciplines such as 10
hydrology, geomorphology, soil geochemistry, atmospheric science, ecology, and ge-nomics. We follow the Platt (1964) approach to strong inference, where he, and others since then, have noted that certain systematic methods of scientific thinking may pro-duce much more rapid progress than others. The Biosphere 2 experiments represent vast informational detail and complexity, where much time could be wasted on “low-15
information” observations or experiments if one does not think carefully in advance about what the most important and conclusive experiments would be for advancement of the field. Our philosophy has been to have a group of leading researchers in the different sub-fields debate every experiment ahead of time.
The goal of this paper is to outline the hydrologic design of the Biosphere 2 hills-20
lope experiment and to report on some of the challenges and opportunities it creates for hydrologic research. The design has been developed through discussions at a se-ries of planning workshops at Biosphere 2, informed by hydrologic modeling efforts by the authors. It should be noted that the design presented here is only a prelimi-nary recommendation from hydrologists in the Biosphere 2 scientific community, and 25
HESSD
6, 4411–4448, 2009Hillslope hydrology under glass at
Biosphere 2
L. Hopp et al.
Title Page
Abstract Introduction
Conclusions References
Tables Figures
◭ ◮
◭ ◮
Back Close
Full Screen / Esc
Printer-friendly Version
Interactive Discussion be tested against future observations. Specifically, our paper focuses on the following
questions:
1. What are the key considerations and constraints that need to be incorporated into the design from a hydrologic perspective?
2. How can modeling methodologies and results be used to guide the design pro-5
cess and develop a base hillslope design?
3. What is the effect of different climate regimes (as possible treatments in the overall experiment) on the simulated base hillslope design?
2 Biosphere 2 hillslope design
2.1 Design criteria
10
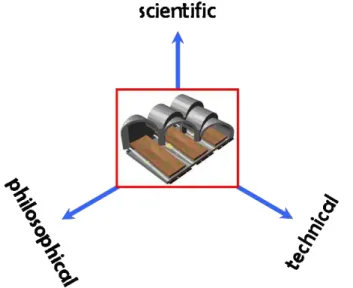
Our design of the Biosphere 2 hillslope incorporated nine principal criteria to ensure that the hillslopes would be capable of answering the key scientific questions posed by the community of scientists. These criteria fall into three categories: (A) philosophical, (B) scientific, and (C) practical (Fig. 1) and arose out of the discussions at the planning workshops.
15
A1. Minimize the imposed structure, and maximize the emergent structure.
Ob-serving the spontaneous emergence of structure within the hillslope is central to the scientific objectives of the Biosphere 2 project (Huxman et al., 2009). Therefore it is important to minimize the structure imposed on the hillslope by the initial conditions, for example through the spatial structure of the soils. This would not be possible if the 20
HESSD
6, 4411–4448, 2009Hillslope hydrology under glass at
Biosphere 2
L. Hopp et al.
Title Page
Abstract Introduction
Conclusions References
Tables Figures
◭ ◮
◭ ◮
Back Close
Full Screen / Esc
Printer-friendly Version
Interactive Discussion some structure on the system in order to create a hillslope that allows for some of the
complex hydrological processes observed in the field.
A2. Simplicity and effectiveness. The Biosphere 2 experiments offer the chance to tackle questions related to process coupling in a way that has not been possible previously, but with this breadth of opportunity come the pitfalls of trying to do too much. 5
There are cost and resource limitations on what can be achieved. It is not possible to simultaneously span multiple treatment dimensions (e.g. climate, soil type, vegetation type), and use the three bays for independent replicates. Nor is it possible to “reset” the hillslopes once the experiments have begun, except at significant cost. Therefore the hillslope experiment design must be simple (incorporating as few processes as is 10
required to make the hillslope a useful model of natural complexity, and no fewer) and effective (be able to answer a large suite of questions and generate an interesting data set).
B1. Relevance of the results to the semi-arid setting of the Biosphere 2 facility. The facility is located in the Sonoran Desert, an area which has a mean annual rainfall of 15
330 mm and a mean annual potential evapotranspiration of 1600 mm. The average minimum and maximum temperatures are 6◦C and 18◦C for January and 25◦C and 38◦C for July. While it is technically possible to simulate a wide variety of climates inside the Biosphere 2 dome, there are several reasons for choosing similar semi-arid climates. About 38% of the world’s population live in semi-arid areas covering 41% of 20
the earth’s terrestrial surface (MEA, 2005). These areas are expected to be significantly affected by climate change, making research in these landscapes a priority (Reynolds et al., 2007). It is also more cost efficient to simulate a climate that is not too different from the outside.
B2. Spatially variable moisture regimes, including convergence. The convergence 25
HESSD
6, 4411–4448, 2009Hillslope hydrology under glass at
Biosphere 2
L. Hopp et al.
Title Page
Abstract Introduction
Conclusions References
Tables Figures
◭ ◮
◭ ◮
Back Close
Full Screen / Esc
Printer-friendly Version
Interactive Discussion hillslope. The chosen hillslope geometry should provide an opportunity to examine
how lateral connectivity and convergence produce modes of spatial variability in soil moisture regimes, and the consequences of this variability on the hillslope evolution.
B3. Lateral connectivity of processes through transient subsurface flow. One of the unique opportunities of doing experimental hydrology at this scale is the ability to ex-5
amine the role that lateral hydraulic connectivity across the hillslope plays in controlling the diversity and structure of physical, geochemical and biological processes. The sat-urated lateral flow that occurs in many hillslopes underlain by low-permeability layers has been the subject of a number of theoretical, modeling and experimental studies in recent years (e.g. Woods and Rowe, 1996; Tani, 1997; Buttle and McDonald, 2002; 10
Troch et al., 2003; Tromp-van Meerveld and McDonnell, 2006a, b; Kampf and Burges, 2007; Fiori and Russo, 2007) because of its importance in runoffgeneration and con-trolling the export of leached mineral and nutrient species (e.g. van Verseveld et al., 2008; McHale et al., 2002). The hillslope was designed to facilitate the occurrence of this process. Although lateral subsurface flow as a runoffprocess is considered to 15
be more important in humid areas, it does occur in semi-arid areas (Lyon et al., 2008; Newman et al., 1998; McNamara et al., 2005).
B4. Ensuring sufficient water availability in the root zone. A key component of the scientific research planned for the hillslopes is concerned with the dynamics of grasses and shrubs that will be planted, most likely in several stages over the course of the 20
experiment. Highly conductive soils like sands and gravels tend to have low water retention capacities, which could lead to desiccation of the vegetation during the dry season. Thus, in designing the hillslope there is a need to find a balance between avoiding overland flow (see C1) and maintaining sufficient water retention capacity.
B5. Temporal dynamics and response to climatic variation.Similar to spatial variabil-25
HESSD
6, 4411–4448, 2009Hillslope hydrology under glass at
Biosphere 2
L. Hopp et al.
Title Page
Abstract Introduction
Conclusions References
Tables Figures
◭ ◮
◭ ◮
Back Close
Full Screen / Esc
Printer-friendly Version
Interactive Discussion of phenomena, it is crucial that the temporal variability of a realistic semi-arid
precip-itation and radiative forcing regime is preserved in the Biosphere 2. The experiment is also an opportunity to more deeply understand how the temporal variability of the climate and its control on water availability and atmospheric water demand influences vegetation dynamics in semiarid areas.
5
C1. Avoiding significant erosional overland flow. Surface erosion is an example of a hot spot/hot moment that could have a potentially catastrophic effect on the experi-ment. While the evolution of the microtopography of the hillslopes will be one focus of research, the hillslopes must be designed to avoid large-scale gullying or mass wast-ing. In the experiment mass wasting could occur if slopes are too steep. Overland 10
flow could initiate gullying if soils become saturated to the surface, or if precipitation rates exceed infiltration rates. Both of these can be avoided for a given set of infiltration inputs to the soil by the selection of a soil with sufficiently high saturated hydraulic con-ductivity. Even so, it is expected that rain-splash and localized overland flow will cause some movement of surface sediments, generating surface microtopography.
15
C2. Technical feasibility. In addition to the considerations discussed above, there are constraints on the hillslope configurations imposed by the technical feasibility of constructing hillslope structures at this scale within the Biosphere 2. In many cases these constraints were identified during the design process through consultation with engineers and contractors.
20
Designing a hillslope that satisfies all of these considerations is complicated by the very knowledge-gaps that the hillslope experiment is aimed at addressing. Once the hillslopes are constructed, it is difficult to predict how they will evolve due to the net-work of process connections. Vegetation will alter the soil moisture dynamics, the soil structure and the soil composition through root growth, leaf and root litter, and root 25
HESSD
6, 4411–4448, 2009Hillslope hydrology under glass at
Biosphere 2
L. Hopp et al.
Title Page
Abstract Introduction
Conclusions References
Tables Figures
◭ ◮
◭ ◮
Back Close
Full Screen / Esc
Printer-friendly Version
Interactive Discussion distribution by mineral precipitation and dissolution, soil aggregation and macropore
formation). The formation of microtopography and surface sorting of soil particles may lead to spatially variable patterns of infiltration, which feed back into the patterns of surface soil movement. Because of these uncertainties, in this paper we will restrict our discussion to the modeling that was done to design the initial configuration of the 5
hillslope, which will consist of a uniform soil material and no vegetation. For a more detailed analysis of the interplay between hydrology and geochemistry and vegetation, respectively, readers are referred to the companion papers by Dontsova et al. (2009) and Ivanov et al. (2009).
It was suggested in an early stage in the workshops that the basic design should 10
consist of three hillslopes with identical geometry and soils. They could be subjected to various climates, and be seeded with various vegetation types, with subsequent vegetation evolution through time (Huxman et al., 2009). Assuming these parameters were fixed, the key decisions to be made from a hydrologic perspective concerned the following parameters: 1) hillslope surface topography, 2) subsurface topography, 3) 15
permeability of the base, 4) overall slope, 5) soil depth, and 6) soil texture (i.e. hydraulic properties of the soil).
These parameters must be chosen before construction of the hillslopes can begin. Values of these parameters for a proposed design were based on the design consid-erations listed above and informed by hydrologic modeling. They are discussed in the 20
next section. Selection of the precise climate properties (precipitation, temperature, wind-speed, humidity, radiation etc) is not immediately necessary and can be deferred. However, since the performance of the hillslopes depends on the climate that is applied to it, representative climates were used in the design process. The sensitivity of the recommended design to climate was assessed in this study (see Sect. 4), and explored 25
HESSD
6, 4411–4448, 2009Hillslope hydrology under glass at
Biosphere 2
L. Hopp et al.
Title Page
Abstract Introduction
Conclusions References
Tables Figures
◭ ◮
◭ ◮
Back Close
Full Screen / Esc
Printer-friendly Version
Interactive Discussion
2.2 Modeling approach
A number of basic decisions were made prior to the bulk of the modeling efforts. A zero-order basin geometry was identified as providing a realistic landscape form that would promote transient saturated lateral subsurface flow (B3) and spatial and tem-poral variability of soil moisture and water table development (B2, B5), as compared 5
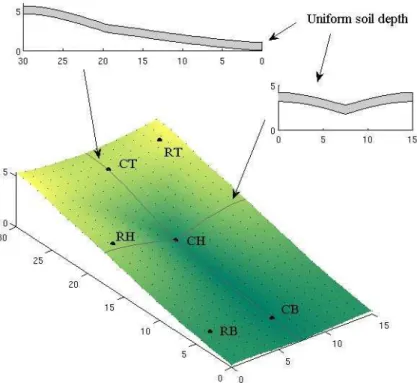
to a simpler planar hillslope with uniform slope. This represents a degree of structure imposed on the system, rather than arising spontaneously (A1), but was regarded as essential to meeting the objectives. While soil depths are often highly variable at the hillslope scale (Freer et al., 2002), it was decided – in the interests of imposing as little initial structure as possible (A1) and for the sake of simplicity (A2) – that the soil depths 10
should be uniform throughout the domain, meaning that the base and surface topogra-phies be identical. The basic geometry used for going forward with the modeling work is shown in Fig. 2. Since bedrock permeability has been shown to be a first-order con-trol on hillslope hydrological processes (Tromp-van Meerveld and McDonnell, 2006b), introducing a permeable base was considered, and efforts were made to model the 15
effects of bedrock permeability on the hillslope flows. However, this component was abandoned for reasons of simplicity (A2) and technical feasibility (C2).
Hydrologic modeling was used in a two-stage approach to investigate the parameter space for the remaining parameters listed above: the overall slope, soil depth, and soil textures. First, a parsimonious modeling scheme was used that could be run rapidly 20
and sample a large region of the parameter space. Metrics were identified to determine regions of the parameter space that conformed to the design considerations. This constrained the parameter space that was subsequently explored in detail by a more complex model. For this design modeling a rainfall scenario representative of a semi-arid Sky Island forest (Brown-Mitic et al., 2007), a subset of the US western sub-alpine 25
HESSD
6, 4411–4448, 2009Hillslope hydrology under glass at
Biosphere 2
L. Hopp et al.
Title Page
Abstract Introduction
Conclusions References
Tables Figures
◭ ◮
◭ ◮
Back Close
Full Screen / Esc
Printer-friendly Version
Interactive Discussion which focused on the physical properties of the hillslopes that were needed to begin
the engineering design and construction.
2.2.1 Initial modeling
The initial modeling focused on identifying an overall slope angle and a soil texture and soil depth that would allow for lateral flow (B3), avoid overland flow (C1), and have 5
sufficient water holding capacity to sustain vegetation (B4). The mean slope was varied by linearly scaling the elevations of a base digital elevation model (DEM).
The initial modeling consisted of a 1-D model of infiltration through the unsaturated zone using an approximation of the Richards’ equation known as a Multiple Wetting Front model (Struthers et al., 2006). This model predicts fluxes through a free-draining 10
unsaturated zone of fixed depth. Evapotranspiration processes are modeled as a frac-tion of the (seasonally varying) potential rate, where the fracfrac-tion depends on the relative saturation of the entire unsaturated zone. Overland flow occurs if the precipitation rate exceeds the saturated hydraulic conductivity. The lower boundary output (recharge or leakage) of this unsaturated zone model was used as input to a simple 2-D model 15
of saturated flow through a hillslope domain based on the Boussinesq equation (Har-man and Sivapalan, 2009). This model predicts the build-up of the saturated zone, and the lateral flow over the bed and downslope towards the hillslope lower boundary. The lower boundary condition is kinematic (i.e. the water table gradient is parallel to the local bed slope), so the subsurface flow drains freely. In this modeling approach 20
the water table dynamics are decoupled from the unsaturated zone depth, so that the depth of the unsaturated zone is fixed, even when the water table has saturated a depth equivalent to the assumed unsaturated soil depth. For this reason the results should be interpreted with particular caution. The model does not simulate saturation excess overland flow and return flow (exfiltration).
25
HESSD
6, 4411–4448, 2009Hillslope hydrology under glass at
Biosphere 2
L. Hopp et al.
Title Page
Abstract Introduction
Conclusions References
Tables Figures
◭ ◮
◭ ◮
Back Close
Full Screen / Esc
Printer-friendly Version
Interactive Discussion
– Two scenarios of potential evapotranspiration: one at 500 mm a-1 and one at 1000 mm a-1, both varying seasonally according to a sinusoidal curve out of phase with the precipitation, with an amplitude of 250 mm a-1 and 500 mm a-1, respectively. Diurnal variations were not considered.
– Four unsaturated zone depths: 0.5 m, 1 m, 1.5 m and 2 m. 5
– Twelve soil texture classes: Van Genuchten (1980) soil hydraulic parameters were used for each of the standard USDA soil texture classes, obtained from class averages in the Rosetta database (Schaap et al., 2001).
Simulations were run initially with an overall slope of 6 degrees. In addition, the sen-sitivity to slope was examined for a subset of the parameter sets for overall slopes 10
ranging from 2 degrees to 16 degrees. Two metrics were used to interpret the results of the initial modeling. First, the ratioRwof total lateral subsurface flow to the total pre-cipitation over the 180 day simulated period gives an indication of the water balance (though it does not account for the partition between overland flow, evapotranspiration and storage remaining in the hillslope at the end of the modeled period). A very high 15
value of this metric (Rw>0.8) would suggest that the hillslope drains too quickly, and
does not store sufficient water for transpiration (C6). Low values (Rw<0.2) suggest that
either there is minimal subsurface flow (C5), or overland flow dominates (C8).
Second, the ratioRs of the peak saturated thickness and the assumed depth of the
unsaturated zone was calculated to examine the likelihood of overland flow. Because 20
the water-table feedback between saturated and unsaturated models is not accounted for in this parsimonious model approach, we cannot predict saturation to the surface di-rectly. However, if we take the assumed depth of the unsaturated zone as representing the whole soil depth, the region of the parameter space that produces a saturated thick-ness of similar or larger depth is likely to produce saturation excess overland flow in a 25
coupled model. Thus parameter sets that produce small values of this ratio (Rs<0.8)
HESSD
6, 4411–4448, 2009Hillslope hydrology under glass at
Biosphere 2
L. Hopp et al.
Title Page
Abstract Introduction
Conclusions References
Tables Figures
◭ ◮
◭ ◮
Back Close
Full Screen / Esc
Printer-friendly Version
Interactive Discussion
2.2.2 HYDRUS-3D modeling
Hydrus-3D, a three-dimensional finite element model that solves the Richards’ equa-tion for variably saturated flow (Simunek et al., 2006; Simunek et al., 2008), was subse-quently used to explore the effects of slope angle and soil depth on lateral subsurface flow and internal moisture distribution. As an initial base case, the zero-order basin 5
geometry with a 20 degree overall slope and 1.5 m soil depth was chosen. Using this base case, the slope angle was changed to 10 degrees and 30 degrees, respec-tively, and the soil depth was changed to 1 m and 2 m, respecrespec-tively, resulting in five different scenarios. Based on results of the initial modeling, a loamy sand soil texture was chosen. Soil hydraulic parameters for the van Genuchten-Mualem soil hydraulic 10
model (van Genuchten, 1980) were obtained from the Carsel and Parrish soil catalog (Carsel and Parrish, 1988) with a residual water contentθr=0.057 m3m−3, saturated water contentθs=0.41 m3m−3,α=12.4 m−1,n=2.28 and saturated hydraulic conduc-tivityKs=0.146 m h−1. The flow domain was discretized based on a 1 m by 1 m DEM with a vertical spacing between mesh layers of 0.1 m. The initial conditions were de-15
fined in the pressure head, starting with a uniform pressure head of−0.5 m throughout the model domain, followed by a 10 day drainage period. An atmospheric bound-ary condition including hourly records of precipitation (the same generated semi-arid Sky Island forest rainfall scenario that was used in the initial modeling) and of potential evaporation rates was specified at the surface of the domain. Potential evaporation was 20
modeled as a sinusoidal curve, with the maximum potential evaporation (4.5 mm d−1) at the start of the rainy season (start of simulation), dropping to 1 mm d-1 at 180 days. This seasonal evaporation trend was overlain with a truncated sinusoidal diurnal varia-tion, assuming 12 h of evaporation during the day and 12 h of no evaporation during the night. Total assumed potential evaporation was 1000 mm a−1. The downslope bound-25
HESSD
6, 4411–4448, 2009Hillslope hydrology under glass at
Biosphere 2
L. Hopp et al.
Title Page
Abstract Introduction
Conclusions References
Tables Figures
◭ ◮
◭ ◮
Back Close
Full Screen / Esc
Printer-friendly Version
Interactive Discussion
2.3 Results of design modeling
2.3.1 Constraining the parameter space
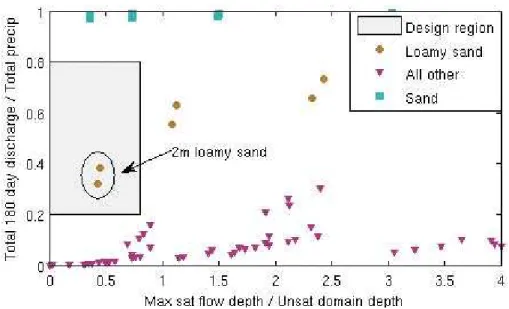
The values of the two metrics,Rw(y-axis) andRs(x-axis), for each of the parsimonious
modeling simulations are plotted against each other in Fig. 3. This figure also shows the region that meets the design criteria set out in the above discussion. Only the two 5
simulations with a 2 m thick loamy sand produced results that fell within the design re-gion. The very high permeability of sandy soils allowed all incoming precipitation to be translated quickly into subsurface runoff. Consequently, only a very small fraction was available to sustain vegetation. For all other soils except loamy sand, the permeability was too low, and the majority of precipitation either evaporated before it reached the 10
base of the unsaturated zone, or lateral flow rates were too low, producing a build up of the water table within the hillslope.
Varying the slope was found to have a second-order effect on the dynamics of the water balance (results not shown). A higher slope produced a higher peak discharge, but its effect on the likelihood of saturation was minor. At low slopes more water re-15
mained in the hillslope, but it was distributed between the swale and the side slopes. At high mean slope, the water table drained more quickly, but there was a higher degree of convergence in the swale, increasing the water table depth slightly compared to the lower slopes.
These results suggested that a texture of loamy sand with relatively high hydraulic 20
HESSD
6, 4411–4448, 2009Hillslope hydrology under glass at
Biosphere 2
L. Hopp et al.
Title Page
Abstract Introduction
Conclusions References
Tables Figures
◭ ◮
◭ ◮
Back Close
Full Screen / Esc
Printer-friendly Version
Interactive Discussion
2.3.2 Lateral subsurface flow and spatial patterns of moisture
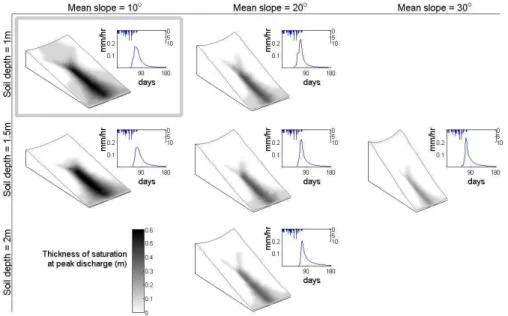
For all five scenarios simulated with Hydrus-3D, subsurface flow accounted for approx-imately 33% of the rainfall, with actual evaporation accounting for the remaining 67%. The hydrographs of the lateral subsurface flow consisted of one seasonal peak, with little response to individual storm events (Fig. 4).
5
With decreasing soil depth, subsurface flow started earlier and also peak discharge was slightly higher and occurred earlier. Increasing the slope angle had a slight inten-sifying effect on the hydrologic response as well.
Contrary to the parsimonious modeling results, saturation of the entire profile did not occur in any of the scenarios (Fig. 4), meaning that saturation excess overland flow was 10
successfully avoided with the chosen soil texture and the tested slope angle and soil depths (C1). In each simulation, a transient water table developed at the base of the flow domain as a response to the rainfall, rising up to 0.6 m in the profile. Figure 4 also shows the general pattern of moisture distribution with high relative saturation in the soil profile in the swale and towards the downslope boundary and drier zones upslope 15
and on the side ridges (B2). The percentage of area that experienced saturation in the soil profile increased markedly at lower slope angles and also with shallower soils. The main flow path in downslope direction was in the swale, and the bulk of the subsurface flow left the domain around the center of the downslope boundary.
2.4 Recommended design
20
The results of the design modeling were presented to and discussed with the Bio-sphere 2 scientific community. Balancing the principal design criteria and technical constraints (e.g. construction stability) led to a refined final design of the hillslopes that was used for further modeling work (e.g. Ivanov et al., 2009). This refined design con-sisted of the zero-order basin geometry with a 10 degree overall slope and a 1 m soil 25
HESSD
6, 4411–4448, 2009Hillslope hydrology under glass at
Biosphere 2
L. Hopp et al.
Title Page
Abstract Introduction
Conclusions References
Tables Figures
◭ ◮
◭ ◮
Back Close
Full Screen / Esc
Printer-friendly Version
Interactive Discussion simulations, the rainfall was partitioned in approximately 33% lateral subsurface flow
and 67% evaporation.
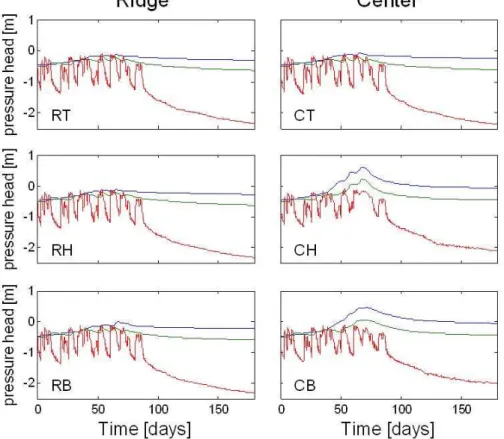
Figure 5 shows time series of pressure head in three depths for six different lo-cations on the hillslope for the final design. Pressure heads near the surface were strongly influenced by atmospheric fluxes, i.e. infiltration and evaporation, whereas 5
pressure heads in deeper zones did not show distinct responses to the dynamics of at-mospheric fluxes. Transient water tables, i.e. positive pressure heads, developed in the swale (locations CH and CT) over the course of the rainy season. The comparison with the hydrographs in Fig. 4 showed that subsurface flow did not start until transient wa-ter tables developed. This behavior is consistent with observations from experimental 10
hillslope sites (Tromp-van Meerveld and McDonnell, 2006b). The simulation demon-strated that the chosen zero-order basin shape with a 10 degree overall slope and 1 m soil depth promotes spatially as well as temporally variable moisture regimes (design considerations B2 and B5), ranging from zones that experienced saturated conditions for extended periods of time (predominantly in the swale) to zones that remained un-15
saturated.
3 Testing three different semi-arid climate scenarios
3.1 Modeling approach
One suggestion for the temporal design of the experiment has been to apply three different climates to the hillslopes (Huxman et al., 2009). This was the motivation to 20
test three different climate scenarios that represent common rainfall distribution in semi-arid regions, using the proposed final hillslope design and the model Hydrus-3D. The objective was to evaluate the importance of the relationship between timing of rainfall and radiation input for the hillslope hydrologic response. These climate scenarios were different to the one used in the design modeling. The first scenario consisted of a 25
HESSD
6, 4411–4448, 2009Hillslope hydrology under glass at
Biosphere 2
L. Hopp et al.
Title Page
Abstract Introduction
Conclusions References
Tables Figures
◭ ◮
◭ ◮
Back Close
Full Screen / Esc
Printer-friendly Version
Interactive Discussion during the six winter months. This means that the majority of rainfall is falling during
the months with high radiative input, a climate typical, for example, of the southwest of the United States. For this scenario, meteorological data from 2001 from the Lucky Hills site within the USDA-ARS Walnut Gulch Experimental Watershed, Arizona, USA, were used as atmospheric boundary conditions (for site description see e.g. Scott et 5
al., 2000). A second scenario adopted the same radiation input but with the rainfall from the original scenario shifted by six months, so that the majority of rain fell in winter. This created a climate with the maximum of rainfall and maximum of radiation input being out of phase, as is typically the case in Mediterranean climates (such as southern Europe, southern California and southwestern Australia). In a third scenario, 10
the same radiation input was again used but the rainfall was distributed statistically uniformly throughout the year.
Total annual rainfall was 371 mm for all three scenarios. The uniform distribution of rainfall was generated stochastically as a Poisson process with approximately the same distribution of storm durations, interstorm periods, and mean intensities as the 15
original data. The generated interstorm duration and storm duration were exponentially distributed whereas the storm depth was gamma-distributed (Ivanov et al., 2009). Max-imum rainfall intensities in the summer and winter rain climate were 20 mm/h whereas intensities in the uniform rainfall distribution did not exceed 5.5 mm h-1. The hillslope was assumed to be free of vegetation. Potential evaporation fluxes were calculated 20
with the Penman-Monteith combination equation that combines radiation and aerody-namic terms (Monteith, 1981; Monteith and Unsworth, 1990) using hourly records of air temperature, relative humidity, wind speed and net radiation from the Lucky Hills site. Calculated annual potential evaporation was 1545 mm.
In order to avoid numerical instabilities due to the high evaporative fluxes at the soil 25
surface, soil hydraulic parameters were changed to values between those of loamy sand and sandy loam, with θr=0.062 m3m−3, θ
s=0.41 m
3
m−3, α
=9.13 m−1, n =2.02 and Ks=0.078 m h−1. This modification also reflected the preliminary results of particle
HESSD
6, 4411–4448, 2009Hillslope hydrology under glass at
Biosphere 2
L. Hopp et al.
Title Page
Abstract Introduction
Conclusions References
Tables Figures
◭ ◮
◭ ◮
Back Close
Full Screen / Esc
Printer-friendly Version
Interactive Discussion Biosphere 2 hillslope construction (Jon Chorover, personal communications). A one
year simulation of the same respective climate was used as initial condition. Apart from these changes, the model setup was identical to the simulation of the final design. Total simulation time was 365 days for each climate scenario.
3.2 Results
5
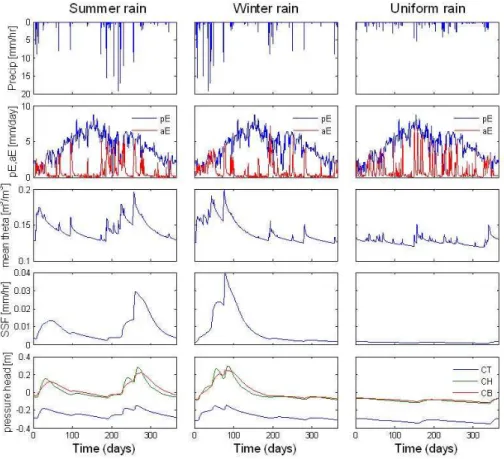
Although the total annual rainfall was the same for all three scenarios, the differences in rainfall timing resulted in marked differences in boundary fluxes (actual evaporation, lateral subsurface flow) and internal moisture dynamics (Fig. 6). The summer rain sce-nario produced two peaks in lateral subsurface flow. A smaller peak occurred during the winter months because, although storm sizes were smaller compared to the sum-10
mer events, the atmospheric demand was low during those months leading to higher lateral subsurface flow generation. In summer, storm sizes were large enough to pro-duce subsurface runoffdespite the high potential evaporation. The winter rain scenario produced only one major peak in lateral subsurface flow in the winter months. The storms in summer, when the radiation input was at its maximum, were too small and 15
infrequent to result in significant subsurface runoff. The uniform rainfall climate, despite having the same total rainfall amount, did not produce a major peak in subsurface flow, and flow rates remained at a low and relatively constant level. Surface runoffdid not occur in any of the simulations. The pressure head time series demonstrated again that the presence of a transient water table was required to trigger a significant subsurface 20
flow response. No transient water tables developed in the case of the uniform rain-fall climate, whereas the occurrence of transient saturation in the summer and winter rain scenarios preceded the rise of the lateral subsurface flow hydrograph. Subsurface runoffaccounted for approximately 20% of the total rainfall in both the summer rain and winter rain scenarios and less than 5% in the case of the uniform rainfall distribution. 25
HESSD
6, 4411–4448, 2009Hillslope hydrology under glass at
Biosphere 2
L. Hopp et al.
Title Page
Abstract Introduction
Conclusions References
Tables Figures
◭ ◮
◭ ◮
Back Close
Full Screen / Esc
Printer-friendly Version
Interactive Discussion 0.2 m3 m−3 (Fig. 6, mean theta). The uniform rainfall scenario showed considerably
less variations over time. Comparing the mean theta, subsurface flow and pressure head curves suggests that a mean water content of 0.16 m3 m−3, corresponding to 38% relative saturation of the hillslope, is required to lead to the development of a tran-sient water table and, thus, to significant lateral subsurface flow. The uniform rainfall 5
distribution with frequent, low intensity storms did not produce sufficient filling of stor-age and the development of transient water tables, a prerequisite for the generation of significant lateral subsurface flow.
Because only bare soil evaporation was considered, the actual evaporation is pri-marily controlled by the near-surface soil moisture conditions. Because of the relatively 10
coarse texture of the soil material used in the simulations, the water content of the soil near the surface quickly dropped to residual water contents during dry periods, and the upward transport of water from deeper regions became negligible. Therefore, the ratio between actual and potential evaporation was significantly less than unity (19% for the summer rain climate, 18% for the winter rain climate and 22% for the uniform 15
rainfall scenario). Actual evaporation was high only during and shortly after storms and decreased strongly during interstorm periods. While pressure heads at the soil surface reached very low values due to evaporation, pressure heads in the rest of the domain remained greater than−4 m, indicating that sufficient water would be available to support vegetation in these climate scenarios.
20
The simulation of the three semi-arid climates showed the importance of the rela-tive timing between rainfall and potential evaporation (i.e. surface energy input) for the movement of water in the hillslope. The interplay between evaporation and infiltration determines the amount of water that is available for percolation into deeper zones, fill-ing of storage and the generation of lateral subsurface flow. Under the assumed high 25
HESSD
6, 4411–4448, 2009Hillslope hydrology under glass at
Biosphere 2
L. Hopp et al.
Title Page
Abstract Introduction
Conclusions References
Tables Figures
◭ ◮
◭ ◮
Back Close
Full Screen / Esc
Printer-friendly Version
Interactive Discussion
4 Discussion
4.1 Difficult tradeoffs in the Biosphere 2 hydrologic design
The process of designing an experiment like the Biosphere 2 hillslopes is clearly diff er-ent from traditional benchtop-scale and hillslope-scale efforts of the last few decades. Laboratory experiments are generally designed around a focused question or set of 5
questions, and the experimental systems are greatly simplified with respect to scale and boundary conditions compared to the real world. Classic works that have iso-lated hillslope segments at the benchtop-scale (Anderson and Burt, 1977) or hillslope scale (Hewlett and Hibbert, 1963) are examples of where a clear experimental design mapped to a singular research question led to new breakthroughs on discovery of par-10
ticular flow processes (e.g. the role of soil drainage on maintenance of stream baseflow as shown by Hewlett and Hibbert, 1963). More recent examples at the benchtop-scale (i.e. Kosugi et al., 2004) and hillslope-scale (i.e. Kendall et al., 2001) have continued in this tradition of isolating single features of a system and elucidating particular flow processes (e.g. macropore flow contributions to pore pressures or stream chemistry 15
dynamics).
The Biosphere 2 design is different to these previous focused efforts. It is per-haps more akin to what was attempted with the roof-covered catchment experiment at G ˚ardsj ¨on, Sweden (see Bishop and Hultberg, 1995 and many others) where com-promises where made to accommodate interdisciplinary research and multi-faceted 20
research objectives. Identifying the fundamental considerations that transcended the individual scientific objectives of each scientist involved in the experimental design of the Biosphere 2 hillslopes provided the conceptual scaffolding on which the details of the design could be built. These considerations emerged from a long period of inter-actions, in a way analogous to the emergence of complexity expected in the hillslope 25
HESSD
6, 4411–4448, 2009Hillslope hydrology under glass at
Biosphere 2
L. Hopp et al.
Title Page
Abstract Introduction
Conclusions References
Tables Figures
◭ ◮
◭ ◮
Back Close
Full Screen / Esc
Printer-friendly Version
Interactive Discussion final design – quite profoundly – in three ways: (1) we chose not to replicate a
previ-ously well-studied hillslope, (2) we chose an impermeable lower boundary and (3) we chose a convergent hollow as our topographic blueprint.
So why did we choose to not replicate a previously well-studied hillslope? Previ-ous trenched hillslope experiments at a scale very similar to the Biosphere 2 hillslope 5
bays have been completed in the past decade at Georgia, USA (Freer et al., 2002), New Zealand (Woods and Rowe, 1996), Oregon, USA (McGuire et al., 2007), Japan (Uchida et al., 2005) and Canada (Buttle and Turcotte, 1999). Intense discussion re-volved around possibly replicating one of these systems within the Biosphere 2 bays. The main rationale for not choosing to replicate an existing site was the awkward juxta-10
position of site specificity with local climate constraints. While the Biosphere 2 climate can be controlled, it seemed that imposing the boundary conditions from a very different geographic setting might condition the results too greatly for the Biosphere 2 experi-ments. The more generic hillslope form – as described in this paper – was agreed upon as a better option for initial conditions that would best serve the overall goals of 15
the project.
We chose an impermeable lower boundary for our Biosphere 2 slopes largely out of practicality. Bedrock permeability has been shown in several recent hillslope studies to influence the development of transient saturation (Ebel et al., 2008) and connectivity of hillslope flow patches (Hopp and McDonnell, 2009). Several recent field studies have 20
quantified bedrock permeability at the hillslope scale through sprinkling experiments (e.g. Tromp-van Meerveld et al., 2007) so that some bedrock permeability values are already known. In the end, the issue of bedrock permeability was “decided” based on technical feasibility. It was not possible, within the constraints of the budget, to con-sider how a permeable bedrock might be incorporated into the design and how that 25
HESSD
6, 4411–4448, 2009Hillslope hydrology under glass at
Biosphere 2
L. Hopp et al.
Title Page
Abstract Introduction
Conclusions References
Tables Figures
◭ ◮
◭ ◮
Back Close
Full Screen / Esc
Printer-friendly Version
Interactive Discussion concrete) as the layer below the soil (e.g. Hewlett and Hibbert (1963) at Coweeta
Hy-drologic Laboratory; Kendall et al. (2001) at Hydrohill, China). Based on these find-ings and other work from natural experimental hillslopes, we know a priori that the impermeable bedrock at Biosphere 2 will influence the longevity of water table devel-opment. Notwithstanding, the main science question is to examine the co-evolution of 5
a vegetation-hillslope system. As such, knowledge of the lower boundary in this sense trumps bedrock permeability “realness” as an impermeable lower boundary shifts our focus exclusively to the soil mantle and ecohydrologial processes within it. Thereby, the degrees of freedom about these biological-hydrological interactions are reduced and our system is greatly simplified in terms of its response.
10
We chose a convergent hollow as our topographic blueprint mainly to increase op-tions for hydrological and ecological heterogeneity at the scale of our experiment. The slope angle range that we could reproduce at Biosphere 2 would rarely if ever form such a distinct convergent hollow (Carson and Kirkby, 1972). Nevertheless, we chose a convergent hollow as hillslope shape (as opposed to a planar slope) to provide some 15
heterogeneity in radiative input and soil moisture conditions. These subtle differences in incident radiation and upslope contributing area for water flux will exert qualitative changes on slope processes. With the other factors held constant (soil type, soil depth, bedrock permeability, etc.), the spatial patterns stemming from the convergent topog-raphy will allow comparison of responses within treatments. Spatial patterns of soil 20
moisture at the hillslope scale (Tromp-van Meerveld and McDonnell, 2006) and catch-ment scale (e.g. Wilson et al., 2004) have shown qualitatively how vegetation begins to obscure topographic controls on moisture distribution after leaf-out. Within the Bio-sphere 2 experimental design, we will be able to quantify such influences and strike at the mechanistic controls of vegetation on soil water dynamics, and vice versa. Conse-25
HESSD
6, 4411–4448, 2009Hillslope hydrology under glass at
Biosphere 2
L. Hopp et al.
Title Page
Abstract Introduction
Conclusions References
Tables Figures
◭ ◮
◭ ◮
Back Close
Full Screen / Esc
Printer-friendly Version
Interactive Discussion
4.2 How modeling has informed design
Modeling was a critical part of the design process. The modeling work so far has suggested that the proposed hillslope design is likely to meet the principal design con-siderations. It is capable of supporting vegetation under the semi-arid climates of the South-West (B1, B4). It will permit the development of transient lateral connectivity 5
across the hillslopes (B3) and it will facilitate spatial and temporal variability in soil moisture (B2, B5). Together with the vegetation, the evolution of the soil profile is likely to produce spatial heterogeneity in hydrologic properties and behavior (A1). The sim-ulations suggest that the current design is also likely to be stable geomorphically (C1) while remaining technically feasible (C2). Finally it embodies the principles of simplicity 10
and elegance (A2), and will allow further refinements to be made to the experimental design in the selection of the climate and vegetation treatments across the three hill-slopes and through time.
It is notable that the behavior of the hillslope, as predicted by the modeling, is strongly seasonal, and does not show a significant response to individual events. Given that 15
the characteristic subsurface flow timescale – given by the time for a kinematic wave to travel through the hillslope (Harman and Sivapalan, 2009) – is on the order of 50 days, this is unsurprising. The smoothly-varying pressure heads deeper in the soil profile (Fig. 5) suggest that the unsaturated zone is also playing a role in filtering the high-frequency variability. In essence, though, the lack of an event-scale response 20
can be attributed to the lack of any threshold-like runoffmechanism, like overland flow, bedrock storage or preferential flow, to turn on in sufficiently large or intense storms. Such mechanisms, particularly preferential flow, may develop in the hillslope over time once vegetation and geochemical changes begin to alter the properties of the hillslope, leading to the formation of an event-scale response.
HESSD
6, 4411–4448, 2009Hillslope hydrology under glass at
Biosphere 2
L. Hopp et al.
Title Page
Abstract Introduction
Conclusions References
Tables Figures
◭ ◮
◭ ◮
Back Close
Full Screen / Esc
Printer-friendly Version
Interactive Discussion
4.3 Projecting future behavior of the Biosphere 2 hillslope
Due to the large uncertainties about the feedback between hydrology and geochem-istry, biology and geomorphology, however, the design modeling could not be used to project the hydrologic behavior of the hillslope into the future with any degree of confidence. These uncertainties are the raison d’ ˆetre of the Biosphere 2 hillslope ex-5
periment, and it is the complex behavior not fully anticipated in advance that will likely produce the greatest advances in our knowledge. From a hydrologic perspective, some of the outstanding questions about the evolution of the Biosphere 2 hillslopes are:
– How will the vegetation dynamics adapt to the hydrologic conditions and in turn alter the water balance through transpiration?
10
– How will the structure of the soil change over time due to geochemical and bio-logical factors? How will these changes in turn alter the hydraulic properties and flow pathways through the subsurface (including the formation of preferential flow networks)?
– How will spatial patterns of occasional overland flow and infiltration drive changes 15
in surface morphology and soil properties, and how will these changes alter the surface water and energy balance?
– How will these effects combine to create evolving patterns of variability and con-nectivity in the unsaturated and saturated zones of the subsurface?
– What will be the integrated effect of these factors on the signatures of discharge 20
variability and water chemistry at the whole-hillslope scale?
Work is already underway to address some of these uncertainties using available mod-els, and their results will generate more confidence in the design, and more refinements to the final experimental set-up. The geochemical model CrunchFlow07 (Steefel and Lasaga, 1994) has been used to examine how the soil oxygen levels, pH, and min-25
HESSD
6, 4411–4448, 2009Hillslope hydrology under glass at
Biosphere 2
L. Hopp et al.
Title Page
Abstract Introduction
Conclusions References
Tables Figures
◭ ◮
◭ ◮
Back Close
Full Screen / Esc
Printer-friendly Version
Interactive Discussion (Dontsova et al., 2009). The distributed hydrology – dynamic vegetation model
tRIBS-VEGGIE (Ivanov et al., 2008) is being used to investigate how vegetation-hydrology feedbacks over time affect water-use and primary productivity (Ivanov et al., 2009).
The Biosphere 2 experiment itself aims to overcome these uncertainties in two ways. One way is bottom-up, through the development and testing of an integrated process 5
model that can reproduce and predict the evolution of the hillslope hydrologic behavior through time, along with the evolution of the geochemical, biological, pedological and geomorphic systems. The other is through observing and interrogating patterns that emerge in the data (top down), and using these for the formulation of new theory, hypotheses and models.
10
5 Conclusions
The Biosphere 2 Hillslope Experiment is being designed to address fundamental ques-tions about how natural landscape processes interact and co-evolve through time. The Biosphere 2 facility’s unique spatial scale provides the opportunity for controlled exper-iments at a large scale, bridging the gap between controlled, laboratory-scale experi-15
ments and field experiments under natural conditions. The first phase of the experiment has included pre-construction modeling efforts in hydrology, ecology and geochemistry that aim at supporting the design and construction process of the hillslopes as well as providing initial model predictions of the anticipated evolution of the vegetation-hillslope systems.
20
The Biosphere 2 Hillslope Experiment will serve as an excellent basis to test hy-potheses, validate existing models and develop coupled process models. Furthermore, the aim of this extraordinary community effort is to not only observe and qualitatively describe interactions and feedbacks between hydrology, soil evolution, biota and geo-morphology but also to quantify the relationships and mechanisms, thereby advancing 25
our ability to predict the evolution of hydrologic systems in general (Troch et al., 2009).
Ex-HESSD
6, 4411–4448, 2009Hillslope hydrology under glass at
Biosphere 2
L. Hopp et al.
Title Page
Abstract Introduction
Conclusions References
Tables Figures
◭ ◮
◭ ◮
Back Close
Full Screen / Esc
Printer-friendly Version
Interactive Discussion periment planning workshops in 2007 and 2008 for fruitful discussions and comments on this
manuscript (complete list of participants at http://www.b2science.org/earth-hillslope.html). We are grateful to Travis Huxman, Director of B2 Earthscience, and the B2 Earthscience Science Steering Committee for their support of this work. This work was also supported by the NSF-funded Hydrologic Synthesis Project at the University of Illinois at Urbana-Champaign.
5
References
Anderson, M. G. and Burt, T. P.: A laboratory model to investigate the soil moisture conditions on a draining slope, J. Hydrol., 33, 383–390, 1977.
Bishop, K. H. and Hultberg, H.: Reversing Acidification in a Forest Ecosystem – the Gardsjon Covered Catchment, Ambio, 24, 85–91, 1995.
10
Brantley, S. L., Goldhaber, M. B., and Ragnarsdottir, K. V.: Crossing disciplines and scales to understand the Critical Zone, Elements, 3, 307–314, 2007.
Brown-Mitic, C., Shuttleworth, W. J., Harlow, R. C., Petti, J., Burke, E., and Bales, R.: Seasonal water dynamics of a sky island subalpine forest in semi-arid southwestern United States, J. Arid Environ., 69, 237–258, 2007.
15
Buttle, J. M. and Turcotte, D. S.: Runoffprocesses on a forested slope on the Canadian shield, Nordic Hydrol., 30, 1–20, 1999.
Buttle, J. M. and McDonald, D. J.: Coupled vertical and lateral preferential flow on a forested slope, Water Resour. Res., 38, 1060, doi:10.1029/2001WR000773, 2002.
Carsel, R. F. and Parrish, R. S.: Developing Joint Probability-Distributions of Soil-Water Reten-20
tion Characteristics, Water Resour. Res., 24, 755–769, 1988.
Carson, M. A. and Kirkby, M. J.: Hillslope form and process, Cambridge University Press, Cambridge, 475 pp., 1972.
Dontsova, K., Steefel, C. I., Desilets, S., Thompson, A., and Chorover, J.: Coupled modeling of hydrologic and geochemical fluxes for prediction of solid phase evolution in the Biosphere 2 25
hillslope experiment, Hydrol. Earth Syst. Sci. Discuss., 6, 4449–4483, 2009, http://www.hydrol-earth-syst-sci-discuss.net/6/4449/2009/.
Dunn, S. M., Freer, J., Weiler, M., Kirkby, M. J., Seibert, J., Quinn, P. F., Lischeid, G., Tetzlaff, D., and Soulsby, C.: Conceptualization in catchment modelling: simply learning?, Hydrol. Process., 22, 2389–2393, 2008.
HESSD
6, 4411–4448, 2009Hillslope hydrology under glass at
Biosphere 2
L. Hopp et al.
Title Page
Abstract Introduction
Conclusions References
Tables Figures
◭ ◮
◭ ◮
Back Close
Full Screen / Esc
Printer-friendly Version
Interactive Discussion Ebel, B. A., Loague, K., Montgomery, D. R., and Dietrich, W. E.: Physics-based continuous
simulation of long-term near-surface hydrologic response for the Coos Bay experimental catchment, Water Resour. Res., 44, W07417, doi:10.1029/2007WR006442, 2008.
Eberhardt, L. L. and Thomas, J. M.: Designing Environmental Field Studies, Ecol. Monogr., 61, 53–73, 1991.
5
Fiori, A. and Russo, D.: Numerical analyses of subsurface flow in a steep hillslope under rainfall: The role of the spatial heterogeneity of the formation hydraulic properties, Water Resour. Res., 43, W07445, doi:10.1029/2006WR005365, 2007.
Freer, J., McDonnell, J. J., Beven, K. J., Peters, N. E., Burns, D. A., Hooper, R. P., Aulenbach, B., and Kendall, C.: The role of bedrock topography on subsurface storm flow, Water Resour. 10
Res., 38, 1269, doi:10.1029/2001WR000872, 2002.
Gerwin, W., Raab, T., Biemelt, D., Bens, O., and Httl, R. F.: The artificial water catchment “Chicken Creek” as an observatory for critical zone processes and structures, Hydrol. Earth Syst. Sci. Discuss., 6, 1769–1795, 2009,
http://www.hydrol-earth-syst-sci-discuss.net/6/1769/2009/. 15
Harman, C. and Sivapalan, M.: A similarity framework to assess controls on shallow subsurface flow dynamics in hillslopes, Water Resour. Res., 45, W01417, doi:10.1029/2008WR007067, 2009.
Hewlett, J. D. and Hibbert, A. R.: Moisture and energy conditions within a sloping soil mass during drainage, J. Geophys. Res., 68, 1081–1087, 1963.
20
Hopp, L. and McDonnell, J. J.: Connectivity at the hillslope scale: Identifying interactions be-tween storm size, bedrock permeability, slope angle and soil depth, J. Hydrol., in review, 2009.
Huxman, T., Troch, P., Chorover, J., Breshears, D. D., Saleska, S., Pelletier, J., Zeng, X., and Espeleta, J.: The Hills are Alive: Earth Science in a Controlled Environment, EOS, Transac-25
tions, American Geophysical Union, 90, p. 120 , 2009.
Ivanov, V. Y., Bras, R. L., and Vivoni, E. R.: Vegetation-hydrology dynamics in complex terrain of semiarid areas: 1. A mechanistic approach to modeling dynamic feedbacks, Water Resour. Res., 44, W03429, doi:10.1029/2006WR005588, 2008.
Ivanov, V. Y., Jenerette, D., and Espeleta, J.: The Biosphere2 hillslope experiment: aspects of 30
vegetation-hydrology dynamics in response to climatic variability, in preparation, 2009. Kampf, S. K. and Burges, S. J.: Parameter estimation for a physics-based distributed hydrologic
HESSD
6, 4411–4448, 2009Hillslope hydrology under glass at
Biosphere 2
L. Hopp et al.
Title Page
Abstract Introduction
Conclusions References
Tables Figures
◭ ◮
◭ ◮
Back Close
Full Screen / Esc
Printer-friendly Version
Interactive Discussion W12414, doi:10.1029/2006WR005605, 2007.
Kendall, C., McDonnell, J. J., and Gu, W. Z.: A look inside “black box” hydrograph separation models: a study at the Hydrohill catchment, Hydrol. Process., 15, 1877–1902, 2001.
Kosugi, K., Uchida, T., and Mizuyama, T.: Numerical calculation of soil pipe flow and its effect on water dynamics in a slope, Hydrol. Process., 18, 777–789, 2004.
5
Kumar, P.: Variability, Feedback, and Cooperative Process Dynamics: Elements of a Unifying Hydrologic Theory, Geography Compass, 1, 1338–1360, 2007.
Lin, H., Bouma, J., Pachepsky, Y., Western, A., Thompson, J., van Genuchten, R., Vogel, H. J., and Lilly, A.: Hydropedology: Synergistic integration of pedology and hydrology, Water Resour. Res., 42, W05301, doi:10.1029/2005WR004085, 2006.
10
Lyon, S. W., Desilets, S. L. E., and Troch, P. A.: Characterizing the response of a catchment to an extreme rainfall event using hydrometric and isotopic data, Water Resour. Res., 44, W06413, doi:10.1029/2007WR006259, 2008.
McClain, M. E., Boyer, E. W., Dent, C. L., Gergel, S. E., Grimm, N. B., Groffman, P. M., Hart, S. C., Harvey, J. W., Johnston, C. A., Mayorga, E., McDowell, W. H., and Pinay, G.: Biogeo-15
chemical hot spots and hot moments at the interface of terrestrial and aquatic ecosystems, Ecosystems, 6, 301–312, 2003.
McDonnell, J. J., Sivapalan, M., Vache, K., Dunn, S., Grant, G., Haggerty, R., Hinz, C., Hooper, R., Kirchner, J., Roderick, M. L., Selker, J., and Weiler, M.: Moving beyond heterogeneity and process complexity: A new vision for watershed hydrology, Water Resour. Res., 43, W07301, 20
doi:10.1029/2006WR005467, 2007.
McGuire, K. J., Weiler, M., and McDonnell, J. J.: Integrating tracer experiments with modeling to assess runoffprocesses and water transit times, Adv. Water Resour., 30, 824–837, 2007. McHale, M. R., McDonnell, J. J., Mitchell, M. J., and Cirmo, C. P.: A field-based study of soil
water and groundwater nitrate release in an Adirondack forested watershed, Water Resour. 25
Res., 38, 1031, doi:10.1029/2000WR000102, 2002.
McNamara, J. P., Chandler, D., Seyfried, M., and Achet, S.: Soil moisture states, lateral flow, and streamflow generation in a semi-arid, snowmelt-driven catchment, Hydrol. Process., 19, 4023–4038, 2005.
MEA: Millennium Ecosystem Assessment. Ecosystems and Human Well-being: Desertification 30
Synthesis., World Resources Institute, Washington, DC, 2005.
HESSD
6, 4411–4448, 2009Hillslope hydrology under glass at
Biosphere 2
L. Hopp et al.
Title Page
Abstract Introduction
Conclusions References
Tables Figures
◭ ◮
◭ ◮
Back Close
Full Screen / Esc
Printer-friendly Version
Interactive Discussion Monteith, J. L. and Unsworth, M. H.: Principles of Environmental Physics, Edward Arnold,
London, 1990.
Newman, B. D., Campbell, A. R., and Wilcox, B. P.: Lateral subsurface flow pathways in a semiarid ponderosa pine hillslope, Water Resour. Res., 34, 3485–3496, 1998.
Platt, J. R.: Strong inference, Science, 146, 347–353, 1964. 5
Reynolds, J. F., Smith, D. M. S., Lambin, E. F., Turner, B. L., II, Mortimore, M., Batter-bury, S. P. J., Downing, T. E., Dowlatabadi, H., Fernandez, R. J., Herrick, J. E., Huber-Sannwald, E., Jiang, H., Leemans, R., Lynam, T., Maestre, F. T., Ayarza, M., and Walker, B.: Global Desertification: Building a Science for Dryland Development, Science, 316, 847–851, doi:10.1126/science.1131634, 2007.
10
Schaap, M. G., Leij, F. J., and van Genuchten, M. T.: ROSETTA: a computer program for estimating soil hydraulic parameters with hierarchical pedotransfer functions, J. Hydrol., 251, 163–176, 2001.
Scott, R. L., Shuttleworth, W. J., Keefer, T. O., and Warrick, A. W.: Modeling multiyear obser-vations of soil moisture recharge in the semiarid American Southwest, Water Resour. Res., 15
36, 2233–2247, 2000.
Simunek, J., van Genuchten, M. T., and Sejna, M.: The HYDRUS software package for simu-lating two- and three-dimensional movement of water, heat, and multiple solutes in variably-saturated media: Technical manual, Version 1.0., PC-Progress, Prague, Czech Republic, 213 pp., 2006.
20
Simunek, J., van Genuchten, M. T., and Sejna, M.: Development and applications of the HY-DRUS and STANMOD software packages and related codes, Vadose Zone J., 7, 587–600, 2008.
Sivapalan, M.: Pattern, Process and Function: Elements of a Unified Theory of Hydrology at the Catchment Scale, in: Encyclopedia of Hydrological Sciences, edited by: Anderson, M. 25
G., John Wiley & Sons Ltd., 2005.
Soulsby, C., Neal, C., Laudon, H., Burns, D. A., Merot, P., Bonell, M., Dunn, S. M., and Tetzlaff, D.: Catchment data for process conceptualization: simply not enough?, Hydrol. Process., 22, 2057–2061, 2008.
Steefel, C. I. and Lasaga, A. C.: A Coupled Model for Transport of Multiple Chemical-Species 30
and Kinetic Precipitation Dissolution Reactions with Application to Reactive Flow in Single-Phase Hydrothermal Systems, American Journal of Science, 294, 529–592, 1994.