1
Bragantia, Campinas, Ahead of print, 2019 ABSTRACT: Description and prediction of water flow through
unsaturated soils is necessary to understand their hydraulic properties, including soil water retention curve (SWRC). Many models have been developed for estimation of SWRC and many researchers compared water retention curve derived from these models with the measured values. In this paper, in addition to comparing measured and derived SWRC, a functional evaluation of SWRC for modeling of soil water movement was carried out using van Genuchten, Brooks-Corey, Campbell and Hutson-Cass models in three sites including Loamy sand, Loam and Clay loam soils. Therefore, the functional behavior of SWRC was quantitatively compared by applying mentioned SWRC to numerical code (HydroGeoSphere) to simulate soil profile drainage under steady-state and transient conditions. The agreement between simulated and measured free drainages values was evaluated using
Performance evaluation of different soil water
retention functions for modeling of water flow
under transient condition
Fatemeh Zakizadeh Abkenar1, Ali Rasoulzadeh2*, Ali Asghari3
1.University of Mohaghegh Ardabili - Faculty of Agriculture and Natural Resources - Soil Science Department - Ardabil - Islamic Republic of Iran.
2.University of Mohaghegh Ardabili - Faculty of Agriculture and Natural Resources - Water Engineering Department - Ardabil - Islamic Republic of Iran.
3.University of Mohaghegh Ardabili - Agronomy and Plant Breeding - Ardabil - Islamic Republic of Iran..
*Corresponding author: [email protected]
Received: Nov. 23, 2017 – Accepted: Mar. 26, 2018
statistical criteria including mean absolute error (MAE), modified index of agreement (d’), modified coefficient efficiency (E’), and t-test. The results demonstrated that the van Genuchten model was slightly better than the other models for estimation of SWRC (MAE 0.014 – 0.016,
E’ 0.80 – 0.87 and d’ 0.90 – 0.93) while according to t-test, it was found that the measured and estimated SWRC using various models did not differ significantly. Therefore, it is expected that the simulated free drainage using mentioned SWRC models did not differ significantly with observed values. But the results demonstrated that the simulated free drainage using Brooks-Corey model for Loamy sand soil and van Genuchten and Brooks-Corey models for Loam soil differed significantly (p ≤ 0.05) with measured values.
Key words: HydroGeoSphere, soil hydraulic properties, soil water flow simulation, soil characteristic curve.
Bragantia, Campinas, Ahead of print, 2019
2
F. Z. Abkenar et al.
INTRODUCTION
Soil water retention curve (SWRC) is one of the important soil hydraulic properties in the simulation of water flow in vadose zone. Measurement of the SWRC is time consuming and many attempts have been made to extend pedotransfer functions that describe the relationship between SWRC and ease to measure soil properties (Assouline et al. 1998; Campbell and Shiozawa 19944; Rajkai et al. 2004; Williams et al. 1992). Many empirical models for the SWRC estimation are presented, and each of them has strengths and weaknesses. The van Genuchten (1980) model for the SWRC and Mualem (1976) model for the unsaturated hydraulic conductivity (K(θ)) are popular and widely used for simulation of water flow, which are stated as follows (Eqs. 1 and 2):
value (cm–1); and λ is a pore-size distribution parameter. For notational convenience, h and α are considered positive values for unsaturated soils (i.e., h denotes suction). The Brooks-Corey model has been shown to create moderately accurate results for many coarse-textured soils branded with large λ values and in high suction but results have normally been less accurate for fine-textured with small λ values (van Genuchten et al. 2000; Gimenz et al. 2001).
Campbell (1974) have used the same power law model offered by Brooks and Corey (1964) to state SWRC as a function of the air entry pressure head he and factor b, which depends on soil texture (Eq. 5):
4Campbell, G. S. and Shiozawa, S. (1994). Prediction of hydraulic properties of soils using
particle-size distribution and bulk density data. Proceedings of the International Workshop on Indirect Methods for Estmating the Hydraulic Properties of Unsaturated Soils; Riverside, USA.
where h represents the pressure head (cm-water); θ(h) is the soil water content (cm3∙cm–3) at the h pressure head; Ks is saturated hydraulic conductivity; and θs and θr denote saturated and residual soil water contents (cm3∙cm–3), respectively. The symbols α, n and m are shape parameters and m is assumed to be m = 1 – 1/n. Note that n parameter affects the steepness of the S-shaped of SWRC (Wösten et al. 1995).
Brooks and Corey (1964) proposed other models for the SWRC and K(θ), given by Eqs. 3 and 4:
Dear professor Bruna Erlandsson,
Hi
The article was studied. A few small comments are provided in the text of the article. I could not present a comment on Equation 1 in the article's text. It is better the Equation 1 is presented in text of article as follows:
1 ||
If possible, it is replaced.
Best wishes,
Ali Rasoulzadeh
θ θ α
λ α λ λ q q θ ÷ ø ö ç è æ -÷÷ ø ö çç è æ ´ = b e s h h h 1 ) ( q q ÷÷ ø ö çç è æ q q q λ α λ λ q q θ ÷ ø ö ç è æ -÷÷ ø ö çç è æ ´ q q 3 2 ) ( + ÷÷ ø ö çç è æ = b s s K K q q q q ï ï ï ï î ï ï ï ï í ì ³ ÷÷ ø ö çç è æ ÷÷ ø ö çç è æ -< ÷÷ ø ö çç è æ = -i b s i e s i i 1/b e h h h h h θ θ 1 -θ θ θ θ ) θ( 2 2 2 s s s q q q q q θ θ θ θ α θ ï î ï í ì ³ -q a q q q q ) ( 1 1 ) ( ) ( 2 / 1 5 . 0 ú ú ú û ù ê ê ê ë é ÷ ÷ ø ö ç ç è æ ÷÷ ø ö çç è æ -÷÷ ø ö çç è æ -= m m r s r r s r s h h K K q q q q q q q q q ïî ï í ì £ ´ - -a q a a q q q q l ÷÷ ø ö çç è æ -- l q q q q q θ θ θ θ α θ ï î ï í ì ³ -q a q q q q ú ú ú û ù ê ê ê ë é ÷ ÷ ø ö ç ç è æ ÷÷ ø ö çç è æ -÷÷ ø ö çç è æ -q q q q q q q q q
(
)
1/ / 1 ) ( s ïî ï í ì £ > ´ -+ = -a q a a q q q q l h h hh r s r
÷÷ ø ö çç è æ -- l q q q q q θ θ θ θ α θ ( ï î ï í ì ³ -q a q q q q ú ú ú û ù ê ê ê ë é ÷ ÷ ø ö ç ç è æ ÷÷ ø ö çç è æ -÷÷ ø ö çç è æ -q q q q q q q q q ïî ï í ì £ ´ - -a q a a q q q q l ) ( ) ( 4 / 2 + ÷÷ ø ö çç è æ -= l q q q q q r s r s h K K (1) (5) (6) (7) (2) (3) (4)
where θr and θs are the residual and saturated water contents (cm3∙cm–3), respectively; α is the inverse of the air entry
where h and he are the soil water and air entry pressure head, respectively; θ (h) is the soil water content (cm3∙cm–3) at the h pressure head; θs and b are the saturated water content and empirical parameter, respectively. The K(θ) model is considered as follows (Eq. 6):
with all the parameters defined previously.
Campbell model is not able to predict SWRC below the air entry point. For this reason, Hutson and Cass (1987) modified Campbell model and obtained soil water retention curve in two parts (the exponential and hyperbolic) based on Campbell model. Hutson-Cass models are expressed as follows (Eq. 7):
3
Bragantia, Campinas, Ahead of print, 2019
Soil water retention functions
defi ned before:
MATERIALS AND METHODS
Study area and Experimental device
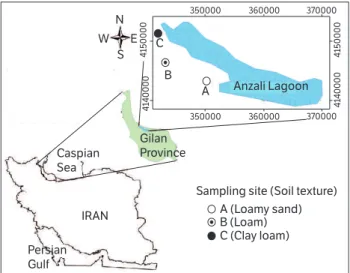
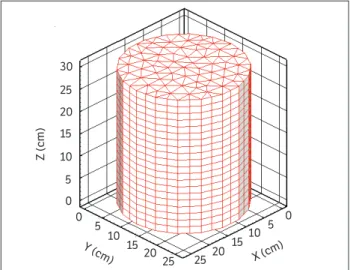
Guilan province (study area) is located in northwest of Iran with average annual temperature of 15.3 °C, precipitation of 1853 mm. Th ree sites in the study area were taken into account for soil sampling with diff erent textural classes including Loamy sand, Loam and Clay loam, denoted sites A, B and C, respectively (Fig. 1). Undisturbed soil samples were supplied from 0 – 30 cm depth using three iron cylinders as micro-lysimeter. Th e inside diameter of micro-lysimeter was 25 cm with 40 cm height (Fig. 2). q
ï ï ï ï
î ï ï ï ï
í ì
³
÷÷ ø ö çç è æ
÷÷ ø ö çç è æ
-÷÷ ø ö çç è æ
-θ θ θ
θ θ θ
θ
q q
q q q
) ( θ
2b 1
2bθ
s i
+
= (8)
Accuracy of these models was evaluated by their correlation between estimated and measured SWRC. Among mentioned models, van Genuchten and Brooks-Corey are the most popular because of more strength points and better adaptation with measured SWRC, but their results are compared with measurement of one branch of SWRC (mostly drying branch). It is necessary to note that due to the complicated essence of liquid-phase form in an unsaturated porous medium, the relation between water pressure and water content is not unique and presents hysteresis eff ects. Many researchers investigate accuracy of soil water retention curves estimation via the SWRC models. Ross et al. (1991) and Nimmo (1991) expressed that the van Genuchten model has good performance in middle and high range of saturation but oft en there was poor result in low moisture. Manyame et al. (2007) compared operation of three van Genuchten and Campbell and Vauclin models (basing indirect methods) in sandy soils of Niger. Th eir results showed that the estimation of Campbell model is more accurate than van Genuchten model for the soil samples with higher content of sand. Rasoulzadeh and Ghoorabjiri (2011; 2014) used Van Genuchten and Brooks-Corey’s soil water models along with HydroGeoSphere, which is based on Richards’ equation, to simulate water fl ow in the forest fl oors. Th ey implemented the reverse model to get the parameters of SWRC. Th e good compatibility between measured and simulated free drainage for all treatments in the validation period shows that the Van Genuchten and Brooks-Corey’s models effi ciently characterize the water fl ow in the forest fl oor.
All of these investigations have evaluated the estimation of these models with one branch of SWRC, while the main application of SWRC is modeling water movement in soil. Due to uniqueness of SWRC, there is complexity to evaluate accuracy of the SWRC models. In this study, the accuracy of four SWRC models (Campbell, Brooks-Corey, van Genuchten and Hutson-Cass) to estimate the water retention curve has been studied. In addition, the function of these models to simulate the water movement in soil by employing them as input data in a numerical code (HydroGeoSphere) was evaluated.
Artificial rainfall was applied on the surface of the lysimeter and free drainage from the end of micro-lysimeter was measured. Rainfall intensity was well-ordered Figure 2. Schematic of the micro-lysimeter.
Figure 1. Location map of the study area.
Sampling site (Soil texture)
C (Clay loam) B (Loam) A (Loamy sand) Caspian
Sea
IRAN
Gilan Province
Anzali Lagoon A
B C
4
140000
4
140000
4
150000
4
150000
350000
350000
360000
360000
370000
370000
N
W E
S
Persian Gulf
Pump
Soil 25 cm
10 cm
30 cm
Tipping bucket gauge
Rainfall simulator
by a pump connected to a raindrop maker to create water drops. Free drainage from the bottom of the micro-lysimeter was gathered and measured using an electronic balance. First, a constant intensity rain was contacted to reach to steady condition as a constant discharge rate from bottom of micro-lysimeter was established so as to accurately define the initial condition required for the numerical simulation of water movement. After reaching the state steady experiment, transient condition was carried out. In transient condition, the random rainfall experiment was conducted and the transient discharge rate from bottom of micro-lysimeter was continuously monitored.
Numerical model description
HydroGeoSphere code is applied to the modified form of Richards’ equation to simulate water flow in a variably-saturated porous media (Eq. 9) (Therrien et al. 2008):
flow in up to three dimensions using a Galerkin finite element approach.
Model discretization and Boundary condition
The GRID BUILDER (McLaren 2004) was used to generate finite element grid as shown in Fig. 3. Grid independency was carried out and the grid size in the vertical direction was yielded 1.5 cm.
(
)
å
G
±
=
+
Ñ
-
m m sS
wt
W
Q
W
q)
exq
.(
)
z
Ñ
-
k
ry
å
G
Ñ
-
q
(
z
)
K
q
=
-
.
k
rÑ
y
+
(9)
(10) where Wm stands for the volumetric fraction of the total porosity occupied by the porous media. This parameter is dimensionless and always equal to 1.0 except when a second porous continuum is considered for a simulation. The q (L∙T–1) is calculated by Eq. 10:
where kr = kr(Sw) shows the relative permeability of the medium (dimensionless) regarding the degree of water saturation Sw (dimensionless); ψ and z are the matric and elevation head (L), respectively; θs is the saturated water content (L3∙L–3); K is the hydraulic conductivity tensor (L∙T–1); and Q (L3∙L–3∙T–1) is the fluid exchange with the outside of the simulation domain. The amount of Q is considered positive for a source and negative for a sink of the porous medium system. The Sw is related to the θ as Sw = θ/θs. In Eq. 9, Γex is the volumetric fluid exchange rate (L3∙L–3∙T–1) between the subsurface domain and all other types of domains supported by the model such as wells, tile drains, discrete fractures and dual continuum.
HydroGeoSphere solves the pressure-head based modified form of Richards’ equation (Eq. 9) for variably-saturated
Figure 3. Numerical model mesh.
30
25 20
15
10
5
0 25
20 15
10 5
X (cm) Y (cm)
Z (cm)
0
25 20 15 10 5 0
The upper boundary of each experimental model (micro-lysimeter) is characterized by specified rainfall fluxes during experiments. The lower boundary is set to free drainage. For the sides of each model no-flow boundary condition is considered. Initial values for water content as well as matric suction head were unknown. To solve this, first the HydroGeoSphere was run for a very long time to reach to pseudo steady as simulated free drainage indicated good consistent with observed value. The matric suction head yielded from pseudo steady condition was applied as the initial value for unsteady simulation.
Laboratory measurements
5
Bragantia, Campinas, Ahead of print, 2019
Soil water retention functions
soil for measuring water retention curve lower than 1000 cm-water as well as bulk density. The undisturbed soil samples were transported carefully to avoid disturbance. The bulk density, particle size distribution and soil particle density were obtained using the oven dried, hydrometer and pycnometer methods, respectively. To obtain the SWRC of each soil sampling in low suctions (less than 100 cm-water), hanging column apparatus and in high suctions (more than 100 cm-water), ceramic pressure plate extractors were used (Dane and Topp 2002).
To estimate the parameters of SWRC models, the measured values of water retention curve were fitted to these models using WATREC software (Rasoulzadeh 2010). In other words, to convert SWRC data (θ versus h) to the SWRC models, the experimental water retention data were fitted to the van Genuchten (Eq. 1) and Brooks-Corey (Eq. 3) as well as Campbell (Eq. 5) and Hutson-Cass (Eq. 7) equations.
The fundamental variable of solution for partial differential flow Eq. 9 is SWRC models. The van Genuchten and Brooks-Corey models were defined in HydroGeoSphere as SWRC models. Campbell and Hutson-Cass parameter’s equations after obtaining by WATREC software were applied in HydroGeoSphere as unsaturated tables.
Saturated hydraulic conductivity of sites B and C were measured in the laboratory by falling head permeability method. The undisturbed soil samples of these sites were the saturated with calcium chloride 0.01 molar. Then saturated hydraulic conductivity was calculated by measuring the duration of water drain from the soil samples. The constant head permeability is used to determine the saturated hydraulic conductivity of site A. In this method, let water move within the soil sample at a uniform pressure (the height of the water in the pressure pipes is uniform). The saturated hydraulic conductivity was calculated by measuring the volume of water displaced over the soil sample at a given time interval (Dane and Topp 2002).
Statistical criteria
Performance of Brooks-Corey, van Genuchten, Campbell and Hutson-Cass models were evaluated by three statistical criteria: mean absolute error (MAE, Eq. 11), modified coefficient efficiency (E’, Eq. 12) and modified index of agreement (d’, Eq. 13):
where Oi and Si are the observed and simulated free drainage values at different time, respectively; O’ is the mean observed value; and n is the number of paired observed-simulated values. MAE describes the difference between the free drainage simulations and observations. The MAE equal to zero indicates perfect fit between the observed and estimated data. The value of E’ varies from –∞ to 1.0, with higher values indicating better agreement with the observations. The value of d’ ranges from 0.0 to 1.0, where d’ equal to 1.0 shows the best fit and lower than 1.0 values represent less accurate consistent between the estimation and observations (Legates and McCabe Jr. 1999). Also t-test was carried out to compare simulated and measured values using SPSS software.
RESULTS AND DISCUSSION
Comparision of the SWRC models to simulate the soil water retention curveswetness in lower value of soil moisture. This result is in line with the findings of Manyame et al. (2007), who have stated that SWRCs modeled by the van Genuchten model have fast matric suction increase in low amounts of moisture for light texture soils. All SWRC models performed well for site C (Clay loam soil). At this site, the van Genuchten model tends to somewhat underestimate matric suction head for volume wetness more than 0.4 cm3∙cm–3. The four models had slightly differences in simulation of SWRCs. They all represent the low water holding capacity on this site. Table 1. Physical properties of the three selected sites.
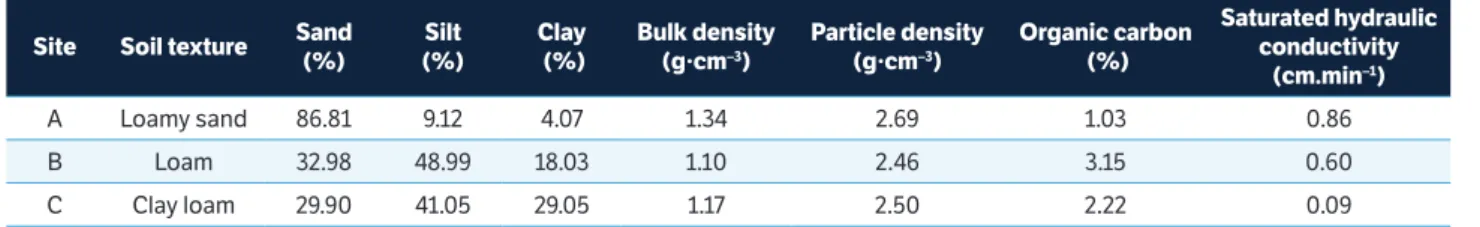
Site Soil texture Sand (%)
Silt (%)
Clay (%)
Bulk density (g∙cm–3)
Particle density (g∙cm–3)
Organic carbon (%)
Saturated hydraulic conductivity
(cm.min–1)
A Loamy sand 86.81 9.12 4.07 1.34 2.69 1.03 0.86
B Loam 32.98 48.99 18.03 1.10 2.46 3.15 0.60
C Clay loam 29.90 41.05 29.05 1.17 2.50 2.22 0.09
Table 2. Parameters of various SWRC models for the three sites.
Site C (Clay loam) Site B (Loam)
Site A (Loamy sand) Parameters
SWRC model
0.061 0.211
0.102 θr (cm3∙cm–3)
van Genuchten 0.511 0.560 0.541
θ
s(cm
3∙cm–3)
0.243 0.065
0.054 θ (cm–1)
1.159 1.615
1.931 n
0.011 0.202
0.091 θr (cm3∙cm–3)
Brooks-Corey 0.502 0.550 0.531
θ
s(cm
3∙cm–3)
0.310 0.097
0.084 θ (cm–1)
0.131 0.470
0.652 λ
0.540 0.552
0.557 θs(cm3∙cm–3)
Campbell and
Hutson-Cass he (cm) 3.676 2.830 3.932
7.721 7.752
3.563 b
! " #$%& ' &() &* *
+,
-(.
/0
*
$
0
(/
"
)
1
&
-2
30
%
4+
! ! "# ! "$ ! "% ! "& ! "' ! "( #!!
#!# #!$ #!% #!& #!'
, &- * $.&2 5- ) 6 &) $01(&) 7 ." " 8* 9: " .&; : - %<=&## > $(* " ) 9: - * *
?/(& @ 3A" - %; * - ) 24
30% B0% 4C 9C
! " #$%& ' &() &* *
+,
-(.
/0
*
$
0
(/
"
)
1
&
-2
30
%
4+
! "# ! "$ ! "% ! "& ' !!
' !'
' !#
' !$
' !%
' !&
, &- * $.&2 5- ) 6 &) $01(&) 7 ." " 8* 9: " .&; : - %<=&## > $(* " ) 9: - * *
?/(& : 3: - #; #" - %4
30% @A0% 49A
0 Site A (Loamy sand)
Site B (Loam)
Site C (Caly loam)
Measured
0.1 0.2 0.3 0.4 0.5 0.6 0 0.1 0.2 0.3 0.4 0.5 0.6 101
Volume Wetness (cm-3·cm3) Volume Wetness (cm-3·cm3)
0.2 0.3 0.4 0.5 Volume Wetness (cm-3·cm3)
102
103
104
105
100
Campbell Brooks-Corey
van Genuchten Hutson-Cass
101
102
103
104
105
100
101
102
103
104
105
100
|Matric s
uction he
ad| (cm)
Figure 4. Estimation of soil water retention curves by van Genuchten, Brooks-Corey, Campbell and Hutson-cass models compared with measured values at three sites.
7
Bragantia, Campinas, Ahead of print, 2019
Soil water retention functions
Brooks-Corey with MAE 0.016, E’ 0.808and d’ 0.902 with almost similar statistical results could estimate SWRC better than the other models at site B (Loam soil). For Clay loam soil (site C), all models showed similar estimation of SWRC.
In overall, the van Genuchten model appeared to be slightly better for estimation of soil water retention curve at the three studied sites. Brooks-Corey had close performances to van Genuchten in this study.
The van Genuchten model is a popular model for SWRC estimation, this model is able to estimate S-shaped of SWRC and predicting retention curve in the suction below air entry point, while the Campbell model could not estimate SWRC below air entry head, but this model
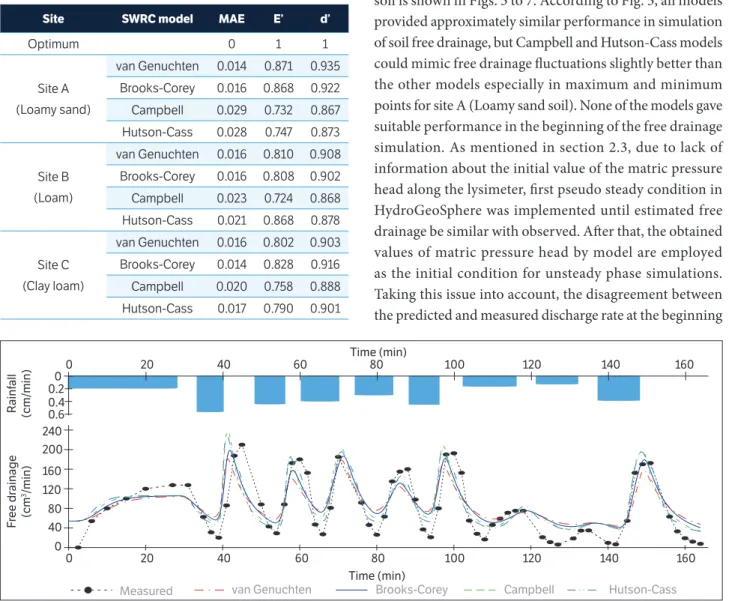
Table 3. Statistical criteria for comparing estimated SWRC by models with measured values.
Site SWRC model MAE E’ d’
Optimum 0 1 1
Site A
(Loamy sand)
van Genuchten 0.014 0.871 0.935
Brooks-Corey 0.016 0.868 0.922
Campbell 0.029 0.732 0.867
Hutson-Cass 0.028 0.747 0.873
Site B
(Loam)
van Genuchten 0.016 0.810 0.908
Brooks-Corey 0.016 0.808 0.902
Campbell 0.023 0.724 0.868
Hutson-Cass 0.021 0.868 0.878
Site C
(Clay loam)
van Genuchten 0.016 0.802 0.903
Brooks-Corey 0.014 0.828 0.916
Campbell 0.020 0.758 0.888
Hutson-Cass 0.017 0.790 0.901
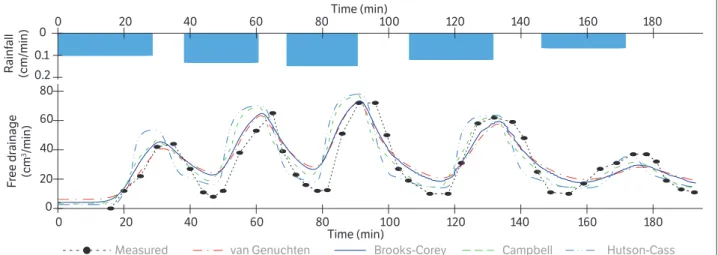
Figure 5. Rainfall intensity and observed and simulated free drainage by HydroGeoSphere using van Genuchten, Brooks-Corey, Campbell and Hutson-Cass models in site A (Loamy sand soil).
Measured van Genuchten Brooks-Corey Campbell Hutson-Cass
40 80 120 160 240 200
0
F
ree dr
ainage
(cm
3/min)
0.4 0.2 0
0 20
Time (min)
Time (min)
40 60 80 100 120 140 160
0 20 40 60 80 100 120 140 160
0.6
R
ainf
all
(cm/
min)
did not offer very impressive superiority compared with the other models (Fig. 4 and Table 3).
Compartion of the SWRC models to simulate soil free drainage
of simulation indicated weak performance of model in the pseudo steady state condition.
Quantitative results of soil profile drainage simulation with three statistical criteria (MAE, E’ and d’) for studied soil were calculated and presented in Table 4. Among four SWRC models, Hutson-Cass model with MAE, E’ and d’ 22.78, 0.55 and 0.75, respectively, had better simulation of free drainage than the other models for Loamy sand soil. Brooks-Corey and Campbell, with slight differences, are located in the next ranks, respectively, and van Genuchten with MAE, E’ and d’ of 32.51, 0.36 and 0.57, respectively, is in last rank. These results are in contrast with the results of SWRC simulations for site A, that van Genuchten was the best SWRC model in simulation of soil water retention curve.
Figure 6 illustrate the observed and estimated free drainage based on studied SWRC models, for site B (Loam
soil). As one can be seen in Fig. 6, Hutson-Cass model and somewhat Campbell model tended to overestimate the maximum discharge point and the entire SWRC models tended to underestimate minimum discharge point. But in the simulation of the minimum points of discharge rate, Campbell and Hutson-Cass provided better predictions. It is visually difficult to compare the quality of the simulated free drainage using various SWRC models in Fig. 6. Therefore, statistical criteria were calculated to compare the quality of SWRC models (Table 4). According to Table 4, Brooks-Corey and Campbell models, with slightly differences in MAE (8.43 versus 8.67), E’ (0.49 versus 0.47) and the same d’ indicated better results. After these two models, van Genuchten and Hutson-Cass were in subsequent positions. Result of free drainage simulation in this soil like Loamy sand soil (site A) is in contrast
Measured van Genuchten Brooks-Corey Campbell Hutson-Cass
20 40 60 80
0
F
ree dr
ainage
(cm
3/min)
0.1 0.2 0
Time (min)
Time (min)
0 20 40 60 80 100 120 140 160 180
0 20 40 60 80 100 120 140 160 180
R
ainf
all
(cm/
min)
0 50
Time (min)
100 150 200 250 300 350 400
0.4
0.6
5 10 20
15
F
ree dr
ainage
(cm
3/min)
Time (min)
0 20 40 60 80 100 120 140 160
R
ainf
all
(cm/
min)
Measured van Genuchten Brooks-Corey Campbell Hutson-Cass
Figure 6. Rainfall intensity and observed and simulated free drainage by HydroGeoSphere using van Genuchten, Brooks-Corey, Campbell and Hutson-Cass models in site B (Loam soil).
9
Bragantia, Campinas, Ahead of print, 2019
Soil water retention functions
with the result of SWRC simulation. The van Genuchten model performed better estimation of SWRC for Loam soil while this model wasn’t better than the other models for simulation of free drainage.
At site C (Clay loam soil), the observed and simulated free drainage is presented in Fig. 7. In this site, none of the models could exhibit a good match with observed free drainage as well as the sites A and B. However, the van Genuchten model tended to overestimate free drainage in peak points, but it could mimic fluctuations in minimum point of free drainage better than the other models. According to Fig. 7, simulated free drainage using Campbell, Brooks-Corey and Hutson-Cass models indicated a lag time compared to observed free drainage in maximum and minimum points. The van Genuchten model with MAE 1.71, E’ 0.38 and d’ 0.68 showed the best performance of the free drainage simulation in Clay loam. Campbell and Hutson-Cass models showed same results and were placed after Brooks-Corey model (Table 4).
conditions derived from steady state stage didn’t show good agreement with real condition for all sites.
T - test
The MAE, E’ and d’ values for comparing measured and estimated of SWRC as well as free drainage were presented in Tables 3 and 4, respectively. Comparing the MAE, E’ and d’ values in both tables, it is clear that the differences between estimated and measured SWRC and free drainage are often not striking. Therefore, besides the MAE, E’ and d’,as well as visual interpretation for comparing the estimated and measured SWRC and free drainage, we also used paired t-test. T-values of paired t-test to comparison of estimated soil water retention curve (SWRC) and free drainage with the measurement are shown in Tables 5 and 6, respectively. It was found that measured and estimated SWRC using various models were not significantly different in all studied soils, implying that the same experimental water retention data were fitted to the different SWRC models. Estimated SWRCs using the models were not significantly different for site A (Loamy sand soil) and site B (Loam soil) while it differed significantly for site C (Clay loam soil). Note that estimated SWRCs using Campbell and Hutson-Cass models were not significantly different (Table 5).
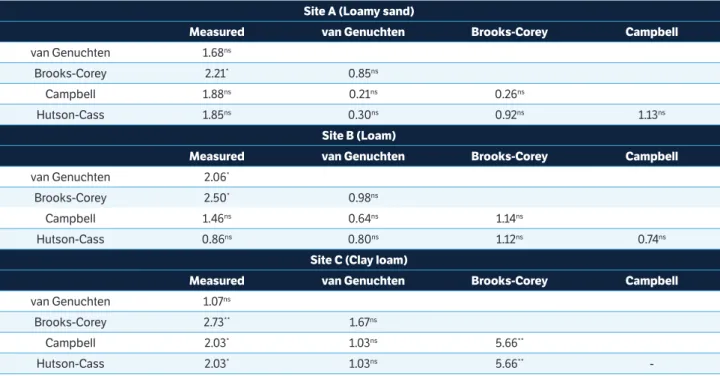
Results of t-test show that in Loamy sand soil (site A), the simulated free drainage using only Brooks-Corey model differed significantly with the measured free drainage (p ≤ 0.05), while simulated free drainage using the van Genuchten, Campbell and Hutson-Cass models did not differ significantly with measured free drainage. In Loam soil (site B), the simulated free drainage using the van Genuchten and Brooks-Corey models differed significantly (p ≤ 0.05) and the other models did not differ significantly with measured free drainage. But in Clay loam soil (site C), simulated free drainage using the van Genuchten model was not significantly different with measurements, while applying the three other models showed significant difference with measured values. Furthermore, the t-test results indicated that simulated free drainages using various SWRC models did not differ with each other in Loamy sand and Loam (sites A and B) while in the Clay loam soil (site C), only simulated free drainage by van Genuchten model did not differ with others simulated free drainages (Table 6).
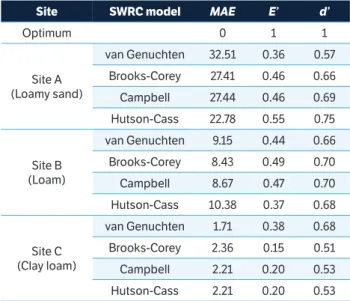
Table 4. Results of statistical criteria for simulation of free drainage by HydroGeoSphere using various SWRC models.
Site SWRC model MAE E’ d’
Optimum 0 1 1
Site A (Loamy sand)
van Genuchten 32.51 0.36 0.57
Brooks-Corey 27.41 0.46 0.66
Campbell 27.44 0.46 0.69
Hutson-Cass 22.78 0.55 0.75
Site B (Loam)
van Genuchten 9.15 0.44 0.66
Brooks-Corey 8.43 0.49 0.70
Campbell 8.67 0.47 0.70
Hutson-Cass 10.38 0.37 0.68
Site C (Clay loam)
van Genuchten 1.71 0.38 0.68
Brooks-Corey 2.36 0.15 0.51
Campbell 2.21 0.20 0.53
Hutson-Cass 2.21 0.20 0.53
CONCLUSION
In this study the performance of various SWRC models to estimate soil water retention curve was examined. In
Table 5. T-value of paired t-test for comparing the measured and estimated SWRC by various models.
Site A(Loamy sand)
Measured van Genuchten Brooks-Corey Campbell
van Genuchten 0.27ns
Brooks-Corey 0.10ns 0.46ns
Campbell 0.80ns 0.60ns 0.82ns
Hutson-Cass 0.03ns 0.22ns 0.09ns 1.00ns
Site B(Loam)
Measured van Genuchten Brooks-Corey Campbell
van Genuchten 0.72ns
Brooks-Corey 0.48ns 1.35ns
Campbell 0.04ns 0.57ns 0.39ns
Hutson-Cass 0.30ns 0.68ns 0.37ns
-Site C(Clay loam)
Measured van Genuchten Brooks-Corey Campbell
van Genuchten 0.29ns
Brooks-Corey 1.02ns 4.41**
Campbell 1.46ns 2.47* 7.37**
Hutson-Cass 1.54ns 2.50* 8.15** 1.00ns
ns = non-significant; * = significant (p ≤ 0.05); and ** = significant difference (p ≤ 0.01).
Table 6. T-value of paired t-test for comparing the measured and simulated free drainage by HydroGeoSphere using various SWRC models.
Site A(Loamy sand)
Measured van Genuchten Brooks-Corey Campbell
van Genuchten 1.68ns
Brooks-Corey 2.21* 0.85ns
Campbell 1.88ns 0.21ns 0.26ns
Hutson-Cass 1.85ns 0.30ns 0.92ns 1.13ns
Site B(Loam)
Measured van Genuchten Brooks-Corey Campbell
van Genuchten 2.06*
Brooks-Corey 2.50* 0.98ns
Campbell 1.46ns 0.64ns 1.14ns
Hutson-Cass 0.86ns 0.80ns 1.12ns 0.74ns
Site C(Clay loam)
Measured van Genuchten Brooks-Corey Campbell
van Genuchten 1.07ns
Brooks-Corey 2.73** 1.67ns
Campbell 2.03* 1.03ns 5.66**
Hutson-Cass 2.03* 1.03ns 5.66**
-ns = non-significant; * = significant (p ≤ 0.05); and ** = significant difference (p ≤ 0.01).
11
Bragantia, Campinas, Ahead of print, 2019
Soil water retention functions
In spite of the superiority of van Genuchten and Brooks-Corey models for estimating SWRC which showed by three mentioned statistical criteria (MAE, E’, d’), t-test shows that the measured and estimated of SWRC using the studied models did not diff er signifi cantly for all sites, implying that the experimental water retention data were fi tted the same to the diff erent SWRC models.
Considering the fact that estimated SWRC by various models did not diff er signifi cantly with measured value, it was expected that the simulated free drainage by HydroGeoSphere code using these model as an input data did not diff er signifi cantly too, but it was found that the simulated free drainage using Brooks-Corey model for Loamy sand soil (site A) and van Genuchten and Brooks-Corey models for Loam soil (site B) diff ered signifi cantly with measured values (p ≤ 0.05). In Clay loam soil (site C), according to t-test, the SWRC estimated by van Genuchten model diff ers with SWRC estimated by Brooks-Corey (p ≤ 0.05), Campbell (p ≤ 0.01) and Hutson-Cass (p ≤ 0.01) models, while the simulated free drainage by applying van Genuchten model did not diff er with the simulated free drainage using Brooks-Corey, Campbell and Hutson-Cass models.
Th e results of this study demonstrated that the SWRC models may be fi tted well to the laboratory-measured SWRC but it is not able to simulate soil free drainage by applying these models in numerical codes such as HydroGeoSphere. It can be concluded that only the quality of the SWRC models in estimating soil water retention curve could not be a proper criteria for performance of these models in simulation of water fl ow in soil by numerical code. It may be justifi ed by considering hysteresis phenomena and presumably weakness performance of unsaturated hydraulic conductivity models.
It is noticeable that water movement in soil usually occurs in high moisture content and, by looking at Fig. 4, it can be seen that in low matric suction head (high moisture
content), there are diff erences between predicted soil water retention curves by various SWRC models. Th is can explain mismatching in simulations of free drainage.
Another founding of this study was that superiority of SWRC models for simulation of free drainage according to statistical criteria (MAE, E’ and d’) is not in line with t-test in some cases. As based on MAE, E’ and d’, the simulated free drainage using Brooks-Corey along with HydroGeoSphere code could mimic measured value better than van Genuchten model in site A (Table 4), while according to t-test, performance of van Genuchten model in simulation of free drainage along with HydroGeoSphere code was not signifi cantly diff erent with measured value, but applying the Brooks-Corey model showed signifi cantly diff erent (p ≤ 0.05) with measured values in site A (Table 6). It should be noted that this conclusion is creditable for these soils and the criteria used in this particular study.
ACKNOWLEDGEMENTS
The authors would like to thank the University of Mohaghegh Ardabili for funding the study (Grant No. 51/325). Th e authors also are grateful to the Department of Earth Sciences, University of Waterloo, for access rights and permission to use the HydroGeoSphere code.
ORCID IDs
F. Z. Abkenar
https://orcid.org/0000-0001-9637-4610 A. Rasoulzadeh
https://orcid.org/0000-0001-7838-6773 A. Asghari
https://orcid.org/0000-0003-3072-5857
REFERENCES
Assouline, S., Tessier, D. and Bruand, A. (1998). A conceptual model
of the soil water retention curve. Water Resources Research, 34,
223-231. htt ps://doi.org/10.1029/97WR03039
Brooks, R. H. and Corey, A. T. (1964). Hydraulic properties of
porous media. Hydrological paper, 3, 27.
Campbell, G. S. (1974). A simple method for determining unsaturated
conductivity from moisture retention data. Soil Science, 117,
311-314.
Dane, J. H. and Topp, G. C. (2002). Methods of soil analysis: part
Gimenz, D., Rawls, W. J., Pachepsky, Y. and Watt, J. P. C. (2001).
Prediction of a pore distribution factor from soil textural and
mechanical parameters. Soil Science, 166, 79-88.
Hutson, J. L. and Cass, A. (1987). A retentivity function for use in
soil water simulation models. European Journal of Soil Science,
38, 105-113. https://doi.org/10.1111/j.1365-2389.1987.tb02128.x
Legates, D. R. and McCabe Jr., G. J. (1999). Evaluating the use
of “goodness-of-fit” measures in hydrologic and hydroclimatic
model validation. Water Resources Research, 35, 233-241. https://
doi.org/10.1029/1998WR900018
Manyame, C., Morgan, C. L., Heilman, J. L., Fatondji, D., Gerad, B.
and Payne, W. A. (2007). Modeling hydraulic properties of sandy
soils of Niger using pedotransfer functions. Geoderma, 141,
407-415. https://doi.org/10.1016/j.geoderma.2007.07.006
McLaren, R. G. (2004). GRID BUILDER, a pre-processor for
2-D, triangular element, finite-element programs. Groundwater
Simulation Group. Waterloo: University of Waterloo.
Mualem, Y. (1976). A new model for predicting the hydraulic
conductivity of unsaturated porous media. Water Resources
Research, 12, 513-522. https://doi.org/10.1029/WR012i003p00513
Nimmo, J. R. (1991). Comment on the treatment of a residual
water content in a “A consistent set of parametric model for
the two-phase flow of immiscible fluids in the subsurface by L.
Luckner et al. Water Resources Research, 27, 661-662. https://
doi.org/10.1029/91WR00165
Rajkai, K., Kabos, S. and van Genuchten, M. Th. (2004). Estimating
the water retention curve from soil properties: comparison of linear,
nonlinear and concomitant variable methods. Soil and Tillage
Research, 79, 145-152. https://doi.org/10.1016/j.still.2004.07.003
Rasoulzadeh, A. (2010). Evaluation of water retention functions
by developing a code for quantifying the hydraulic functions of
unsaturated soils. Journal of Food, Agriculture & Environment,
8, 1180-1184.
Rasoulzadeh, A. and Ghoorabjiri, M. H. (2011).Estimation
of hydraulic properties of forest floor using inverse method.
International Agricultural Engineering Journal, 20, 146-152.
Rasoulzadeh, A. and Ghoorabjiri, M. H. (2014). Comparing hydraulic
properties of different forest floors. Hydrological Processes, 28,
5122-5130. https://doi.org/10.1002/hyp.10006
Ross, P. J., Williams, J. and Bristow, K. L. (1991). Equations for
extending water retention curves to dryness. Soil Science
Society of America Journal, 55, 923-927. https://doi.org/10.2136/
sssaj1991.03615995005500040004x
Therrien, R., McLaren, R. G. and Sudicky, E. A. (2008).
HydroGeoSphere: a three-dimensional model describing
fully-integrated subsurface and surface flow and solute transport.
Waterloo: University of Waterloo.
van Genuchten, M. Th. (1980). A closed-form equation for
predicting the hydraulic conductivity of unsaturated soils. Soil
Science Society of America Journal, 44, 892-898.
van Genuchten, M. Th., Simunek, J., Leij, F. J. and Sejna, M. (2000).
The RETC code for quantifying the hydraulic functions of the
unsaturated soils. USDA, ARS: US Salinity Laboratory.
Williams. R. D., Ahuja, L. R. and Naney, J. W. (1992). Comparisons
of methods to estimate soil water characteristics from soil particle
size distribution, bulk density and limited data. Soil Science,
153, 172-184.
Wösten, J. H. M., Finke, P. A. and Jansen, M. J. W. (1995). Comparison
of class and continuous pedotransfer functions to generate soil
hydraulic characteristics. Geoderma, 66, 227-237. https://doi.