Transcriptome Profiling of Pediatric Core
Binding Factor AML
Chih-Hao Hsu1, Cu Nguyen1, Chunhua Yan1, Rhonda E. Ries2, Qing-Rong Chen1, Ying Hu1, Fabiana Ostronoff2, Derek L. Stirewalt2, George Komatsoulis1, Shawn Levy3, Daoud Meerzaman1☯, Soheil Meshinchi2☯*
1Center for Biomedical Informatics and Information Technology, National Cancer Institute, Rockville, MD, 20850, United States of America,2Fred Hutchinson Cancer Research Center, Seattle, WA, United States of America,3Hudson Alpha Institute for Biotechnology, Huntsville, AL, United States of America
☯These authors contributed equally to this work. *[email protected]
Abstract
The t(8;21) and Inv(16) translocations disrupt the normal function of core binding factors alpha (CBFA) and beta (CBFB), respectively. These translocations represent two of the most com-mon genomic abnormalities in acute myeloid leukemia (AML) patients, occurring in approxi-mately 25% pediatric and 15% of adult with this malignancy. Both translocations are
associated with favorable clinical outcomes after intensive chemotherapy, and given the per-ceived mechanistic similarities, patients with these translocations are frequently referred to as having CBF-AML. It remains uncertain as to whether, collectively, these translocations are mechanistically the same or impact different pathways in subtle ways that have both biological and clinical significance. Therefore, we used transcriptome sequencing (RNA-seq) to investi-gate the similarities and differences in genes and pathways between these subtypes of pediat-ric AMLs. Diagnostic RNA from patients with t(8;21) (N = 17), Inv(16) (N = 14), and normal karyotype (NK, N = 33) were subjected to RNA-seq. Analyses compared the transcriptomes across these three cytogenetic subtypes, using the NK cohort as the control. A total of 1291 genes in t(8;21) and 474 genes in Inv(16) were differentially expressed relative to the NK con-trols, with 198 genes differentially expressed in both subtypes. The majority of these genes (175/198; binomial testp-value<10−30) are consistent in expression changes among the two subtypes suggesting the expression profiles are more similar between the CBF cohorts than in the NK cohort. Our analysis also revealed alternative splicing events (ASEs) differentially expressed across subtypes, with 337 t(8;21)-specific and 407 Inv(16)-specific ASEs detected, the majority of which were acetylated proteins (p = 1.5x10-51and p = 1.8x10-54for the two
sub-sets). In addition to known fusions, we identified and verified 16de novofusions in 43 patients, including three fusions involvingNUP98in six patients. Clustering of differentially expressed genes indicated that the homeobox (HOX) gene family, including two transcription factors (MEIS1andNKX2-3) were down-regulated in CBF compared to NK samples. This finding sup-ports existing data that the dysregulation ofHOXgenes play a central role in biology CBF-AML hematopoiesis. These data provide comprehensive transcriptome profiling of CBF-AML and delineate genes and pathways that are differentially expressed, providing insights into the shared biology as well as differences in the two CBF subsets.
OPEN ACCESS
Citation:Hsu C-H, Nguyen C, Yan C, Ries RE, Chen Q-R, Hu Y, et al. (2015) Transcriptome Profiling of Pediatric Core Binding Factor AML. PLoS ONE 10(9): e0138782. doi:10.1371/journal.pone.0138782
Editor:Ken Mills, Queen's University Belfast, UNITED KINGDOM
Received:June 15, 2015
Accepted:September 3, 2015
Published:September 23, 2015
Copyright:This is an open access article, free of all copyright, and may be freely reproduced, distributed, transmitted, modified, built upon, or otherwise used by anyone for any lawful purpose. The work is made available under theCreative Commons CC0public domain dedication.
Data Availability Statement:All BAM files have been deposited at The database of Genotypes and Phenotypes (dbGaP,http://www.ncbi.nlm.nih.gov/gap) under substudy, phs000465.v10.p3, TARGET: Acute Myeloid Leukemia (AML).
Funding:This work was funded by a grant from the National Cancer Institute, NCI 5 R01 CA114563-08 (www.nih.gov) and a Scientific Leadership NIH National Clinical Trials Network (NCTN) Grant (U10CA180886).
shifts in the genomic abnormalities of AML, some of which [2,3] may contribute to differential outcomes observed in adult vs. pediatric AML[4]. Although these previous studies have helped us to better understand the correlation between genotypes and phenotypes in AML, a more detailed examination of defined molecular subgroups may yield another level of understanding, which is not readily attainable by examining more molecular diverse AML populations.
Cytogenetic alterations have been shown to play a critical role in the diagnosis of AML[1]. Fusions involvingRUNX1-RUNX1T1andCBFB-MYH11, collectively referred to as core bind-ing factor (CBF) AML, are one of the most frequent and most-studied genomic events in AML [5,6]. Despite extensive studies into the biologic implications of these fusion transcripts and their use for risk stratification,[7,8] knowledge of the presence of these fusions has not led to new targeted interventions. Further, despite the fact that t(8;21) and Inv(16) implicate CBFA and CBFB, respectively, and lead to similar clinical outcomes, potential mechanistic similarities and differences remain to be well defined.
RNA-seq for whole-transcriptome sequencing has become a powerful approach for study-ing mRNA transcripts[9,10]. In contrast to traditional microarray methods, RNA-seq can identifyde novotranscripts that are not represented in the reference genome (i.e., fusion genes) [11] while quantifying previously described reference transcripts[12] and identifying splicing alterations[13]. Recently, several adult AML studies using NGS technologies have been reported. The Cancer Genome Atlas (TCGA) Research Network[14] revealed the genomic and epigenetic landscapes of 200 adultde novoAML patients using whole-genome, whole-exome, RNA, and microRNA sequencing, along with DNA methylation studies. In addition, MacRae et al.[15] used RNA-seq to analyze 55 adult leukemia samples, identifying 119 genes whose expression is more consistent than the commonly used control genes across those leukemia samples. Lilljebjorn et al. [16] also used RNA-seq to identify fusion genes in adult leukemia patients. In contrast, the study of the pathogenesis of pediatric AML using NGS technologies is still in its earliest stages, and large studies have not extensively evaluated CBF-AML patients using this technology.
In this report, we use whole-transcriptome sequencing to interrogate the transcript profiles for pediatric CBF-AML, comparing these to transcripts from cases with normal karyotype. The results reveal that t(8;21) and Inv(16) translocations aberrantly impact a set of common genes and molecular pathways and there are unique gene-expression signatures, splicing differences, and fusions observed in the CBF subtype.
Results
Patient characteristics
FLT3/ITD Mutation (N = 14 and 19, respectively). Baseline characteristics of the patients are shown inS1 Table.
RNA sequencing in pediatric AML samples
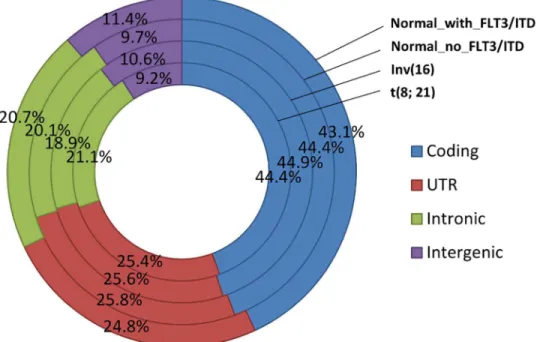
RNA sequencing was performed using the Illumina platform for all 64 samples, with an aver-age of 47 million (27,576,734–91,175,150) reads per sample. Ninety-six percent of these reads were mapped to the human reference sequence (hg19/NCBI Build 37) using the next-genera-tion sequencing (NGS) aligner Novoalign (www.novocraft.com); ~26,000 RefSeq genes were covered by at least one read and ~16,500 RefSeq genes had RPKM (Reads Per Kilobase per Mil-lion mapped reads)1 (S2 Table). Ninety percent of these mapped reads were located within gene regions, including coding, UTR, and intronic regions, and the distribution was very simi-lar among different cytogenetic abnormalities (Fig 1).
Identification of differentially expressed genes by RNA sequencing
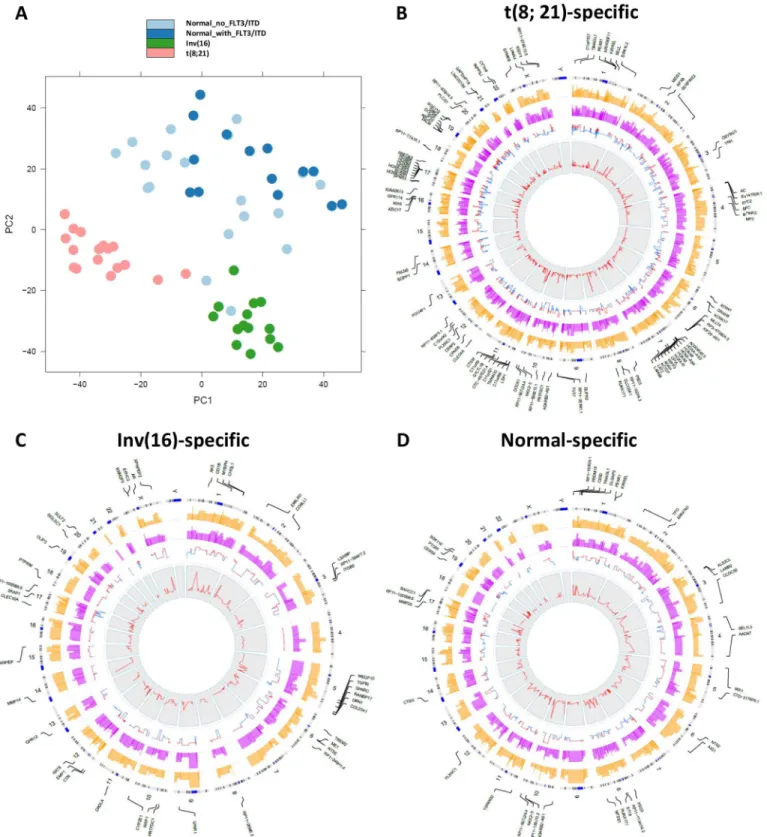
In order to determine differential gene expression patterns specific to different cytogenetic cat-egories, we performed principal component analysis (PCA) (Fig 2A). The PCA using all genes successfully separated out expression profiles for samples with Inv(16), t(8;21), or NK into three distinct clusters, suggesting that cytogenetic abnormalities profoundly affected gene-expression patterns. Two patients with NK had gene-expression profiles that clustered with those with Inv(16). Closer examination of the two cases demonstrated the presence ofCBFB-MYH11 through fluorescence in situ hybridization (FISH) in 22% of the studied metaphases in one case. However, the second case did not showCBFB-MYH11fusions through FISH or real-time polymerase chain reaction (RT-PCR). The only fusion event shared by these two cases was the intergenic fusionNDRG1-ST3GAL1, which was also found in one t(8;21) sample and in one Inv(16) sample, but not in other NK samples.Fig 1. Distribution of aligned reads in the human genome (hg19).
Fig 2. Differentially expressed genes characterize different cytogenetic abnormalities.(A) Principal component analysis for samples with different cytogenetic abnormalities. (B-D) Circular plots were drawn with the in-house software application OmicCircos[18] to represent the t(8;21)-specific, Inv(16)-specific, and normal-specific differentially expressed genes. The track from outside to inside are the symbols of differentially expressed genes with high significance (p-value<1.0E-08); genome positions by chromosomes (black lines are cytobands); average expression level for the samples with specific
cytogenetic abnormalities (yellow); average expression level for the remaining samples (pink); fold change (red: up-regulated; blue: down-regulated); and the p-values associated with the expression patterns between one subtype and the remaining samples.
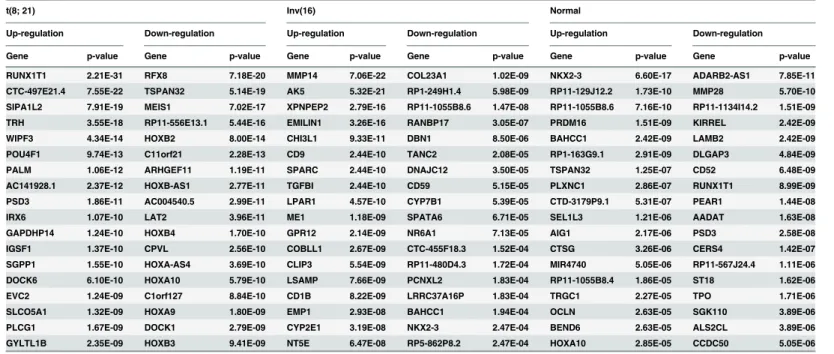
To identify differentially expressed genes specific to each of the cytogenetic cohorts, we per-formed differential expression analysis using DESeq package[17], which uses a model based on the negative binomial distribution with variance and mean linked by local regression. Compar-ing t(8;21) samples with the remainCompar-ing samples, a total of 827 t(8;21)-specific genes were found to be differentially expressed with an adjustedp-value (multiple testing using the Benjamini-Hochberg method) of less than 0.05 (Fig 2B). Among these, 365 genes were up-regulated, with theRUNX1T1gene most significantly up-regulated (p = 2.21x10⁻³¹;Table 1). RNA-seq reads were uniquely mapped into the entire coding regions ofRUNX1T1for the 17 samples with t (8;21), with very few reads mapping to this gene in patients with Inv(16) or NK (S1 Fig). Addi-tionally, 462 genes were down-regulated in samples with t(8;21), with theRFX8gene being the most under-expressed (p = 7.18 x 10⁻²⁰). Eight of the top 20 under-expressed genes belonged
to theHOXfamily (Table 1).
Similarly, AML samples with Inv(16) displayed 279 genes that were differentially expressed as compared to the remaining samples, with 181 of these genes up-regulated and 98 down-reg-ulated at the adjustedp-value of 0.05 (Fig 2C). Matrix metallopeptidase 14 (membrane-inserted) (MMP14) mRNA was most significantly up-regulated (p = 7x10-22). Conversely, col-lagen type XXIII, alpha 1 (COL23A1) mRNA was the most significantly down-regulated. Three hundred and eighty normal-specific genes were also found (Fig 2D), indicating a widespread presence of differentially expressed genes among different cytogenetic abnormalities.
RUNX1
binding sites were enriched in differentially expressed genes
RUNX1has shown to play a crucial role in haematopoiesis during embryonic development [18] and the two subunits of the core binding factors (CBFs), i.e., CBFA and CBFB, have been suggested to modify the transcriptional regulator functions of AML by either altering the nor-malRUNX1transcription program, interfering with theRUNX1assembly, or recruiting his-tone deacetylases and inhibiting theRUNX1activity [19–21]. To study the expression of the RUNX1targeted genes in the three cytogenetic categories,RUNX1ChIP-Seq data in the ME-1Table 1. Most significantly up- and down-regulated genes in the three cytogenetic categories.
t(8; 21) Inv(16) Normal
Up-regulation Down-regulation Up-regulation Down-regulation Up-regulation Down-regulation
Gene p-value Gene p-value Gene p-value Gene p-value Gene p-value Gene p-value
RUNX1T1 2.21E-31 RFX8 7.18E-20 MMP14 7.06E-22 COL23A1 1.02E-09 NKX2-3 6.60E-17 ADARB2-AS1 7.85E-11
CTC-497E21.4 7.55E-22 TSPAN32 5.14E-19 AK5 5.32E-21 RP1-249H1.4 5.98E-09 RP11-129J12.2 1.73E-10 MMP28 5.70E-10 SIPA1L2 7.91E-19 MEIS1 7.02E-17 XPNPEP2 2.79E-16 RP11-1055B8.6 1.47E-08 RP11-1055B8.6 7.16E-10 RP11-1134I14.2 1.51E-09
TRH 3.55E-18 RP11-556E13.1 5.44E-16 EMILIN1 3.26E-16 RANBP17 3.05E-07 PRDM16 1.51E-09 KIRREL 2.42E-09
WIPF3 4.34E-14 HOXB2 8.00E-14 CHI3L1 9.33E-11 DBN1 8.50E-06 BAHCC1 2.42E-09 LAMB2 2.42E-09
POU4F1 9.74E-13 C11orf21 2.28E-13 CD9 2.44E-10 TANC2 2.08E-05 RP1-163G9.1 2.91E-09 DLGAP3 4.84E-09 PALM 1.06E-12 ARHGEF11 1.19E-11 SPARC 2.44E-10 DNAJC12 3.50E-05 TSPAN32 1.25E-07 CD52 6.48E-09
AC141928.1 2.37E-12 HOXB-AS1 2.77E-11 TGFBI 2.44E-10 CD59 5.15E-05 PLXNC1 2.86E-07 RUNX1T1 8.99E-09
PSD3 1.86E-11 AC004540.5 2.99E-11 LPAR1 4.57E-10 CYP7B1 5.39E-05 CTD-3179P9.1 5.31E-07 PEAR1 1.44E-08 IRX6 1.07E-10 LAT2 3.96E-11 ME1 1.18E-09 SPATA6 6.71E-05 SEL1L3 1.21E-06 AADAT 1.63E-08
GAPDHP14 1.24E-10 HOXB4 1.70E-10 GPR12 2.14E-09 NR6A1 7.13E-05 AIG1 2.17E-06 PSD3 2.58E-08
IGSF1 1.37E-10 CPVL 2.56E-10 COBLL1 2.67E-09 CTC-455F18.3 1.52E-04 CTSG 3.26E-06 CERS4 1.42E-07
SGPP1 1.55E-10 HOXA-AS4 3.69E-10 CLIP3 5.54E-09 RP11-480D4.3 1.72E-04 MIR4740 5.05E-06 RP11-567J24.4 1.11E-06 DOCK6 6.10E-10 HOXA10 5.79E-10 LSAMP 7.66E-09 PCNXL2 1.83E-04 RP11-1055B8.4 1.86E-05 ST18 1.62E-06
EVC2 1.24E-09 C1orf127 8.84E-10 CD1B 8.22E-09 LRRC37A16P 1.83E-04 TRGC1 2.27E-05 TPO 1.71E-06
SLCO5A1 1.32E-09 HOXA9 1.80E-09 EMP1 2.93E-08 BAHCC1 1.94E-04 OCLN 2.63E-05 SGK110 3.89E-06
PLCG1 1.67E-09 DOCK1 2.79E-09 CYP2E1 3.19E-08 NKX2-3 2.47E-04 BEND6 2.63E-05 ALS2CL 3.89E-06 GYLTL1B 2.35E-09 HOXB3 9.41E-09 NT5E 6.47E-08 RP5-862P8.2 2.47E-04 HOXA10 2.85E-05 CCDC50 5.05E-06
cell line were analyzed [19](GEO accession number GSE46044). 34,654 peaks were identified using HOMER ChIP-Seq analysis package (http://homer.salk.edu/) and 11,844 out of 20,805 (56.9%) ensemble coding genes (GRCh37) were targeted by these ChIP-Seq peaks. Compared with the differentially expressed genes in the three cytogenetic categories, 72.8% of differen-tially expressed genes in the t(8;21) samples; 73.8% of differendifferen-tially expressed genes in the Inv (16) samples and 69.0% of differentially expressed genes in the normal samples were targeted by these ChIP-Seq peaks. There is significant enrichment for theRUNX1binding sites in the differentially expressed genes in these three cytogenetic categories (Binomial test p-value is 2.1E-17, 7.1E-08 and 2.1E-05 respectively;S3 Table).
Genes commonly expressed in CBF AML
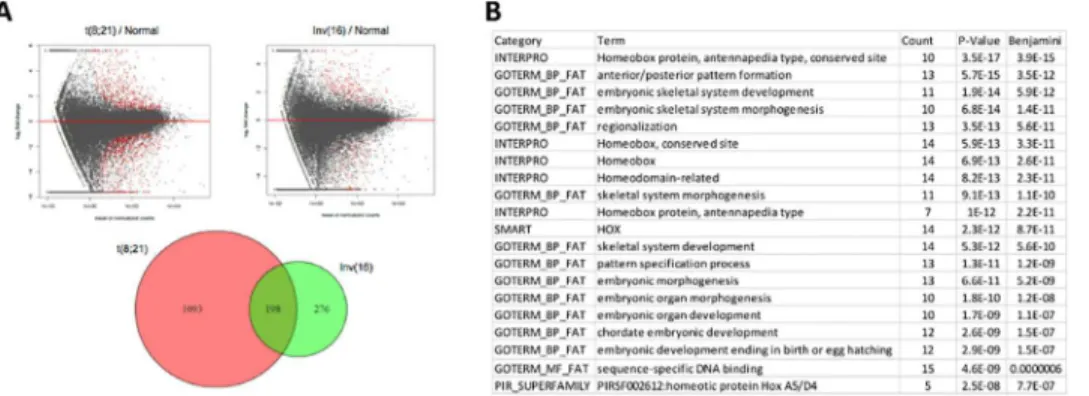
Because those cases referred to collectively as CBF AML share a common biology, clinical pre-sentation, and outcome, we inquired whether the two cohorts also shared an expression profile. To this purpose, we detected differentially expressed genes in t(8;21) and Inv(16) using NK cohort as the control. Of the total of 1567 genes that are differentially expressed in all CBF AML cases [1291 in t(8;21) and 474 in Inv(16)], compared to samples with normal karyotype (NK), 198 differentially expressed genes are shared by the two subtypes in CBF AML (Fig 3A): 87 of these genes are up-regulated, 88 are down-regulated in both subtypes (S4 Table), while another 23 genes have opposing expression profiles (down-regulated in one subtype but up-regulated in the other). More genes share expression profiles between these two subtypes (175 / 198; binomial testp-value<10−30) than do not. Furthermore, the 88 shared down-regulated
genes include manyHOXgenes and are enriched in genes involved in morphogenesis, specifi-cally embryonic skeletal system development (Fig 3B). In contrast, no gene sets are significantly enriched for the 87 shared up-regulated genes.
Expression profile in samples with normal karyotype (NK)
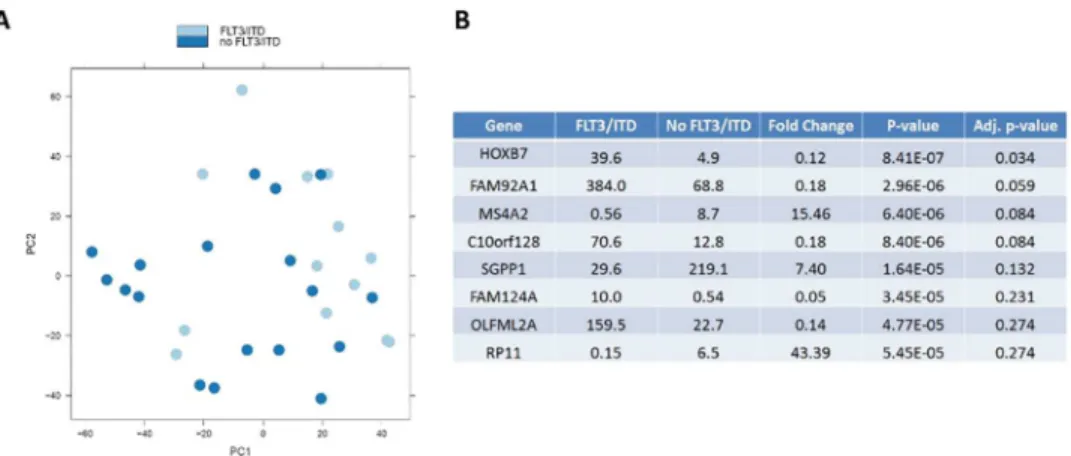
Evaluation of distinct expression profiles of those with NK from those with t(8;21) or Inv(16) identified 175 significantly up-regulated and 205 down-regulated genes. We further studied the expression profiles for those with and without FLT3/ITD mutation in the NK cohort to deter-mine whether FLT3/ITD mutation is associated with a specific expression pattern. Although the expression signature for those with NK was distinct from those with CBF AML, expression PCA failed to define a distinct expression profile for those with and without FLT3/ITD
Fig 3. Commonly expressed genes in CBF AML.(A) Differentially expressed genes (red dots in the MA plot) in t(8;21) and Inv(16) vs. those with NK. 198 genes are shared in the two subtypes. (B) Gene Set Enrichment Analysis (GSEA) shows enriched functions for shared down-regulated genes between them.
mutation (Fig 4A).HOXB7was the only gene whose expression was significantly associated with FLT3/ITD mutation (adjustedp-value 0.034) (Fig 4B) with an adjustedp-value<0.05.
Co-expressed genes define gene networks
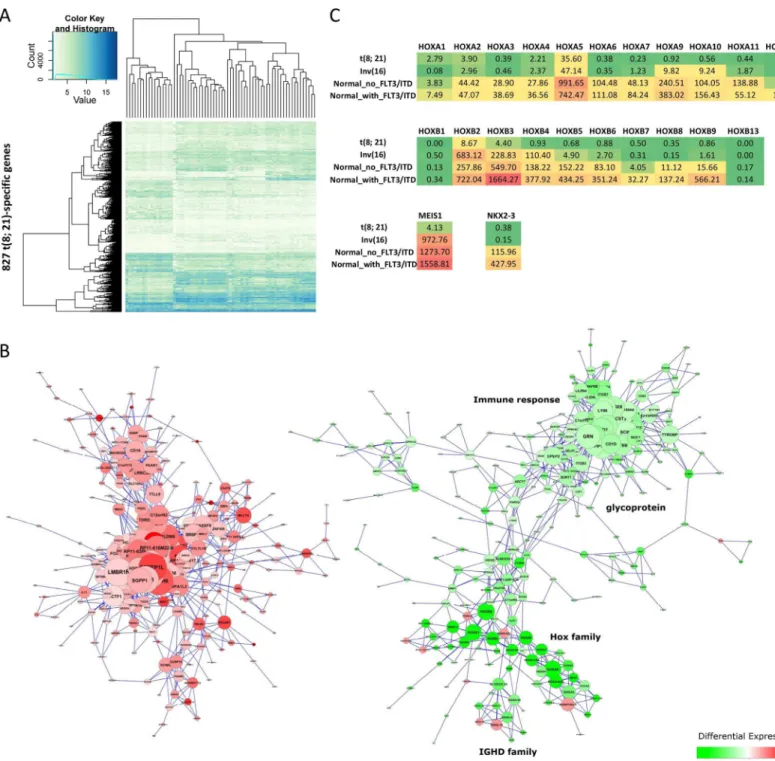
Clustering of differentially expressed genes for each cytogenetic abnormality indicates the exis-tence of co-expressed gene networks (Fig 5A,S2A and S2B Fig). To study the functionality of these networks, we calculated the correlation coefficient (R) for each pair of differentially expressed genes in each subtype and used Cytoscape[22] to identify co-expressed genes with R2
>0.6 and to determine subsets of the co-expressed gene networks with specific molecular
func-tions (Fig 5B,S2C and S2D Fig). Up-regulated genes and down-regulated genes were clustered into different groups for the t(8;21)-specific differentially expressed genes. A sub-group con-taining 39 genes, located in the group with down-regulated genes, is enriched in the
homeobox (HOX) gene family (Fig 5B). The group includes twoHOXgene clusters on human chromosomes 7p15 (HOXA) and 17q21 (HOXB), theHOXcofactor myeloid ecotropic viral integration site1(MEIS1) and theNK2homeobox 3 (NKX2-3).MEIS1is a common leukemic collaborator[23] andNKX2-3is a homeobox transcription factor[24]. All of theseHOXgenes were down-regulated in the samples with t(8;21) (Fig 5C). MostHOXgenes were also down-regulated in the samples with Inv(16) except forHOXB2,HOXB3,HOXB4andMEIS1. Fur-thermore, although samples with NK had higher expression levels in theHOXgene family, most genes in theHOXBgene cluster andNKX2-3had even higher expression levels when they contained the FLT3-ITD mutation.
Several immunoglobulin-related gene families, including the Leukocyte Immunoglobulin-like Receptor (LIR) gene family and the Immunoglobulin Heavy (IGH) gene family, were also enriched in down-regulated genes for the t(8;21) AML samples, while no molecular processes or functions were enriched in up-regulated genes for the t(8;21) AML samples.
Alternative splicing is common in AML and is affected by acetylation
In addition to evaluating differential expression patterns, we assessed alternative splicing among the three cytogenetic cohorts. We used the Multivariate Analysis of Transcript Splicing (MATS) application[25] to identify alternative splicing characteristic of samples from the cyto-genetic subtypes. MATS is a computational tool that uses a statistical model with multivariate uniform prior to detecting differential alternative splicing events using RNA sequencing data.Fig 4. Comparison of expression profiles for those with and withoutFLT3/ITD mutation.(A) PCA for the two groups. (B) Genes with the most significant adjustp-value between the two groups.
Five different alternative splicing events were detected by MATS, including skipped exon (SE), alternative 5’splice site (A5SS), alternative 3’splice site (A3SS), mutually exclusive exons (MXE), and retained intron (RI).
Fig 5. Co-expression of t(8;21)-specific genes.(A) Heatmaps showing the clustering of 827 t(8;21)-specific genes in 64 pediatric AML samples. (B) Co-expressed genes were determined based on the coefficient of determination (R2>0.6). The co-expression gene networks were generated using Cytoscape
2.8.3[19]. Node color is based on the fold change of the differentially expressed gene (red: up-regulated; green: down-regulated), and node size corresponds to the degree of the node (i.e., the number of edges incident to it). (C) Gene expression of the HOX gene family for three types of cytogenetic abnormalities, where NK is separated into two groups based on the mutation of FLT3/ITD.
In our study, 337 t(8;21)-specific, 407 Inv(16)-specific, and 272 NK-specific alternative splicing events were detected. Skipped exon (SE), mutually exclusive exons (MXE) and retained intron (RI) seemed to be the predominant alternative splicing events in pediatric AML samples (Fig 6A and 6B). Furthermore, MATS separated all alternative splicing events into inclusion or skipping groups based on whether the alternative exon was included or skipped in the samples. Samples with t(8;21) and NK tended to include the alternative exons (Fig 6A), while samples with Inv(16) were likely to skip them (Fig 6B). 216 genes were affected by t(8;21)-specific alter-native splicing events (Most significant events involving genes includingRAB10,SERF2, HNRNPC,HNRNPD,HNRPDL,HINT1,NACA,PABPC1,RPL10,RPS12,RPS27,ARPC3,EIF1, STMN1, andARPC4). 233 and 158 genes were also affected by Inv(16)-specific and normal-spe-cific alternative splicing events, respectively. Gene Set Enrichment Analysis (GSEA) indicated that the majority of the affected genes are acetylated proteins: 127 genes (59%;p-value = 1.5E-51) for t(8;21)-specific; 135 genes (58%;p-value = 1.8E-54) for Inv(16)-specific; and 98 genes (62%; p-value = 1.2E-42) for normal-specific, and are enriched in the KEGG pathwayribosome.
Identification of fusion transcripts in pediatric AML samples
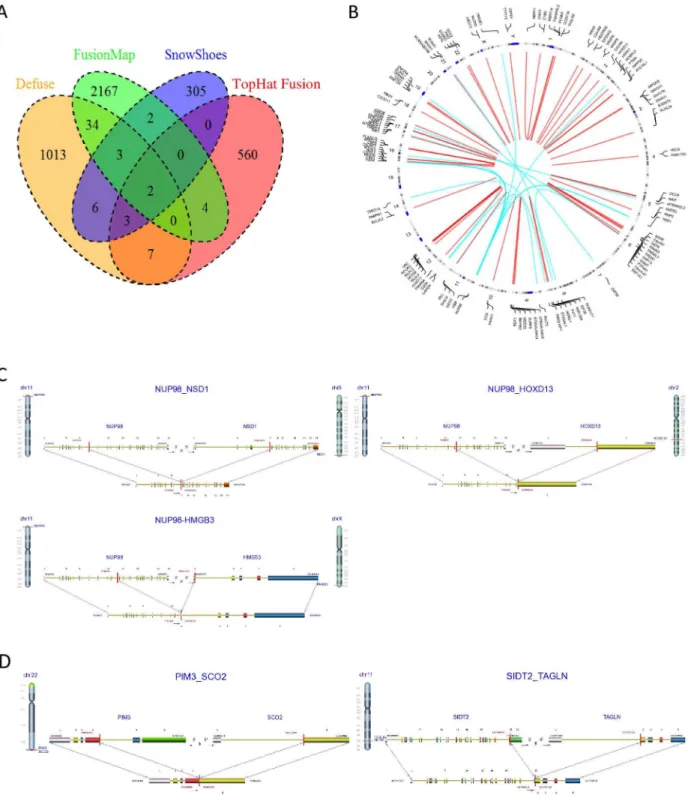
RNA sequencing has also been successfully used to identify gene-fusion events in cancers[26, 27], and many computational tools have been developed to detect these events[11,28–30]. Most detection methods, however, have proved problematic because of high false-positive rates [31,32]. We used four gene-fusion detection methods—Defuse[28], Tophat-Fusion[29], FusionMap[30] and Snowshoes-FTD[11] to identify gene-fusion events in our pediatric AML samples. The number of putative fusion events identified ranged from 300 to more than 2000 for each detection method, while only a few fusion events (2%–5%) overlapped between any two methods (Fig 7A). To reduce the high rate of false positives, only 69 putative fusion events (Fig 7B;S5 Table), identified by at least two detection methods or by one method with a Chi-merDB hit[33], were used in our study. ChimerDB is a knowledgebase of fusion genes identi-fied using bioinformatics analysis of transcript sequences based on various public resources, including GenBank, the Sanger Cancer Genome Project (CGP), OMIM, PubMed, and the Mitelman database. Fifty-one of the 69 putative fusion events (74%), were intra-chromosomal (Fig 7B), and the remaining 18 (26%) were found in inter-chromosomal junctions. Fifty-nine of the 69 identified fusions involved the coding regions of the affected gene (S4 Table). Eight putative fusion events were found in ChimerDB and six of them were previously reported in AML[34–37], suggesting that the combination of multiple gene-fusion detection methods and ChimerDB can accurately identify fusion events. TheCBFB-MYH11fusion event was identified
Fig 6. Alternative splicing for pediatric AML samples.Alternative splicing events detected by MATS for three cytogenetic abnormalities. Five different alternative splicing events were detected: skipped exon (SE), alternative 5’splice site (A5SS), alternative 3’splice site (A3SS), mutually exclusive exons (MXE) and retained intron (RI). All events were further separated into two groups based on whether the alternative exon was included (A) or skipped (B) in the samples.
in 12 out of 14 samples with clinically annotated Inv(16) (Fisher's exact test; p-value = 1.25E-11). Closer interrogation of the two cases without theCBFB-MYH11fusion event demon-strated the presence of reads consistent with the fusion transcripts, but due to their low
Fig 7. Identification of gene-fusion events in pediatric AML samples.(A) Gene-fusion events were detected using four gene fusion detection methods. (B) 69 putative fusion events shown in a circular plot. Red: intra-chromosomal fusion event; Blue: inter-chromosomal fusion event. (C) three fusion variants of NUP98. (D) Two in-frame fusions.
coverage, these cases did not meet the statistical threshold for identification. In addition, RUNX1-RUNX1T1transcript fusions were identified in all 17 samples with clinically annotated t(8;21) (Fisher's exact test; p-value = 2.23E-16), further suggesting that the identification of putative fusion events was accurate.
In addition to the known fusion transcript for the 31 patients with CBF AML
(CBFB-MYH11andRUNX1-RUNX1T1), an additional 132 fusion transcripts (for 47 fusion events) were identified, including 21 inter- and 111 intra-chromosomal translocations. In 33 patients without known karyotypic alterations (NK), a total of 126 fusion transcripts (for 53 fusion events) was detected, including 30 inter- and 96 intra-chromosomal fusions. In total, 287 fusion transcripts were identified. These included intra-chromosomal junctions of three fusion variants ofNUP98in 6 patients (NUP98-NSD1, N = 4;NUP98-HOXD13, N = 1; and NUP98-HMGB3, N = 1;Fig 7C). Frequent high-confidence in-frame fusions (i.e.,PIM3-SCO2, ADSL-SGSM3andSIDT2-TAGLN(Fig 7D), as well as allNUP98variants) were confirmed by secondary methodology (PCR and Sanger sequencing).
There were 119 genes involved in the 69 fusion events and gene set enrichment analysis of these 119 genes using the Database for Annotation, Visualization, and Integrated Discovery (DAVID)[38] (Huang et al. 2009) indicated that these fusion genes are enriched in genes that code for proteins which are post-translationally modified by the attachment of at least one methyl, phosphate, or acetyl group.
Discussion
Fusion transcripts resulting from genomic translocations betweenRUNX1-RUNX1T1in t (8;21) andCBFB-MYH11in Inv(16), collectively referred to as CBF AML, have similar clinical outcomes, but the similarities and differences between the two entities have not been studied in detail. We investigated the transcriptome profiles of specimens from children with AML char-acterized by t(8;21) or Inv(16), and also from a third subset of patients with normal karyotype (NK) in order to define transcript-expression patterns as well as isoforms and pathways that are differentially expressed in these genomic subsets and to delineate the similarities and differ-ences in these groups of patients. Hundreds of differentially expressed genes were found in each cohort indicating a widespread presence of differential expression among different cyto-genetic abnormalities. Using the NK cohort as our control, we established expression profiles for each of the two subtypes [i.e., t(8;21) and Inv(16)] in CBF AML to define genes whose expression patterns are shared or differ between the two subtypes. A large number of differen-tially expressed genes were identified for the subsets of t(8;21) and Inv(16) compared to the NK cohort. We then demonstrated that the majority of the shared differentially expressed genes (175 / 198; binomial testp-value<10−30) between t(8;21) and Inv(16) are consistent in
the two subtypes (genes are up- or down-regulated in both subtypes) and these genes are enriched for a number ofHOXgenes involved in morphogenesis, specifically the development of the embryonic skeletal system. Additionally, each of the subgroups were enriched for differ-entially expressed genes that containedRUNX1binding sites; 72.8% of genes in the t(8;21) samples; 73.8% of genes in the inv(16) samples and 69.0% of genes in the normal samples.
early-CBFB-MYH11, to regulate ribosomal RNA transcription [41,42]. The dysregulation of these processes is thought to aid in the fusion proteins’role in altering differentiation, proliferation and disrupting normal hematopoiesis.
We further assessed the presence of fusion transcripts found in our study population. Given the high false-positive rate for most current gene-fusion detection methods[10,31], our inte-gration of four distinct gene-fusion detection methods with ChimerDB, a knowledgebase of fusion genes, allowed us to identify fusion transcripts more accurately than is possible with approaches that use a single method. (We accurately identified 29 out of 31 cases for those known fusion events (CBFB-MYH11andRUNX1-RUNX1T1) in CBF AML.) In addition to identifying the 29 known fusion transcripts, we detected an additional 258 fusion transcripts (67 fusion events in 115 genes). Fusions of high interest include those involvingNUP98, a nucleoporin gene that encodes a building block of the nuclear pore complex which mediates the transport of mediators of cellular function across the nuclear membrane. Three fusion vari-ants ofNUP98were identified (NUP98-NSD1,NUP98-HOXD13, andNUP98-HMGB3). NUP98-NSD1has been shown to co-occur with the mutation of FLT3/ITD and to be strongly associated with adverse outcomes[43], thoughNUP98-HOXD13andNUP98-HMGB3are less-known variants whose prevalence and clinical implications are yet to be determined. Further, we identified a large number of intra-chromosomal fusions whose true functionality needs be evaluated. Some of these fusions may result from transcriptional read-throughs that may or may not be functionally significant. Studies of the protein products and functional significance of these lesions is ongoing. Our study also indicates that the identified fusion transcripts are enriched in genes that encode proteins undergoing post-translational modification by acetyla-tion, methylaacetyla-tion, or phosphorylaacetyla-tion, suggesting potential functional implications. A previous study has shown that chromatin proteins and metabolic enzymes are highly represented in acetylated, methylated, or phosphorylated proteins[44], suggesting that gene fusions may pro-foundly affect gene expression and metabolism in pediatric AML subtypes.
This study also highlights the significance of homeobox (HOX) genes in CBF AML. Dysre-gulation ofHOXgenes contributes to the perturbation of normal hematopoiesis[45,46], and the overexpression ofHOXgenes in hematopoietic cells can contribute to leukemogenesis[47, 48]. Our results demonstrate that the expression levels of allHOXgenes were down-regulated in the t(8;21) subtype, whereas in contrast, fourHOXgenes (HOXB2,HOXB3,HOXB4 and MEIS1) had much higher expression levels in the Inv(16) subtype than that in the t(8;21) sub-type. The potential implication of differentialHOXexpression in CBF AML subtypes may cooperate with the leukemogenic potential of the two fusion events (CBFB-MYH11and RUNX1-RUNX1T1)[49]. Furthermore, given our observations of highHOXexpression in patients with FLT3/ITD mutation and previous reports of association of elevatedHOX expres-sion with adverse outcomes[8,50], the hypothesis thatHOXexpression may mediate the evolu-tion of resistance should be considered.
isoforms, and fusion transcript profiles for CBF AML subtypes, and it also identifies specific genes and pathways that may provide targets for therapeutic intervention.
Materials and Methods
Pediatric AML samples
64 diagnostic samples derived from either bone marrow (n = 59) or peripheral blood (n = 5) were used in this study. All samples were obtained by written consent from the parents/guard-ians of minors from three consecutive Children’s Oncology Group clinical trials (CCG-2961, AAML-03P1, and AAML-0531). The Institutional Review Board at Fred Hutchinson Cancer Research Center has reviewed and approved this study. It is filed under protocol 1642 (Biology of the Alterations of the Signal Transduction Pathway in Pediatric Cancer), IR File #5236. Col-lectively, the percentage of leukemic blasts in the samples is very high with a median of 77.5% (range 40–100%). Age range is 0.83–20.82 years with a median of 12.29 years. Males represent 42 out of 64 (66%) patients.
RNA preparation and sequencing
Genetic material from AML specimens was extracted using AllPrep DNA/RNA Mini Kits (Qiagen, Valencia, CA). At Hudson Alpha Institute (Huntsville, AL), 1μg of high-quality total
RNA was used for the conversion of mRNA into a cDNA library of template molecules based on mRNA capture with poly(T) magnetic beads, fragmentation, and reverse transcription to first-strand cDNA with reverse transcriptase and random primers using Illumina's TruSeq RNA Sample Prep kit (Illumina, San Diego, CA) according to the manufacturer's instructions. After adaptor ligation, each cDNA library was purified and enriched by PCR amplification; the final average fragment size, including adaptors, was 280 bases. Each library was then subjected to 50-cycle paired-end sequencing on the Illumina HiSeq, with four samples multiplexed into each flow cell lane.
Alignment of RNA-sequencing reads to the human genome
Paired-end RNA-sequencing reads were aligned to the human reference genome (hg19/NCBI Build 37). Both the human reference genome and the splicing junction sequences were com-bined to form the reference sequences using the USeq MakeTranscriptome program[51], and RNA-sequencing reads were aligned to the whole genome and splice junctions using Novoalign (Novocraft 2010). Novoalign used a structural-variation penalty to determine whether paired-end reads should be reported when they did not form proper fragments. Finally, the aligned reads were sorted and indexed using SAMTools[52] and were stored in the SAM/BAM format. All BAM files have been deposited at The database of Genotypes and Phenotypes (dbGaP, http://www.ncbi.nlm.nih.gov/gap) under substudy, phs000465.v10.p3, TARGET: Acute Mye-loid Leukemia (AML).
Identification of differentially expressed genes
We used the MATS program to detect five distinct alternative splicing events. Putative alterna-tive splicing events were identified from the RNA-sequencing data using the annotation file that HTSeq had downloaded fromensembl.org. TopHat[55] was used to identify alternative splicing events, MATS was used to calculate thep-value for each alternative splicing event, and the false-discovery rate (FDR) control was applied to find differential alternative splicing events among samples with distinct cytogenetic abnormalities (S7 Table).
Identification of fusion events
Four gene-fusion detection methods—Defuse[28], Tophat-Fusion[29], FusionMap[30] and Snowshoes-FTD[11] were used to identify gene-fusion events in the pediatric AML samples. Fusion events identified by more than one methods were chosen as putative fusion events (S8 Table). Moreover, a knowledgebase of fusion genes, ChimerDB[33], was used to include those fusion events, which were only detected by a gene-fusion detection method. Visualization of fusion events was created using an in-house Perl program, which is based on the GD graphics library and uses UCSC hg19 known gene as gene and exon reference.
RT-PCR validation for putative fusion events
RNA was reverse-transcribed using Thermo Scientific’s Maxima H Minus First Strand cDNA Synthesis Kit (Thermo Fisher Scientific, Pittsburgh, PA). The resulting cDNA was used in PCR amplification of fusion junctions with primers listed inS9 Table. Fusion transcripts were veri-fied by Sanger sequencing.
Supporting Information
S1 Fig. An example showing the differential expression of genes between samples with dif-ferent cytogenetic abnormalities.RNA-seq reads were mapped to the region ofRUNX1T1for 64 pediatric AML samples (red: high read density; green: low read density).
(TIF)
S2 Fig. Co-expression of Inv(16)-specific and normal-specific genes.(A-B) Heatmaps show-ing the clustershow-ing of differentially expressed genes among 64 pediatric AML samples for Inv (16)-specific and normal-specific differentially expressed genes. (C-D) Co-expression gene net-works for Inv(16)-specific and normal-specific differentially expressed genes. Co-expressed genes were determined based on the coefficient of determination (R2>0.6). The co-expression
gene network was generated using Cytoscape 2.8.3 (Smoot et al. 2011). Node color is based on the fold change of the differentially expressed gene (red: up-regulated; green: down-regulated) and node size corresponds to the degree of the node (the number of edges incident to the node).
S1 Table. Baseline characteristics of 64 pediatric AML patients. (XLSX)
S2 Table. Summary of mapping data for 64 pediatric AML samples generated by RNA sequencing.
(XLSX)
S3 Table. List of Genes with RUNX1 binding sites in each Cytogenetic Group. (XLS)
S4 Table. Shared down-regulated and up-regulated genes in CBF AML vs. those with nor-mal karyotype (NK).
(XLSX)
S5 Table. List of 69 putative fusion events. (XLSX)
S6 Table. Differential expression analysis using DESeq. (XLSX)
S7 Table. Multivariate Analysis of Transcript Splicing (MATS). (XLS)
S8 Table. Gene Fusion events Identified by 2 or more detection methods, or 1 detection method + ChimerDB.
(XLSX)
S9 Table. List of fusion primers. (XLSX)
Acknowledgments
The authors would like to acknowledge the late Robert Arceci, who passed after this manu-script was submitted. Dr. Arceci was a world renowned pediatric oncologist and a pioneer in the field of leukemia. We are saddened that we will not have the opportunity to continue to col-laborate with him, but thankful to have had the chance to work with him for so many years. The authors also would like to thank Laura Kay Fleming, Ph.D., NCI Center for Biomedical Informatics and Information Technology, for providing editorial support during the prepara-tion of this manuscript.
Author Contributions
Conceived and designed the experiments: SM RER. Performed the experiments: SL. Analyzed the data: CH CN CY QC YH GK DM. Contributed reagents/materials/analysis tools: SM RER SL DM. Wrote the paper: CH RER SM DM DLS FO.
References
1. Schuback HL, Arceci RJ, Meshinchi S. Somatic characterization of pediatric acute myeloid leukemia using next-generation sequencing. Seminars in hematology. 2013; 50(4):325–32. doi:10.1053/j. seminhematol.2013.09.003PMID:24246700.
2. Hollink IH, Feng Q, Danen-van Oorschot AA, Arentsen-Peters ST, Verboon LJ, Zhang P, et al. Low fre-quency of DNMT3A mutations in pediatric AML, and the identification of the OCI-AML3 cell line as an in vitro model. Leukemia. 2012; 26(2):371–3. doi:10.1038/leu.2011.210PMID:21836609.
Medical Research Council Adult and Children's Leukaemia Working Parties. Blood. 1998; 92(7):2322–
33. PMID:9746770.
8. Thiede C, Steudel C, Mohr B, Schaich M, Schakel U, Platzbecker U, et al. Analysis of FLT3-activating mutations in 979 patients with acute myelogenous leukemia: association with FAB subtypes and identi-fication of subgroups with poor prognosis. Blood. 2002; 99(12):4326–35. PMID:12036858.
9. Ozsolak F, Milos PM. RNA sequencing: advances, challenges and opportunities. Nature reviews Genetics. 2011; 12(2):87–98. Epub 2010/12/31. doi:10.1038/nrg2934PMID:21191423; PubMed Cen-tral PMCID: PMCPmc3031867.
10. Wang Z, Gerstein M, Snyder M. RNA-Seq: a revolutionary tool for transcriptomics. Nature reviews Genetics. 2009; 10(1):57–63. doi:10.1038/nrg2484PMID:19015660; PubMed Central PMCID: PMC2949280.
11. Asmann YW, Hossain A, Necela BM, Middha S, Kalari KR, Sun Z, et al. A novel bioinformatics pipeline for identification and characterization of fusion transcripts in breast cancer and normal cell lines. Nucleic acids research. 2011; 39(15):e100. doi:10.1093/nar/gkr362PMID:21622959; PubMed Central PMCID: PMC3159479.
12. Wang X, Cairns MJ. Gene set enrichment analysis of RNA-Seq data: integrating differential expression and splicing. BMC bioinformatics. 2013; 14 Suppl 5:S16. doi:10.1186/1471-2105-14-S5-S16PMID:
23734663; PubMed Central PMCID: PMC3622641.
13. Eswaran J, Horvath A, Godbole S, Reddy SD, Mudvari P, Ohshiro K, et al. RNA sequencing of cancer reveals novel splicing alterations. Scientific reports. 2013; 3:1689. doi:10.1038/srep01689PMID:
23604310; PubMed Central PMCID: PMC3631769.
14. Cancer Genome Atlas Research N. Genomic and epigenomic landscapes of adult de novo acute mye-loid leukemia. The New England journal of medicine. 2013; 368(22):2059–74. doi:10.1056/
NEJMoa1301689PMID:23634996; PubMed Central PMCID: PMC3767041.
15. Macrae T, Sargeant T, Lemieux S, Hebert J, Deneault E, Sauvageau G. RNA-Seq reveals spliceosome and proteasome genes as most consistent transcripts in human cancer cells. PloS one. 2013; 8(9): e72884. doi:10.1371/journal.pone.0072884PMID:24069164; PubMed Central PMCID: PMC3775772. 16. Lilljebjorn H, Agerstam H, Orsmark-Pietras C, Rissler M, Ehrencrona H, Nilsson L, et al. RNA-seq
iden-tifies clinically relevant fusion genes in leukemia including a novel MEF2D/CSF1R fusion responsive to imatinib. Leukemia. 2014; 28(4):977–9. doi:10.1038/leu.2013.324PMID:24186003.
17. Anders S, Huber W. Differential expression analysis for sequence count data. Genome biology. 2010; 11(10):R106. doi:10.1186/gb-2010-11-10-r106PMID:20979621; PubMed Central PMCID:
PMC3218662.
18. Ichikawa M, Yoshimi A, Nakagawa M, Nishimoto N, Watanabe-Okochi N, Kurokawa M. A role for RUNX1 in hematopoiesis and myeloid leukemia. International journal of hematology. 2013; 97(6):726–
34. doi:10.1007/s12185-013-1347-3PMID:23613270.
19. Mandoli A, Singh AA, Jansen PW, Wierenga AT, Riahi H, Franci G, et al. CBFB-MYH11/RUNX1 together with a compendium of hematopoietic regulators, chromatin modifiers and basal transcription factors occupies self-renewal genes in inv(16) acute myeloid leukemia. Leukemia. 2014; 28(4):770–8. doi:10.1038/leu.2013.257PMID:24002588.
20. Shigesada K, van de Sluis B, Liu PP. Mechanism of leukemogenesis by the inv(16) chimeric gene CBFB/PEBP2B-MHY11. Oncogene. 2004; 23(24):4297–307. doi:10.1038/sj.onc.1207748PMID:
15156186.
21. Liu PP, Hajra A, Wijmenga C, Collins FS. Molecular pathogenesis of the chromosome 16 inversion in the M4Eo subtype of acute myeloid leukemia. Blood. 1995; 85(9):2289–302. PMID:7727763. 22. Smoot ME, Ono K, Ruscheinski J, Wang PL, Ideker T. Cytoscape 2.8: new features for data integration
and network visualization. Bioinformatics. 2011; 27(3):431–2. doi:10.1093/bioinformatics/btq675
23. Thorsteinsdottir U, Kroon E, Jerome L, Blasi F, Sauvageau G. Defining roles for HOX and MEIS1 genes in induction of acute myeloid leukemia. Mol Cell Biol. 2001; 21(1):224–34. PMID:11113197. 24. Pabst O, Zweigerdt R, Arnold HH. Targeted disruption of the homeobox transcription factor Nkx2-3 in
mice results in postnatal lethality and abnormal development of small intestine and spleen. Develop-ment. 1999; 126(10):2215–25. PMID:10207146.
25. Shen S, Park JW, Huang J, Dittmar KA, Lu ZX, Zhou Q, et al. MATS: a Bayesian framework for flexible detection of differential alternative splicing from RNA-Seq data. Nucleic acids research. 2012; 40(8): e61. doi:10.1093/nar/gkr1291PMID:22266656; PubMed Central PMCID: PMC3333886.
26. Maher CA, Kumar-Sinha C, Cao X, Kalyana-Sundaram S, Han B, Jing X, et al. Transcriptome sequenc-ing to detect gene fusions in cancer. Nature. 2009; 458(7234):97–101. doi:10.1038/nature07638
PMID:19136943; PubMed Central PMCID: PMC2725402.
27. Pflueger D, Terry S, Sboner A, Habegger L, Esgueva R, Lin PC, et al. Discovery of non-ETS gene fusions in human prostate cancer using next-generation RNA sequencing. Genome research. 2011; 21 (1):56–67. doi:10.1101/gr.110684.110PMID:21036922; PubMed Central PMCID: PMC3012926. 28. McPherson A, Hormozdiari F, Zayed A, Giuliany R, Ha G, Sun MG, et al. deFuse: an algorithm for gene
fusion discovery in tumor RNA-Seq data. PLoS computational biology. 2011; 7(5):e1001138. doi:10. 1371/journal.pcbi.1001138PMID:21625565; PubMed Central PMCID: PMC3098195.
29. Kim D, Salzberg SL. TopHat-Fusion: an algorithm for discovery of novel fusion transcripts. Genome biology. 2011; 12(8):R72. doi:10.1186/gb-2011-12-8-r72PMID:21835007; PubMed Central PMCID: PMC3245612.
30. Ge H, Liu K, Juan T, Fang F, Newman M, Hoeck W. FusionMap: detecting fusion genes from next-gen-eration sequencing data at base-pair resolution. Bioinformatics. 2011; 27(14):1922–8. doi:10.1093/ bioinformatics/btr310PMID:21593131.
31. Shah SP, Morin RD, Khattra J, Prentice L, Pugh T, Burleigh A, et al. Mutational evolution in a lobular breast tumour profiled at single nucleotide resolution. Nature. 2009; 461(7265):809–13. doi:10.1038/ nature08489PMID:19812674.
32. Wang XS, Prensner JR, Chen G, Cao Q, Han B, Dhanasekaran SM, et al. An integrative approach to reveal driver gene fusions from paired-end sequencing data in cancer. Nature biotechnology. 2009; 27 (11):1005–11. doi:10.1038/nbt.1584PMID:19881495; PubMed Central PMCID: PMC3086882. 33. Kim P, Yoon S, Kim N, Lee S, Ko M, Lee H, et al. ChimerDB 2.0—a knowledgebase for fusion genes
updated. Nucleic acids research. 2010; 38(Database issue):D81–5. doi:10.1093/nar/gkp982PMID:
19906715; PubMed Central PMCID: PMC2808913.
34. Mueller D, Garcia-Cuellar MP, Bach C, Buhl S, Maethner E, Slany RK. Misguided transcriptional elon-gation causes mixed lineage leukemia. PLoS biology. 2009; 7(11):e1000249. doi:10.1371/journal. pbio.1000249PMID:19956800; PubMed Central PMCID: PMC2774266.
35. Hollink IH, van den Heuvel-Eibrink MM, Arentsen-Peters ST, Pratcorona M, Abbas S, Kuipers JE, et al. NUP98/NSD1 characterizes a novel poor prognostic group in acute myeloid leukemia with a distinct HOX gene expression pattern. Blood. 2011; 118(13):3645–56. doi:10.1182/blood-2011-04-346643
PMID:21813447.
36. Raza-Egilmez SZ, Jani-Sait SN, Grossi M, Higgins MJ, Shows TB, Aplan PD. NUP98-HOXD13 gene fusion in therapy-related acute myelogenous leukemia. Cancer research. 1998; 58(19):4269–73. PMID:9766650.
37. Tonks A, Pearn L, Musson M, Gilkes A, Mills KI, Burnett AK, et al. Transcriptional dysregulation medi-ated by RUNX1-RUNX1T1 in normal human progenitor cells and in acute myeloid leukaemia. Leuke-mia. 2007; 21(12):2495–505. doi:10.1038/sj.leu.2404961PMID:17898786.
38. Huang da W, Sherman BT, Lempicki RA. Systematic and integrative analysis of large gene lists using DAVID bioinformatics resources. Nature protocols. 2009; 4(1):44–57. Epub 2009/01/10. doi:10.1038/ nprot.2008.211PMID:19131956.
39. Zhou HL, Hinman MN, Barron VA, Geng C, Zhou G, Luo G, et al. Hu proteins regulate alternative splic-ing by inducsplic-ing localized histone hyperacetylation in an RNA-dependent manner. Proceedsplic-ings of the National Academy of Sciences of the United States of America. 2011; 108(36):E627–35. doi:10.1073/ pnas.1103344108PMID:21808035; PubMed Central PMCID: PMC3169152.
40. Hnilicova J, Hozeifi S, Duskova E, Icha J, Tomankova T, Stanek D. Histone deacetylase activity modu-lates alternative splicing. PloS one. 2011; 6(2):e16727. doi:10.1371/journal.pone.0016727PMID:
21311748; PubMed Central PMCID: PMC3032741.
41. Bakshi R, Zaidi SK, Pande S, Hassan MQ, Young DW, Montecino M, et al. The leukemogenic t(8;21) fusion protein AML1-ETO controls rRNA genes and associates with nucleolar-organizing regions at mitotic chromosomes. Journal of cell science. 2008; 121(Pt 23):3981–90. doi:10.1242/jcs.033431
–
46. Sitwala KV, Dandekar MN, Hess JL. HOX proteins and leukemia. International journal of clinical and experimental pathology. 2008; 1(6):461–74. PMID:18787682; PubMed Central PMCID: PMC2480589. 47. Magli MC, Largman C, Lawrence HJ. Effects of HOX homeobox genes in blood cell differentiation.
Jour-nal of cellular physiology. 1997; 173(2):168–77. doi:10.1002/(SICI)1097-4652(199711)173:2<168::
AID-JCP16>3.0.CO;2-CPMID:9365517.
48. Argiropoulos B, Humphries RK. Hox genes in hematopoiesis and leukemogenesis. Oncogene. 2007; 26(47):6766–76. doi:10.1038/sj.onc.1210760PMID:17934484.
49. Kuo YH, Landrette SF, Heilman SA, Perrat PN, Garrett L, Liu PP, et al. Cbf beta-SMMHC induces dis-tinct abnormal myeloid progenitors able to develop acute myeloid leukemia. Cancer cell. 2006; 9 (1):57–68. doi:10.1016/j.ccr.2005.12.014PMID:16413472.
50. Kottaridis PD, Gale RE, Frew ME, Harrison G, Langabeer SE, Belton AA, et al. The presence of a FLT3 internal tandem duplication in patients with acute myeloid leukemia (AML) adds important prognostic information to cytogenetic risk group and response to the first cycle of chemotherapy: analysis of 854 patients from the United Kingdom Medical Research Council AML 10 and 12 trials. Blood. 2001; 98 (6):1752–9. PMID:11535508.
51. Nix DA, Courdy SJ, Boucher KM. Empirical methods for controlling false positives and estimating confi-dence in ChIP-Seq peaks. BMC bioinformatics. 2008; 9:523. doi:10.1186/1471-2105-9-523PMID:
19061503; PubMed Central PMCID: PMC2628906.
52. Li H, Handsaker B, Wysoker A, Fennell T, Ruan J, Homer N, et al. The Sequence Alignment/Map for-mat and SAMtools. Bioinforfor-matics. 2009; 25(16):2078–9. doi:10.1093/bioinformatics/btp352PMID:
19505943; PubMed Central PMCID: PMC2723002.
53. Benjamini Y, Hochberg Y. Controlling the False Discovery Rate: a Practical and Powerful Approach to Multiple Testing. Journal of the Royal Statistical Society. 1995; 57(1):289–300.
54. Hu Y, Yan C, Hsu CH, Chen QR, Niu K, Komatsoulis GA, et al. OmicCircos: A Simple-to-Use R Pack-age for the Circular Visualization of Multidimensional Omics Data. Cancer informatics. 2014; 13:13–20. doi:10.4137/CIN.S13495PMID:24526832; PubMed Central PMCID: PMC3921174.