I n t r o d u c t i o n I n t r o d u c t i o n I n t r o d u c t i o n I n t r o d u c t i o n I n t r o d u c t i o n
Brazil is still in the initial stage of recognizing the behavior of drunk driving as a severe public health problem. The few existent statistics point to a worrying situation. Studies jointly performed by the RAID (Recife Institute of Integral Attention to Dependences – Instituto Re-cife de Atenção Integral às Dependências) and the ABDETRAN (Brazilian Association of Traffic Departments – Associação Brasileira dos Departamentos de Trânsito) investigated bars, avenue crossings, and hospitals and reported that between 53% and 88% of drivers showed some degree of blood alcohol, being between 13% and 27% above the legal limit.1-2 In a recent study with specific data for the city of São Paulo,3 blood levels of alcohol among deaths from external causes in people aged 13 or above in the Institute of Legal Medicine was investigated. Positive results for alcohol were found among 53.2% of pedestrians and 50.6% of all other victims of car
accidents whose alcohol blood levels were determined.
An important measure was adopted in Brazil in 1998 with the establishment of the new National Traffic Code, which is substantially stricter than the former one regarding the penalties to drunk driving. Besides the decrease of allowed blood levels, drinking under the influence of alcohol, formerly deemed a misdemeanor, became a crime, being infractors subjected not only to fines (much higher than in the previous Code), apprehension of the vehicle, suspension of the right of driving and termination of the drive license, but also to detention from one to six months.4
All over the world much has been done to deal with this problem and one of the strategies used is to resort to stricter penalties, but most studies in the area mentions the act of drunk driving as a planned and intentional action, what many times does not cover the complexity of the issue.
Willingness and alternatives to drunk driving among
young people from São Paulo city, Brazil
Disposição e alternativas ao dirigir alcoolizado entre
jovens paulistanos
Department of Psychiatry, Federal University of São Paulo
aUNIAD (Research Unit on Alcohol and Drugs) - Department of Psychiatry, Federal University of São Paulo
bCenter of Alcohol Studies, Rutgers University, Piscataway, NJ, USA cDepartment of Psychiatry, Federal University of São Paulo
Abstract
Abstract
Abstract
Abstract
Abstract
The new Brazilian Traffic Code considers drinking and driving as a traffic crime. A health behavior model suggests that much of the young people’s risky behavior is not planned and that questions measuring the willingness to drink and drive are useful. In face of the importance of drinking and driving as a national health problem, the objective of the present study was to analyze the behavior willingness among youngsters about to receive their driver’s licenses.
Methods Methods Methods Methods
Methods: The study was carried out at the São Paulo Department of Traffic (DETRAN-SP) in 1998. Data were obtained from a sample of 2,166 youths, 18 to 25 years old, who took the written drivers’ license examination. Data about, among other things, alcohol consumption, willingness and alternatives to drinking and driving in the following year was examined.
Results Results Results Results
Results: In general, individuals displayed willingness to both the risky behavior (drunk driving) and to the safe behavior (alternatives as taking a cab or getting a ride). Regression analyzes were done by dividing the sample in three groups. Several significant differences were found between the groups, suggesting that the attitudes and behaviors went on a direction from safer to riskier from groups 1 to 3.
Conclusion Conclusion Conclusion Conclusion
Conclusion: Findings suggest that prevention efforts preseting a spectrum of alternatives to drunk driving and the enforcement of drink and driving laws would be two useful addenda to the more severe laws created in the 1998 Traffic Code.
Keywords Keywords Keywords Keywords
Keywords: Alcohol consumption; Accidents, traffic; Automobile driving/standards; Social problems..
Resumo
Resumo
Resumo
Resumo
Resumo
No novo código de trânsito brasileiro, a infração de dirigir sob efeito do álcool passou a ser considerada um crime de trânsito. Um modelo do comportamento de saúde dos jovens sugere que muito do seu comportamento “arriscado” não é planejado e que questões que examinam a disposição de dirigir alcoolizado são úteis em pesquisas sobre o assunto. Pela importância da questão do dirigir alcoolizado como assunto na saúde pública nacional, esse estudo utilizou-se do modelo de protótipo/disposição para analisar esse comportamento em jovens prestes a obter carteiras de habilitação em São Paulo.
Métodos Métodos Métodos Métodos
Métodos: O estudo foi realizado no DETRAN-SP (Departamento de Trânsito de São Paulo), em 1998, entre 2.166 jovens de 18 a 25 anos de idade. Examinou-se desde medidas de consumo de bebidas alcoólicas a disposição e alternativas ao dirigir alcoolizado no ano seguinte.
Resultados Resultados Resultados Resultados
Resultados: A maioria dos sujeitos admitia disposição tanto para o comportamento de risco (dirigir alcoolizado) quanto para o comportamento seguro (alternativas como pegar taxi e pedir carona). Foram efetuadas análises de regressão linear com a divisão da amostra em três grupos. De maneira geral, as várias diferenças com significado estatístico encontradas sugeriam que as atitudes e comportamentos seguem uma trajetória crescente de mais seguros a mais arriscados do grupo 1 ao grupo 3. Conclusão
Conclusão Conclusão Conclusão
Conclusão: Os achados sugerem, entre outras coisas, que campanhas de prevenção apresentando uma variedade de alternativas ao dirigir alcoolizado e o aumento da fiscalização desse comportamento seriam dois adendos básicos para a eficácia das leis mais severas do código de trânsito de 1998.
Descritores: Descritores: Descritores: Descritores:
Descritores: Consumo de bebidas alcoólicas; Acidentes de trânsito; Condução de veículo/normas; Problemas sociais. Original version accepted in English
Original version accepted in English Original version accepted in English Original version accepted in English Original version accepted in English
235
The American authors Gibbons, Gerrard et al5-7 proposed a model (Prototype/Willingness) which adds elements of spontaneous reaction (reactiveness) to a very popular behavioral theory, the Reasoned Action Theory. Basically, this theory considers the subject’s intention as having a central role in the performing of a determined behavior. It is presumed that intentions would capture the motivational factors which influence the behavior, that is, as a general rule, the stronger the intention of engaging in a behavior, the more likely is that this behavior will be performed.8 In case of behaviors which are harmful to health, such as the use of drugs and drunk driving, this rational theory, although useful, may not predict behaviors so precisely. In these cases, a model such as the one described below, which uses elements from the Risky Decision Making model, tends to make more sense.
Gibbons et al,7 verified that willingness to drunk driving predicts the behavior of drunk driving, independently, and beyond expectations. The willingness for a behavior is measured through questions which ask subjects to imagine being in a risk situation. What is assessed is not the subjects’ intention to expose themselves to risk, but their openness for these situations, independently from the specific circumstances. Behavior options in different situations are proposed, some of them more and other less ordinary. For example, in the case of using cigarettes, the authors used in one survey the following questions: ‘Supposing that you are with some friends and they offer you a cigarette. Which is the probability of acting in any of the following ways: a) Taking the cigarette and experimenting it; b) Thanking and refusing; c) Just leaving. The subject would answer then to three questions in a scale from very likely to unlikely.7
The application of this model suggests that much of the ‘risk’ behavior of youngsters and adolescents is not planned and that the questions which measure the willingness to drive alcoholized are useful in research on the subject. There is some evidence supporting this model. One study followed subjects aged 21 to 28 years and verified that most of them showed both risk behaviors (driving alcoholized or as passengers of alcoholized drivers) and safe behaviors (deciding not to drive under the influence of alcohol or to preventsomeone to do it). The authors concluded that situations of alcohol consumption are seen as decision-making situations in which subjects choose courses of action more or less safe.9
In a previous paper, it was found that general prevention variables, such as a higher consumption of alcohol and higher experience being a passenger of alcoholized drivers, predict the expectation of driving under the effect of alcohol in the following year.10 The objective of this article is to verify, using a prototype/willingness model, the hypothesis that variables which measure the willingness of driving alcoholized among Brazilian youngsters may be useful to identify subjects under higher risk of having this behavior.
Method Method Method Method Method
1. Subjects and procedure 1. Subjects and procedure 1. Subjects and procedure 1. Subjects and procedure 1. Subjects and procedure
The initial sample was composed by 2,166 subjects, aged 18 to 25 years, who were taking the theoretical exam during the two last turns at DETRAN-SP. Data from all the days during one month, from October 21 up to November 21, 1998, were collected.
The questionnaire, anonymously and voluntarily answered, was administered in groups after the subjects had handed in the theoretical exam. In order to encourage sincere answers, the subjects were told twice that the study had been developed by researchers from UNIFESP, totally independent from DETRAN-SP, which would not have any contact with the completed questionnaires. This information was also given by subjects in written, on the first page of the questionnaire, which they detached and took home. Besides, during the administration of questionnaires, the police officers responsible for the written exams went out of the room.
Almost no subject refused to participate in the study, but 162 out of the 2,166 youngsters returned quite incomplete and/or incoherent questionnaires. It was raised the hypothesis that these 162 candidates had not finished the task due to reading difficulties. In fact, the mean schooling level of these subjects was significantly lower (p<0.0001) than the remaining sample. One database only with their demographic data was prepared for these subjects. The final sample for the analyses shown below therefore, consisted of 2,004 subjects.
2. The theoretical exam 2. The theoretical exam2. The theoretical exam 2. The theoretical exam2. The theoretical exam
Subjects in this study were candidates to receive the national driving license and were taking the theoretical exam at DETRAN-SP. DETRAN-SP is the only institution responsible for administering the theoretical and practical exams to subjects living in the city of São Paulo and in some areas of the Greater São Paulo. Five times a week, in average 1,200 people, distributed along four rooms in five different turns, take the theoretical exam. The first exam starts nearly at 08:00 a.m., the following one hour later and then successively. The appointment of exams is performed by phone by auto-schools as to the first ones to call are booked in the first available hours and days. Therefore, it is almost impossible for a candidate to chose the time he/she will take the exam. The distribution of candidates among schoolrooms is randomized by computer programs. The four schoolrooms are situated in one single and very large room, separated only by short partitions which allow examiners to speak to all candidates at once. At each schoolroom up to 60 candidates can be arranged, and as a result nearly 240 candidates are examined each turn.
Total time for completion of the exam is nearly 20 minutes and its administration is performed by police officers (who also exa-mine, at the room entrance, the identity card of candidates in order to prevent subjects to take the exam in the place of others). Besides answering multiple choice questions about traffic laws and signs candidates have to write a small text read by examiners, aiming to verify if the subject is literate.
3. Materials 3. Materials3. Materials 3. Materials3. Materials
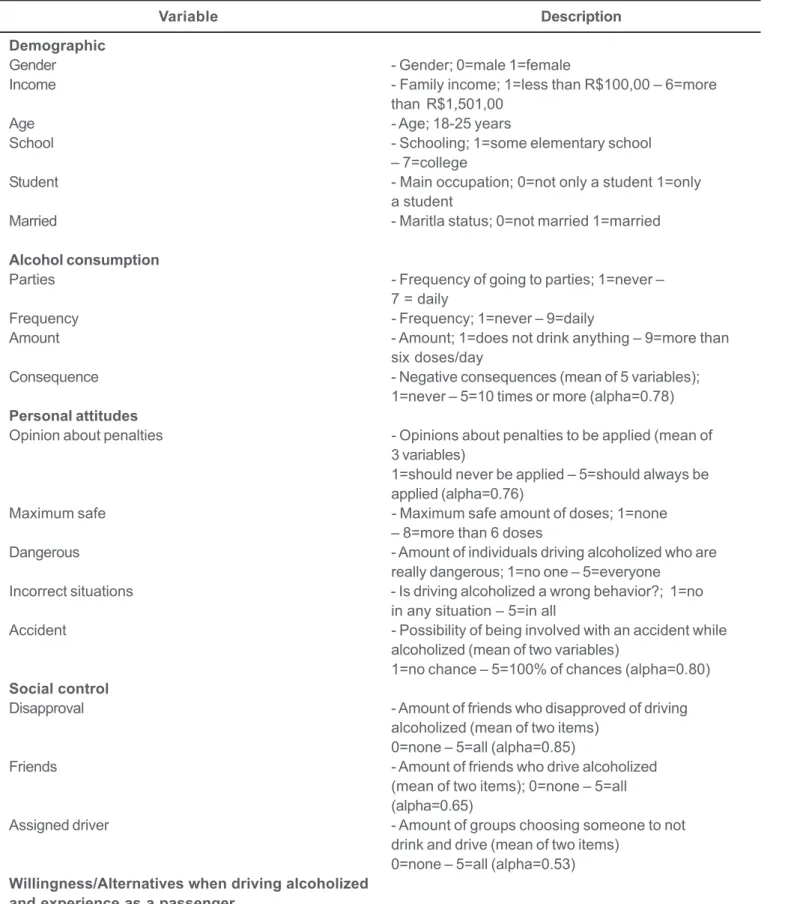
It was used a 55-item questionnaire in order to obtain the study’s data. The questionnaire was divided into seven parts: demographic data, alcohol consumption, knowledge of laws about driving alcoholized, personal attitudes, credibility of the laws, social control and willingness to driving alcoholized/experience as a passenger. The knowledge of laws was tested by seven items questioning about the traffic code regarding driving alcoholized, including the legal blood alcohol limit, the score that the driver would receive in his/her driving license and the maximum amount of doses that a subject could drink, according to the law, before driving. Table 1 presents a summarized description of these variables. A more detailed description can be found in a published article.10
4. Data analysis 4. Data analysis4. Data analysis 4. Data analysis4. Data analysis
For data analysis, it was used the program for statistic analyses SAS. The procedure to verify demographic differences between groups included chi-square analysis (for categorical variables) and variance analyis (for continuous variables). Linear regression analysis was performed with the General Linear Models Procedure – least square means. Normal data distribution was assured by residue analysis.
Results ResultsResults ResultsResults 1. General data 1. General data1. General data 1. General data1. General data a) Descriptive analysis
Table 1 - Summarized description of the variables considered for the study
Variable
Demographic
Gender
- Gender; 0=male 1=female
Income
- Family income; 1=less than R$100,00 – 6=more
than R$1,501,00
Age
- Age; 18-25 years
School
- Schooling; 1=some elementary school
– 7=college
Student
- Main occupation; 0=not only a student 1=only
a student
Married
- Maritla status; 0=not married 1=married
Alcohol consumption
Parties
- Frequency of going to parties; 1=never –
7 = daily
Frequency
- Frequency; 1=never – 9=daily
Amount
- Amount; 1=does not drink anything – 9=more than
six doses/day
Consequence
- Negative consequences (mean of 5 variables);
1=never – 5=10 times or more (alpha=0.78)
Personal attitudes
Opinion about penalties
- Opinions about penalties to be applied (mean of
3 variables)
1=should never be applied – 5=should always be
applied (alpha=0.76)
Maximum safe
- Maximum safe amount of doses; 1=none
– 8=more than 6 doses
Dangerous
- Amount of individuals driving alcoholized who are
really dangerous; 1=no one – 5=everyone
Incorrect situations
- Is driving alcoholized a wrong behavior?; 1=no
in any situation – 5=in all
Accident
- Possibility of being involved with an accident while
alcoholized (mean of two variables)
1=no chance – 5=100% of chances (alpha=0.80)
Social control
Disapproval
- Amount of friends who disapproved of driving
alcoholized (mean of two items)
0=none – 5=all (alpha=0.85)
Friends
- Amount of friends who drive alcoholized
(mean of two items); 0=none – 5=all
(alpha=0.65)
Assigned driver
- Amount of groups choosing someone to not
drink and drive (mean of two items)
0=none – 5=all (alpha=0.53)
Willingness/Alternatives when driving alcoholized
and experience as a passenger
WDAD
- Willingness of driving after drinking 3 more doses;
1=none – 5=full
Lifting
- Willingness to as for a liftin after drinking 3 doses
or more; 1=total – 5=full
Taxi
- Willingness to take a taxi or bus after drinking
3 doses or more; 1=total – 5=full
Description
237
Passenger
- Times being a passenger of an alcoholized
doses or more 1=never – 5=10 times or more
Refusal
- Times refusing a passenger of an alcoholized driver
1=never – 5=10 times or more
Knowledge of laws
Knowledge
- Addition of the correct answers to 7 questions (alpha=0.32)
Credibility of laws
Personal acquaintance
- Personal acquaintance of someone who was stopped
and/or punished for driving alcoholized (sum of four
variables); 0=no – 1=yes (alpha=0.74)
Punishment
- Drivers convicted who were really punished;
0=none – 5=all
Chance of being caught
- Chance of being caught by the police and/or being
punished for driving alcoholized (mean of 4
variables); 1=no chance – 5=100% of chances
(alpha=0.85)
The first dependent variable, DDAL, measures the willingness of the subject to drive under the effect of alcohol during the year after the questionnaire, taking into account a specific scenery. More than half of the sample admitted having had at least a small willingness to driving alcoholized in the year. On the other hand, the great majority of subjects reported that they would consider alternatives to driving alcoholized. Therefore, only 7.7% and 22.8% of subjects claimed that there was no chance that they, respectively, would take taxis or buses (TAXI) or would ask for someone to drive the car (LIFT) as alternatives to drunk driving. Due to the willingness admitted by most subjects both to risk behaviors (drunk driving) and to safe behavior (alternatives), data were analyzed through the division of the sample into three groups. These groups represent increasing degrees of risk regarding driving alcoholized. We excluded from this analysis subjects whose alcohol consumption was extremely rare (less than one day per year and less than one dose by episode).
Group 1 (Cautious, n=378) was composed by subjects who had not reported any willingness to drive alcoholized. Group 2 (Undecided, n=616) was formed by subjects who admitted at least a small willingness to drive under the effect of alcohol, but that, at the same time, reported willingness to at least one of the alternatives. Group 3 (Risky, n=88) included subjects who admitted willingness to drive alcoholized, but no willingness to consider both alternatives.
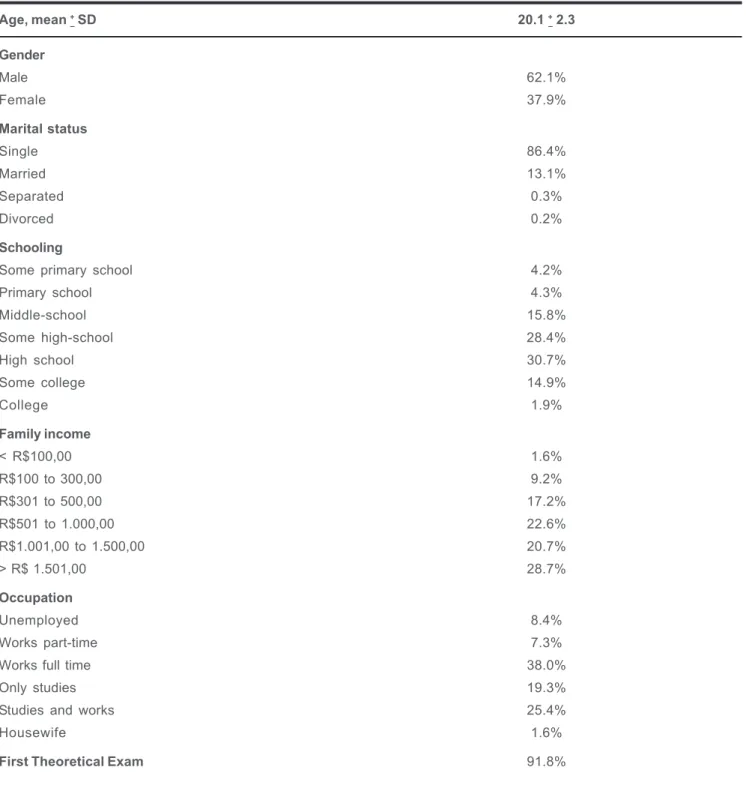
First, statistically significant differences between groups regarding demographic variables were assessed: gender, occupation, marital status, schooling and income. Statistically significant differences were found between marital status and group (X2= 8.7, p<0.05) and between age and group (F=3.08, p<0.05) and, therefore, these two variables were included in the further analyses. A minority of subjects from all groups were married, but those from group 1 (13.8% vs. 11.4%) had this marital status with higher frequency and were slightly older (20.2 vs. 19.6 years old) than subjects from group 3 (p<0.05). Subjects from group 2 were also married in a smaller frequency (8%, p<0.05) than members of group 1, but had no difference regarding the age range.
b) Linear regression analysis
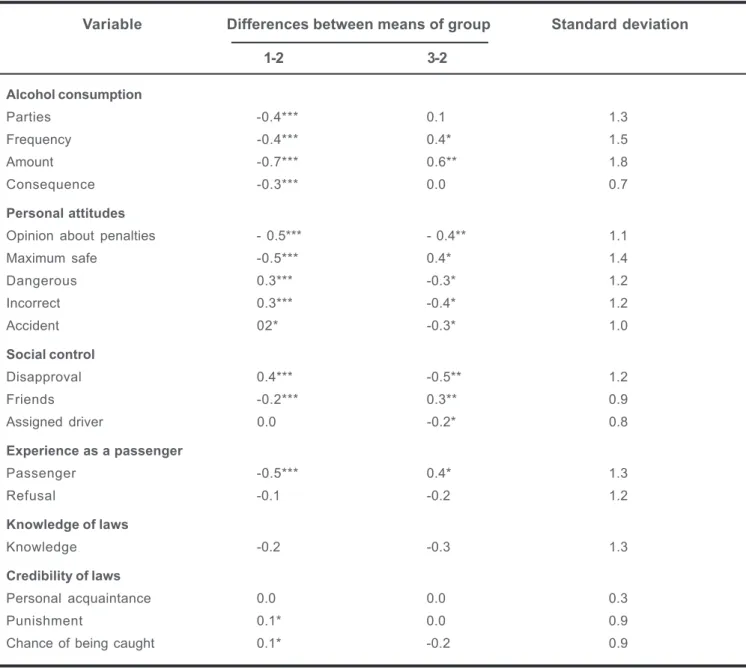
The differences between groups were assessed by separated least-squares linear regression analyses for each dependent variable (displayed in table 3). Independent variables in these analyses included age (assessed as a binomial variable: up to 19 years and above 19 years), marital status (binomial variable: married and non-married) and group (categorical variable with three levels, having group 2 as the reference). Unstandardized B coefficients represent the mean differences between groups after controlling for age and marital status and, therefore, were displayed in table 3 and in the next paragraph. Few statistically significant differences were found regarding demographic variables. Married people go significantly less to parties (p<0.0001, mean difference=-0.63), think that a smaller number of subjects driving after drinking are really dangerous (p<0.05, mean difference=0.25) and consider as low the probability of accidents when driving under the effect of alcohol (p<0.05, mean difference=0.23). Regarding younger subjects (19 years old or less), they showed a more accurate knowledge of the law (p<0.05, mean difference =0.18), considered safe driving after drinking a higher number of doses (p<0.05, mean difference =0.28) and reported more frequently behaviors of assigning other person to drive (p<0.05, mean difference=0.14). Several statistically significant differences between groups were found and are displayed in Table 3. Overall, group 1 reported “safer” attitudes, perceptions, and knowledge, group 3 reported more ‘risky’ variables and group 2 showed intermediate values.
Regarding variables of alcohol consumption, group 1 showed the lowest means and group 3 subjects, the highest. Group 1 subjects went significantly less to parties and drank less frequently, in lower amounts and with fewer consequences than subjects from the other two groups.
The means of the groups regarding personal attitudes variables were all significantly different and in the expected sense. Compared with the other two groups, group 3 was the most favorable to lighter penalties for drunk driving, considered a higher number of doses as the safe limit to drive and believed that fewer people driving after drinking would be in fact dangerous. Similarly, they considered driving alcoholized as less incorrect and estimated as lower the probability of alcohol-related accidents when compared to subjects from groups 1 and 2.
Table 1 - Summarized description of the variables considered for the study
Table 2 - Sociodemographic data of youngsters trying to receive a driving license, São Paulo, SP, 1998
Age, mean +
– SD 20.1
+ – 2.3
Gender
Male 62.1%
Female 37.9%
Marital status
Single 86.4%
Married 13.1%
Separated 0.3%
Divorced 0.2%
Schooling
Some primary school 4.2%
Primary school 4.3%
Middle-school 15.8%
Some high-school 28.4%
High school 30.7%
Some college 14.9%
College 1.9%
Family income
< R$100,00 1.6%
R$100 to 300,00 9.2%
R$301 to 500,00 17.2%
R$501 to 1.000,00 22.6%
R$1.001,00 to 1.500,00 20.7%
> R$ 1.501,00 28.7%
Occupation
Unemployed 8.4%
Works part-time 7.3%
Works full time 38.0%
Only studies 19.3%
Studies and works 25.4%
Housewife 1.6%
First Theoretical Exam 91.8%
Regarding variables of alcohol consumption, group 1 showed the lowest means and group 3 subjects, the highest. Group 1 subjects went significantly less to parties and drank less frequently, in lower amounts and with fewer consequences than subjects from the other two groups.
The means of the groups regarding personal attitudes variables were all significantly different and in the expected sense. Compared with the other two groups, group 3 was the most favorable to lighter penalties for drunk driving, considered a higher number of doses as the safe limit to drive and believed that fewer people driving after drinking would be in fact dangerous. Similarly, they considered driving alcoholized as less incorrect and estimated
as lower the probability of alcohol-related accidents when compared to subjects from groups 1 and 2.
Regarding social control variables, the differences between mean of groups were in the expected sense. Group 1 subjects, when compared to those from groups 2 and 3, stated having more friends who disapproved of their driving alcoholized and less friends who would be willing, themselves, to drive after drinking. Group 3 subjects also showed significantly less behaviors of assigning someone not to drink and drive the others than the other two groups.
239
Alcohol consumption
Parties -0.4*** 0.1 1.3
Frequency -0.4*** 0.4* 1.5
Amount -0.7*** 0.6** 1.8
Consequence -0.3*** 0.0 0.7
Personal attitudes
Opinion about penalties - 0.5*** - 0.4** 1.1
Maximum safe -0.5*** 0.4* 1.4
Dangerous 0.3*** -0.3* 1.2
Incorrect 0.3*** -0.4* 1.2
Accident 02* -0.3* 1.0
Social control
Disapproval 0.4*** -0.5** 1.2
Friends -0.2*** 0.3** 0.9
Assigned driver 0.0 -0.2* 0.8
Experience as a passenger
Passenger -0.5*** 0.4* 1.3
Refusal -0.1 -0.2 1.2
Knowledge of laws
Knowledge -0.2 -0.3 1.3
Credibility of laws
Personal acquaintance 0.0 0.0 0.3
Punishment 0.1* 0.0 0.9
Chance of being caught 0.1* -0.2 0.9
*p<0.05 **p<0.005 ***p<0.0005
Table 3 - Results of linear regression analysis between groups controlling for age and marital status
Variable
Differences between means of group
Standard deviation
1-2
3-2
than group 1 subjects. The three groups showed similar means regarding refusal of being passengers of an alcoholized driver.
The awareness about the law was the same among the three groups. Two out of three variables regarding the credibility of penalties showed statistically significant effects, although weak, of group 1 when compared to the other two groups. Therefore, the estimated probability of suffering a legal penalty and the perception that people convicted for being alcoholized would be really punished was significantly higher in group 1.
Discussion Discussion Discussion Discussion Discussion
This study aimed to investigate the willingness, defined by the prototype/willingness theory, of driving alcoholized among youngsters about to receive their driving licenses in São Paulo. This study has its limitations such as being restricted to only one city (São Paulo) and to a specific time of the year. It is important to point out, nevertheless, that in our study a considerable number of subjects was interviewed, that São Paulo is the biggest Brazilian
city with a great number of migrants from other states, and that there is no evidence suggesting that the period of the year chosen has differences when compared to the other variables studied. Other aspect that should be mentioned is the fact that the study’s data were collected in 1998. However, the traffic code used at that time is the same used nowadays and drunk driving is still scarcely supervised. It is understood, thus, that the study still represents a first effort to provide data that could contribute for preventive activities regarding driving alcoholized.
This paper was based on parts of the Ph.D. thesis entitled: ‘Driving under the influence of alcohol: risk profile among youngsters from São Paulo city, Brazil’, presented to the Department of Psychiatry, Federal University of São Paulo in 1999.
Financial support: Financial support: Financial support: Financial support:
Financial support: This project was supported by grants from CA-PES/Fulbright (BEX-653/97).
Received in 10.20.2003 Accepted in 07.08.2004
The division of the sample in different risk groups indicated that most participants who drink at least occasionally and admit willingness for the risk behavior of driving alcoholized, also take into account the safe behavior of considering alternatives. This finding agrees with some more recent papers in the international literature. In fact, some authors have pointed out that the behavior of driving alcoholized among youngsters, as well as some risk behaviors in the health area, are not fully intentional or premeditated.7,10 Therefore, it is not surprising that risk and safe behaviors can be found in the same subjects, depending on the circumstances. A study about the sexual behaviors, for example, verified that the combination of subjects feeling sexually stimulated and under the effect of alcohol (vs. sober ones) significantly affected their attitudes, thoughts and intentions of having sex without condoms.11 Similarly, other study showed that intoxicated and sober subjects answered in the same way to wide questions about driving alcoholized, but the former gave more positive answers to a contingent question (‘would you drive a short distance alcoholized?’).12
The fact that a great number of subjects were flexible regarding their future decisions may be seen as positive, suggesting that preventive campaigns may educate and stimulate young drivers to know and consider factors that may affect their decisions and, therefore, increase the possibility of planning in advance alternative behaviors to drive in situations of alcohol consumption. These campaigns should focus not only on young drivers, but also on their social environment. Fathers, mothers, older siblings or other close relatives, besides friends, should be taught to help preventing youngsters to driving alcoholized, stimulating, e.g., their willingness to make interventions and/or to give a lift for alcoholized subjects. As a support for this strategy, one study with youngsters aged 17 to 20 years verified that their attitudes about alternative behaviors, including how much they felt capable of using these alternatives, contributed to explain their future intentions of driving alcoholized.13 A small group of subjects who reported willingness to drive alcoholized admitted lack of disposition for these alternatives. This group is probably composed by people more decided to drive after drinking. Preventive campaigns for this group may suggest a more varied number of alternatives to the behavior of driving alcoholized. It is important to remind that in this study, the questions were related only to two specific alternatives to this behavior. It is probable that the increase in the probability of being arrested by the police and/or of suffering legal penalties be a especially useful perception to prevent this group of driving under the effect of alcohol. In fact, one qualitative study among adolescents showed that besides normative beliefs (believing that many people behave like that), the perception of the existence of supervision and law enforcement is an important factor to influence their decisions of driving under the effect of alcohol.14 Besides investigating which are the alternatives to drunk driving that youngsters would be willing to use, further research should study in which situations subjects would be more or less willing to drive after drinking.15 One study with young adults, for example, pointed that the presence of the wife or girl-friend was relevantly associated with the behavior of avoiding driving alcoholized.16
For the development of measures to reduce the number of accidents related to the consumption of alcoholic beverages, it is important that the strategies adopted be part of wide measures, rather than isolated measures. All this, surely, in a context which takes into account the country’s culture. Brazil is an extremely tolerantcountry regarding alcohol consumption.17-19 What prevails in the country is a total lack of effective regulation for alcoholic beverages. However, in one previous article, it was suggested that there is support among the population for restrictive measures regarding drink and driving.9,20
Conclusion Conclusion Conclusion Conclusion Conclusion
Lastly, this article suggests that most youngsters who are about to receive driving licenses have some willingness to use safe alternatives after consuming alcohol. The international literature and the still timid local preventive action regarding the subject suggest that there is room for educational measures which, added to restrictive measures (increase of supervision) have good possibilities of altering the severe statistics related to driving alcoholized in Brazil.
A c k n o w l e d g e m e n t s A c k n o w l e d g e m e n t s A c k n o w l e d g e m e n t s A c k n o w l e d g e m e n t s A c k n o w l e d g e m e n t s
Robert Pandina, Ph.D. and Detran-SP.
References ReferencesReferences References References
1. Nery Filho A, Medina MG, Melcop AG, Oliveira EM. Impacto do uso de
alcool e outras drogas em vitimas de acidentes de trânsito. Brasília:
ABDETRAN, RAID, CETAD (Centro de Estudos e Terapia do Abuso de Drogas); 1997.
2. Oliveira EM, Melcop AG. Álcool e trânsito. Recife: Instituto RAID, CONFEN (Conselho Federal de Entorpecentes) e DETRAN/PE ; 1997. 3. Carlini-Cotrim B, Chasin AAM. Blood alcohol content (BAC) and death from fatal injury: a study in the metropolitan area of São Paulo, Brazil. J Psychoactive Drugs. 2000;32(3):269-75.
4. Brasil. Lei no. 9.503, de 23 de setembro de 1997, atualizada pela Lei
no. 9.602 de 21 de janeiro de 1998. In: Novo Código de Trânsito
Brasileiro. Editora Livrosul; 1998.
5. Gerrard M, Gibbons FX, Benthim A, Hessling R. A longitudinal study of the reciprocal nature of risk behaviors and cognitions: what you think shapes what you do and vice versa. Health Psychol. 1999;15(5):344-54. 6. Gibbons FX, Gerrard M, Blanton H, Russell DW. Reasoned action and social reaction: willingness and intention as independent predictors of health risk. J Pers Soc Psychol. 1998;74(5):1164-80.
7. Gibbons FX, Gerrard M, Ouelette JA, Burzette R. Cognitive antecendents to adolescent health risk: discriminating between behavioral intention and behavioral willingness. Psychol Health. 1998;13(4):319-39. 8. Fishbein M, Ajzen I. Attitudes and voting behavior: an application of the theory of reasoned action. In: Sepephenson GM, Davis JM, editors. Progress in applied social psychology, Londres: Wiley; 1981. p. 253-313. 9. Labouvie E, Pinsky I. Substance use and driving: the coexistence of risky and safe behaviors. Addiction. 2001;96(3):473-84.
10. Pinsky I, Labouvie E, Pandina R, Laranjeira R. Drinking and driving: pre-driving attitudes and perceptions among Brazilian youth. Drug Alcohol Depend. 2001;62(3):231-7.
11. MacDonald TK, MacDonald G, Zanna MP, Fong GT. Alcohol, sexual arousal, and intentions to use condoms in young men: applying alcohol myopia theor y to risky sexual behavior. Health Psychol. 2000;19(3):290-8.
12. MacDonald TK, Zanna MP, Fong GT. Decision making in altered states: effects of alcohol on attitudes toward drinking and driving. J Pers Soc Psychol. 1995;68(6):973-85.
13. Greening L, Stoppelbein L. Young drivers’ health attitudes and intentions to drink and drive. J. Adolesc Health. 2000;27(2):94-101.
14. Nygaard P, Waiters ED, Grube JW, Keefe D. Why do they do it? A qualitative study of adolescent drinking and driving. Subst Use Misuse. 2003;38(7):835-63.
241
16. Nelson TF, Isaac NE, Kennedy BP, Graham JD. Factors associated with planned avoidance of alcohol-impaired driving in high-risk men. J Stud Alcohol. 1999;60(3):407-12.
17. Carlini-Cotrim B. Contry profile on alcohol in Brazil. In: Riley L, Marshall M. Alcohol and public health in 8 developing countries. Geneva: World Health Organization, 1999. p. 13-35.
18. Pinsky I, Laranjeira R. Alcohol consumption in Brazil: recent public health aspects. Globe. 2003;3(1):17-9.
19. Galduroz JCF, Caetano R. Epidemiologia do uso de alcool no Brasil. Rev Bras Psiquiatr. 2004;26(Suppl 1):3-6.
20. Laranjeira R, Romano M. Consenso brasileiro sobre políticas públi-cas do álcool. Rev Bras Psiquiatr. 2004;26(Suppl 1):68-77.