A Genome-Wide siRNA Screen in Mammalian
Cells for Regulators of S6 Phosphorylation
Angela Papageorgiou1,2,3, Joseph Rapley1,2,3, Jill P. Mesirov4, Pablo Tamayo4, Joseph Avruch1,2,3*
1Department of Molecular Biology, Massachusetts General Hospital, Boston, MA, 02114, United States of America,2Diabetes Unit, Medical Services, Massachusetts General Hospital, Boston, MA, 02114, United States of America, 617–726–6909,3Department of Medicine, Harvard Medical School, Boston, MA, 02115, United States of America,4Broad Institute of MIT and Harvard, 7 Cambridge Center, Cambridge,
Massachusetts, 02142, United States of America *[email protected]
Abstract
mTOR complex1, the major regulator of mRNA translation in all eukaryotic cells, is strongly activated in most cancers. We performed a genome-wide RNAi screen in a human cancer cell line, seeking genes that regulate S6 phosphorylation, readout of mTORC1 activity. Ap-plying a stringent selection, we retrieved nearly 600 genes wherein at least two RNAis gave significant reduction in S6-P. This cohort contains known regulators of mTOR complex 1 and is significantly enriched in genes whose depletion affects the proliferation/viability of the large set of cancer cell lines in the Achilles database in a manner paralleling that caused by mTOR depletion. We next examined the effect of RNAi pools directed at 534 of these gene products on S6-P in TSC1 null mouse embryo fibroblasts. 76 RNAis reduced S6 phosphory-lation significantly in 2 or 3 replicates. Surprisingly, among this cohort of genes the only ele-ments previously associated with the maintenance of mTORC1 activity are two subunits of the vacuolar ATPase and the CUL4 subunit DDB1. RNAi against a second set of 84 targets reduced S6-P in only one of three replicates. However, an indication that this group also bears attention is the presence of rpS6KB1 itself, Rac1 and MAP4K3, a protein kinase that supports amino acid signaling to rpS6KB1. The finding that S6 phosphorylation requires a previously unidentified, functionally diverse cohort of genes that participate in fundamental cellular processes such as mRNA translation, RNA processing, DNA repair and metabolism suggests the operation of feedback pathways in the regulation of mTORC1 operating through novel mechanisms.
Introduction
The Target of Rapamycin (TOR) is a giant protein kinase that functions in two physically dis-tinct, independently regulated complexes. TOR complex 1 (TORC1), the complex directly inhib-ited by rapamycin (when bound to FKBP12), is composed of TOR, raptor and mLst8, although the latter is apparently dispensable [1–3]. TORC1 is the major regulator of mRNA translation in OPEN ACCESS
Citation:Papageorgiou A, Rapley J, Mesirov JP, Tamayo P, Avruch J (2015) A Genome-Wide siRNA Screen in Mammalian Cells for Regulators of S6 Phosphorylation. PLoS ONE 10(3): e0116096. doi:10.1371/journal.pone.0116096
Academic Editor:Daniela Cota, INSERM, FRANCE
Received:September 27, 2014
Accepted:December 4, 2014
Published:March 19, 2015
Copyright:© 2015 Papageorgiou et al. This is an open access article distributed under the terms of the
Creative Commons Attribution License, which permits unrestricted use, distribution, and reproduction in any medium, provided the original author and source are credited.
Data Availability Statement:All relevant data are within the paper and its Supporting Information files.
Funding:This study was supported by NIH grants (CA73818 and DK17776) and institutional funds. JA received funding from the NIH (NIH-R37DK17776 and NIH-R01CA73818). The funders had no role in study design, data collection and analysis, decision to publish, or preparation of the manuscript.
all eukaryotic cells, and also controls autophagy, and transcription by all three RNA polymerases [4]. The regulation of TORC1 activity has been extensively studied; it is rapidly increased by nu-merous mitogenic and growth-promoting stimuli and by cell surface receptors and decreased by stressors of all types [4,5]. Many of these inputs operate by modifying the activity of the Tuberous Sclerosis complex (TSC), a GTPase activator for and negative regulator of Rheb [6]. Rheb is a ras-like GTPase that binds directly to and activates TOR in mammalian complex 1 [7]. Some in-puts, most notably amino acid sufficiency, regulate mTOR predominantly downstream of the TSC [8]. We sought to apply genome-wide RNAi technology to examine whether novel mecha-nisms of TORC1 regulation in mammalian cells remained to be described. As a readout of mTORC1 activity, we used the phosphorylation of the 40S ribosomal protein, S6 [9].
S6 phosphorylation in mammalian cells is catalyzed by the protein kinase RPS6KB1, usually called p70 S6 [10,11], which in turn is activated by sequential phosphorylation by mTOR com-plex1 (most importantly at S6K1(Thr389) and PDPK1 [12,13]. Rapamycin, at low nanomolar concentrations, strongly inhibits S6KB1(Thr389) phosphorylation, kinase activity and S6 phos-phorylation in essentially all cells examined in a highly selective manner [14]. S6K activity is es-pecially sensitive to decreases in mTORC1 kinase activity, as shown by the ability of mTOR ATP site inhibitors to inactivate S6KB1(Thr389)at concentrations well below those needed to cause significant dephosphorylation of 4E-BP(Thr37/Thr46), another direct mTORC1 sub-strate [15]. Whereas the very low abundance of the S6K polypeptide renders S6KB1(Thr389) phosphorylation unsuitable for high throughput immunofluorescence assays of mTORC1 ac-tivity, 40S ribosomal subunits are highly abundant and rpS6 is the most specific and best char-acterized substrate of S6KB1. We used immunofluorescent imaging of Ribosomal protein S6 (rpS6) phosphorylation to screen for regulators of mTOR complex 1. S6 contains up to five sites of serine phosphorylation located near the polypeptide carboxyterminus that are phos-phorylated by increasing S6KB1 activity in a sequential manner, in the order Ser236, 235, 240 244, 247 [9]. We employed a rabbit monoclonal antibody specific for RPS6(Ser235P/Ser236P) and high content microscopy to quantify rpS6 phosphorylation in the pancreatic cancer cell line MIA PaCa-2. Applying a stringent selection, we retrieved nearly 600 genes wherein at least two RNAi gave significant reduction in S6 phosphorylation. To identify mTORC1 regulators that did not require the TSC, we examined which of the elements identified in MIA PaCa-2 cells were also required for S6 phosphorylation in TSC1 null mouse embryo fibroblasts [16]. Among the 534 such gene products examined in TSC1 null MEFs, RNAi pools directed against 76 mRNAs were found to reduce S6 phosphorylation significantly in 2 or 3 replicates. Surpris-ingly, the only elements among this cohort previously associated with the maintenance of mTORC1 activity are two of the numerous subunits of the vacuolar ATPase subunits [17] and DDB1, which functions as a subunit of the CUL4 E3 ligase [18]. RNAis against another 84 TSC1null MEF targets were observed to reduce S6 phosphorylation in only one of three repli-cates. However, an indication that this group also bears attention is the presence of RPS6KB1 itself, as well as MAP4K3, a protein kinase that supports amino acid signaling of mTORC1 to RPS6KB1 [19] and Rac1 [20]. The retrieval in this screen of many gene products not previously associated with altered S6 phosphorylation indicates that mTORC1 is responsive to inputs from numerous intracellular sources through mechanisms that remain to be elucidated.
Materials and Methods
Chemicals and Reagents
Cell lines and Culture conditions
MIA PaCa-2 cells (obtained from American Tissue Culture Collection) were cultured in Dubelcco’s Modified Eagle’s Medium (DMEM) (Gibco/BRL, Bethesda, MD) supplemented with 10% fetal bovine serum (FBS), Hyclone (Hyclone Laboratories, Logan, Utah), horse serum (Gibco/BRL) and 1X Penicillin/ Streptomycin. In experiments employing U2OS and Hela cells, cell culture, RNA and DNA transfection, cell extraction, immunoblotting and im-munoblot quantification were carried out as described previously [15]. De novo protein syn-thesis was measured by the incorporation of medium35S(Methionine+Cysteine) into TCA precipitable protein during 2 hours incubation.
Antibodies
For siRNA screening of S6-P by immunofluorescence, S6 Ribosomal protein (Ser 235-P/236-P) rabbit monoclonal Antibody (2F9) (gift from Cell Signaling Technology), the Alexa Fluor 488 goat anti-rabbit IgG (H+L) highly cross-adsorbed (Invitrogen, Carlsbad, CA) were employed. For Western Blotting antibodies were purchased from Cell Signaling (anti-mTOR, anti-S6K-Thr389, anti-eIF2α-Ser51, anti-eIF2α, anti-4EBP-Ser65, anti-4EBP, anti-TSC1 and anti-TSC2),
Immuno-Biological Laboratories (raptor and PRAS40), Abcam (QARS and anti-Rheb), Proteintech (anti-LARS and anti-REDD1), Santa Cruz Biotechnologies (anti-S6K) and Sigma (anti-α-Tubulin).
siRNA screening
A detailed description of the methods used in the primary screen has been published [21]. For the primary screen, we used the whole si-genome SMARTpool RNAi library Dharmacon li-brary consisted of 21,121 siRNA SMART pools which represent known and predicted human genes and the majority of the human genome (Dharmacon siRNA library (Human genome, G-005000–05), Thermo Fisher Scientific, Lafayette, CO). Each RNAi pool consists of four individ-ual oligonucleotides which target a different region of the same gene.
The Dharmacon library was screened in triplicate by transient reverse transfection of siR-NAs into the Mia-Paca 2 cells. Each assay plate included non-specific targeting control RNAi, the FRAP and PLK1 siGENOME SMART pools. 4l of 1M RNAis were transferred from the li-brary stock plates to each well of 384-well assay plates by using the Velocity 11 Bravo automat-ed liquid handling platform at a final 100nM RNAi concentration. Lipofectamine 2000 (Invitrogen) was used as the transfection reagent and diluted in Opti-MEM at a 1:100 ratio. De-tailed description of transfection procedures employed are found in [21]. On each plate, a min-imum of six positive (TOR) and six negative controls (NS) were placed. Cells were incubated for 72hr at 37C and subjected to IF protocol 72hr post transfection.
Immunofluorescence
Imaging Acquisition and Image Quantification
Fixed, permeabilized cells were imaged on the High Content automated Imaging microscope ImageXpress Micro System (IXM) (Molecular Devices,http://www.moleculardevices.com) at 10X magnification (Fig. 1) and analyzed using the MetaXpress software program (Molecular Devices Inc). The Cell Scoring module was used for analysis and the primary readout for iden-tifying hits was the percent positive cells. This assay focused on cytoplasmic staining. (For addi-tional details see ref.21). Images were analyzed and quantified by using the MetaXpress imaging software.
Fig 1. High-throughput image-based screens for genes regulating the phosphorylation of rpS6.A. Immunofluorescence analysis (IF) of rpS6Ser(235/ 236) phosphorylation. Mia-Paca 2 cells were transfected in 384-well plates with a control, nonspecific RNAis NS1 (upper panel) and (NS2) (lower panel), and RNAi pools directed at S6K, TOR and Raptor, TSC1, TSC2 and PTEN. After 72 hours they were fixed, permeabilized and stained by using a rabbit
monoclonal anti-S6-P(Ser 235/236) primary antibody, detected with secondary anti-rabbit Alexa 488 antibody (green). Nuclei are stained with DAPI (blue). Representative images are shown. B. Quantitation of cytoplasmic S6-P levels. The bars indicate the % of total MIA PaCa-2 cells (estimated by nuclear count) that exhibit cytoplasmic S6-P immunofluorescence at an intensity above an arbitrary threshold (% S6-P positive cells; seemethods). The z’is 0.31 for the combined use of NS1 and NS2; because NS2 gave consistently higher z’than NS1 (e.g., 0.45 vs 0.32 for the experiment shown) NS2 was used exclusively in the primary screen; error bars represent 1S.D.*= p<0.01. C. Flow chart of the primary screen: Summary of the screening, hit analysis and hit selection. 21,121 genes were tested using RNAis composed of pools of 4 RNAi oligos (Dharmacon Library); 72 384-well plates were screened in triplicate (See Table 1). The criteria for a“primary positive”are described in the text (Table 2lists genes not scored due to severe inhibition of proliferation). D. Results of the confirmation screen. From the 1046“primary positives”, 870 genes, including all 161 positive kinases and the top 709 ranked by Q (S3 Table), were examined in a confirmation screen wherein each of the four RNAis was tested individually. The pie chart indicates how many of the potential positive hits were confirmed by 0–4 individual siRNAs (listed inS4 Table).
Data Analysis and Hit Scoring
Analysis of RNAi screening data was performed by use of the spotfire software program li-censed through TIBCO Software Inc.http://www.tibco.comwebcite; Spotfire DecisionSite 9.1.1 for Lead Discovery (TIBCO, Palo Alto, CA).
To identify hits, we used a level of“% positive cells”six standard deviations above or below that of the average value of“% positive cells”in all wells on the plate transfected with a scram-bled RNAi, minimally 16 wells/plate. The z score was calculated by using the formula:
z¼ ðX AVGÞ=ðyStd devÞ
where X =“% positive cells”value corresponding to the specific well, AVG = average value ob-tained from all wells on the plate transfected with a scrambled RNAi, y = the number of Std. Dev chosen, i.e., 6,means“times”.
We selected“potential positives”(S1 Table) employing the following three methods of analy-sis: i)-Hits obtained using the results from all three replicate plates where the absolute value of the z score for the corresponding candidate was equal or above 2 using 6S.D. on at least 2 plates; (37 Plates). ii)-Hits obtained using the results of 2 plates where the absolute value of the z score for the corresponding candidate was equal or above 2 using 6S.D.-this includes plates where a third replicate was lost entirely or was technically unsatisfactory (z’<-0.05); (15 Plates). iii)-Hits obtained by analysis of one plate-because two replicates were lost or one replicate was lost and the second technically unsatisfactory, or because one replicate showed a z’that was far supe-rior in technical quality, with a Z’>0.4 higher than either that of the two other replicate(s); (16 Plates). The potential positive hits were visually confirmed to exclude artifacts that may have skewed the percent positive PS6 values. Wells with out-of-focus images- obvious by visual in-spection and as evident by discordance in the average total cell number among the three plates were also excluded. Genes for which the cell number was decreased by a minimum of two stan-dard deviations corresponding to mTOR, were excluded as potential positives so as to eliminate proliferative failure for reasons other than inhibition of mTOR (S2 Table). Although the false negative rate cannot be estimated with accuracy, it is likely the stringent selection led to rejection of true regulators of S6 phosphorylation. In addition, the z values for the mTOR RNAi positive control averaged across the three replicate plates are more dispersed than the averaged scramble controls and ~38% are less negative than the chosen z cutoff of-2, i.e., scores that would be des-ignated“negative”(Fig. 2).
For all of the wells for which the z was at or above the cut-off value (z = +/- 2), we calculate the probability corresponding to each z by using the formula
Q¼ð1 xÞ100
where x = Absolute value (1-(1-NormalDistribution(z))2). Subsequently, the cumulative probability considering all three assay plates that corresponds to a specific hit was obtained by taking the average of all probabilities.
Confirmation of potential positives in the primary screen
% of“potential positives”identified by concordance of two or more plates as compared with the 25% of“potential positives”identified based on one plate. As regards the false positive rate in the initial screen, the finding that 56 of the 870“primary positives”failed to be confirmed by any of the individual RNAis from the initial RNAi pool provides a minimal estimate of 6.4%. The 182“primary positives”confirmed by only 1 of 4 individual RNAis from the initial pool comprise a mixture of false and true positives in unknown proportion; assuming all to be false positive, the maximal estimate of false positive rate is 27.4% (S4 Table).
Secondary screen
The protocol for RNAi screening in the TSC1 null MEFs was similar to that employed in the primary screen except that RNAi pools were 75nM final concentration. Also, due to the greater
Fig 2. Indicators of Performance in the Primary Screen.A. Scatter plots comparing the percent S6-P positive cells in replicate plates for the entire screen. For each gene, the % S6-P positive cells in one plate is plotted against the value observed in a replicate plate (AvsB, AvsC, BvsC). Blue and red squares are values of %S6-P positive cells after transfection of scramble and mTOR siRNAs respectively, whereas aqua squares correspond to all other genes. The correlation coefficient (R^2 value) range from ~0.62 to ~0.67. B. Distribution of averaged z scores for all genes across the entire screen. Scatter plot comparing the z scores (y axis), averaged for all three replicates plates (numbered on the x-axis) for all genes across the entire screen. Color coding as in A. The cutoff of z+/- 2 is highlighted. Individula plates whose z’was greatly inferior to replicates were eliminated from scoring (see Text andmethods). C. Rank order plot. The averaged z-score for all replicates of all genes screened; primary positives were considered those exhibiting a z score exceeding +/- 2 in 2 or more replicates (~75% of genes) or on one plate chosen because either it was the only plate recovered or it exhibited a z’of>0.4 over the replicates (~25% of genes). The position of selected genes is shown in the rectangular box.
variance observed for the positive and negative controls, the criterion employed for positivity, i.e., a“% S6-P positive cells”two standard deviations from the mean value of the corresponding NS value, is less stringent than that used for the MIA PaCa-2 cells.
RT-PCR
Total RNA was prepared using the RNeasy mini kit (QIAGEN). RNA (ug) was used for cDNA synthesis using SuperScript First-Strand Synthesis System for RT-PCR (invitrogen).
Bioinformatic analysis
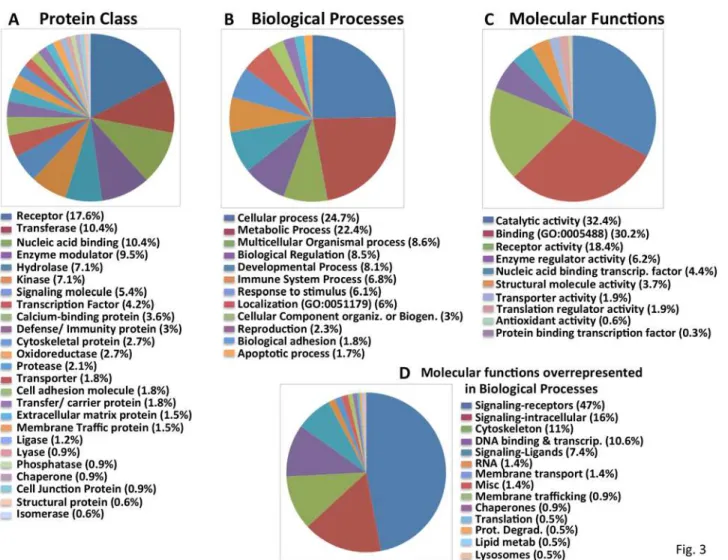
The Panther Classification system was used to categorize hits into molecular function, Biologi-cal processes, Protein Class [22] using the functional classification tool. To determine which categories were enriched in the confirmed hit gene list relative to their representation in whole human genome, the statistical overrepresentation test tool was used and p values were comput-ed using the hypergeometric probability distribution. To access the statistical enrichment or overrepresentation of these categories for the hit genes relative to their representation in the whole human genome and the global set of genes examined in the siRNA screen by using the overrepresentation tool in panther (Fig. 3). Categories with a p-value of<0.05 was considered significant. Additional databases and software programs were used to validate the results ob-tained by PANTHER such as: the Human Protein Reference Database (HPRD), the Ingenuity pathway database, the Biomolecular Interaction Network Database (BIND), the Genego software program.
Results
Primary screen- MIA PaCa-2 human Pancreatic
adenocarcinoma-derived cells
The MIA PaCa-2 cell line was chosen for the high throughput screen because of its constitu-tively high rpS6 phosphorylation levels [23], suitability for immunofluorescent imaging (Fig. 1A), adequate transfectability and predictable proliferative behavior. They are a hypotri-ploid human cell line whose modal chromosome number is 61. Sixteen to 20 marker chromo-somes are commonly found in a cell. A few normal chromochromo-somes are absent. These cells have a KRasG12C mutation and KRas depletion is proapoptotic. There is also loss of CDKN2A and a p53 (R248W) gain-of-function [24] oncogenic mutation that inhibits ATM catalyzed DNA re-pair [25].
RNAi Screening
21,121 genes were screened in triplicate using pools containing 4 RNAi oligonucleotides. Scram-ble RNAi against a non-specific targeting sequence served as the negative control and mTOR RNAi as the positive control [21]. Wells were scored by estimation of the % of cells (DAPI-stained nuclei) whose cytoplasmic rpS6-P fluorescence exceeded a value, optimized to yield the highest signal/noise ratio and optimal plate Z’. Wells containing scramble RNAi averaged 50–
60% %S6-P positive cells, whereas those containing mTOR RNAi averaged 5–10% S6-P positive cells (Fig. 1B). Experimental wells scored as positive were those showing a % S6-P positive cells that was higher or lower than the averaged % S6-P positive cells of the scramble wells on the same plate by a z equal or greater than +/-2, calculated using 6S.D. The screen was performed in triplicate and those genes scoring positive on two or three plates were considered
replicate remaining or because one plate was far superior in technical quality (z’of>0.4 over the replicates), usually because the discounted replicates plates exhibited wide variance in the values for the scramble RNAi (S1 Table).
To exclude the possibility that knockdown of the putative TOR regulators causes toxicity, and to correct for decreased viability effects induced by RNAis we normalized for total cell number as measured by DAPI. Hits for which the average total cell number was 2 S.D. below the average total cell number corresponding to the mTOR positive control were excluded and considered to cause mTOR-independent proliferative failure.
The 95 targets of these RNAi pools (S2 Table) included for e.g.,10 proteins of the 40S ribo-somal subunit, several RNA splicing factors, proteasome subunits. These criteria yielded 1046
“potential positives”(Fig. 1C) of which 220 RNAis resulted in increased rpS6 phosphorylation. It is likely that the relatively high baseline rpS6 phosphorylation levels in the MIA PaCa-2 cells biases against identification of targets whose depletion results in increased S6 phosphorylation.
Fig 3. Classification of the“Confirmed S6-P positives”into functional groups.Categorization of“Confirmed S6-P positives”using the PANTHER classification system into A. Protein Class; B. Molecular Function; C. Biological Processes. D. Manual reclassification by molecular function of the non-redundant“Confirmed S6-P positives”(listed inSupp Table 7) comprising the subcategories of“Biological Processes overrepresented in comparison to the whole genome (shown inS1 Fig.).”
Confirmation of potential positives
All 1046“potential positives”were ranked by the Q value which represents the probability of a hit occurring by chance considering all replicate values (S3 Table, first tab). Of these, 870 were chosen for retesting with each of the four individual RNAi oligonucleotides comprising the original pool; this included all 161“potential positives”from the kinase collection and strongest 709 of the remaining“potential positives.”Consequently, 176, lower confidence“potential pos-itives”were not further evaluated (S3 Table, second tab). In addition, potential positives among the genes identified only by LOC (~2177), FLJ (~450;http://flj.lifesciencedb.jp/top/) or ORF (~1120) designations (seeS1 Table) were excluded from further analysis. Here again we used a criterion of altered % positive cells exceeding a z score of +/-2, which corresponds to 6S.D. the value observed for the scramble RNAi. Six hundred thirty two of 870 (72.6%) were confirmed in 2, 3 or all 4 out of 4 individual RNAi (Fig. 1D). These are henceforth considered as con-firmed“S6-P positives”(S4 Table).
Reproducibility of replicate plates and data quality
Some features of the data derived from the primary screen are shown inFig. 2. Comparison of the“% positive S6-P”scores observed between plates yielded R2values of 0.67 (AvsB) and 0.65 (BvsC) and 0.61 (AvsC), an acceptable level of concordance (Fig. 2A). A plot of the z value for all of the replicate plates used for scoring the primary screen, as described above, shows that whereas the averaged z values of replicate plates for the scramble RNAis tend to cluster tightly around zero, the averaged z values for the mTOR RNAi positive control are much more dis-persed (Fig. 2B). A plot of all 21,121 genes according to the average z value is shown is shown inFig. 2C(and listed inS5 Table).
Confirmed and proposed regulators of PS6 & mTORC1
Among this latter cohort, the RNAi pools for MAP4K3, SQSTM1 and the v-ATPase subunits V1H and V1C were confirmed“S6-P positives.”
Bioinformatics
The 632 confirmed“S6-P positives”were analyzed using the PANTHER program [22] and their distribution according to Protein Class, Biologic Process and Molecular Function is displayed in Fig. 3. Twenty five Protein Classes are represented (Fig. 3A). The subcategories of GPCRs, trans-membrane receptors, protein kinases/transferases and transporters are overrepresented among the“S6-P positives”as compared to the entire genome (S1 Fig.). Approximately 80% of the“S6-P positives”from the Biologic Processes (Fig. 3B) and Molecular Functions (Fig. 3C) fall into 3–6 broad categories. Further analysis of the subcategories comprising Molecular Functions identi-fied the same functional subgroups found to be overrepresented in the Protein Class group (S1 Fig.). However, further analysis of the“S6-P positives”within“Biological Processes”identifies more numerous and seemingly diverse subcategories (S1 Fig.). Because these subcategories of Bi-ologic Processes contain overlapping components, we identified the 217 nonredundant“S6-P positives”in those subcategories (S7 Table) and manually reclassified them by molecular func-tion (Fig. 3D). Not surprisingly, GPCRs and other receptors again comprise nearly half of these elements followed by intracellular signaling proteins, especially protein kinases.
Confirmed“S6-P positives”are enriched in“mTOR essential”genes
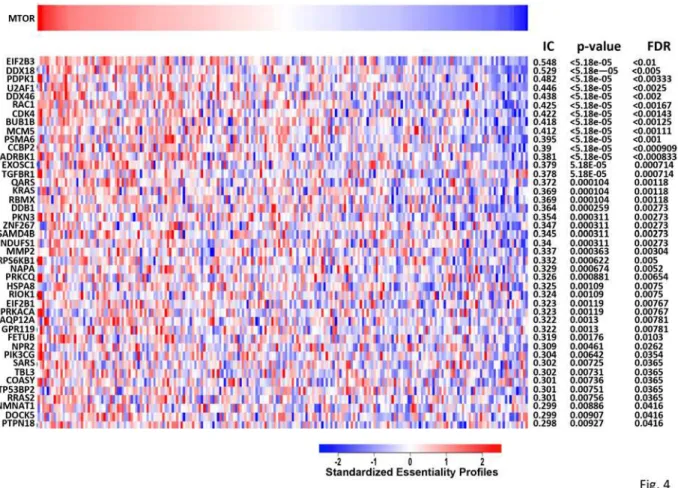
Seeking independent verification that the“confirmed S6-P positives”are enriched in regulators of mTORC1 we utilized the Achilles dataset [35; release 2.4.1 available atwww.broadinstitute. org/achilles)] which enabled an inquiry of how shRNA mediated depletion of“confirmed S6-P positives”affects the proliferation/viability of a large number of cancer cell lines in comparison to depletion of mTOR. Among the 632“confirmed S6-P positives,”193 have been analyzed in 216 cell lines. For each gene in this subset of“confirmed S6-P positives”its essentiality in each of the 216 cell lines was determined [36,37] and matched against the essentiality profile for mTOR itself (Fig. 4) using as association statistic the normalized mutual information [38]; nominal p-values and False Discovery Rates (FDR) were computed using an empirical permutation test. From the 193“confirmed S6-P positives,”43 were found to match the mTOR essentiality profile in the 216 cancer cell lines at the 0.05 False Discovery Rate (FDR) level of significance. To assess whether the finding that 43 of 193“confirmed S6-P positives”exhibit coessentiality with mTOR at this level of significance (FDR<0.05, IC>0.298) exceeds what would be expected from a ran-dom set of 193 genes, we applied a hypergeometric distribution test to the 6143 genes in the Achilles 2.4.1 dataset and obtained a p-value of 0.0025. Thus the randomly chosen subset of 193
“confirmed S6-P positives”is significantly enriched in genes whose depletion affects the viability of 216 cell lines in a manner paralleling that caused by mTOR depletion. Inasmuch as depletion of these 193 genes also suppresses S6 phosphorylation, we conclude that“confirmed S6-P posi-tives”are significantly enriched in regulators of mTORC1.
In addition, the co-essentiality association revealed by this analysis indicates that cancer cell lines more sensitive to mTOR RNAi knockout are similarly sensitive to knockout of the 43 spe-cific genes displayed inFig. 4. These genes might help delineate a state characterized by co-dependency of mTOR and the respective S6-P positive genes in regards to cell proliferation and viability.
Secondary screen-TSC1 null mouse embryo fibroblasts
Confirmation of S6-P positives in a secondary screenand half-life, etc. we designed a secondary screen to determine which among the elements im-portant for S6 phosphorylation in Mia PaCa-2 cells was imim-portant to the maintenance of phos-pho-S6 in a line of spontaneously immortalized TSC1 null mouse embryonic fibroblasts (MEFs) [16]. The high basal median S6-P positivity of TSC1 null MEFs (Fig. 5) interdicts eval-uation of MIA PaCa-2“S6-P positives”that increase S6-P, however this secondary assay, in ad-dition to employing different RNAis in different cell backgrounds and requiring conservation of function across human and mouse, presumably eliminates stimulatory inputs acting through TSC and focuses attention toward pathways whose inputs are more likely to act between Rheb-GTP and rpS6-P.
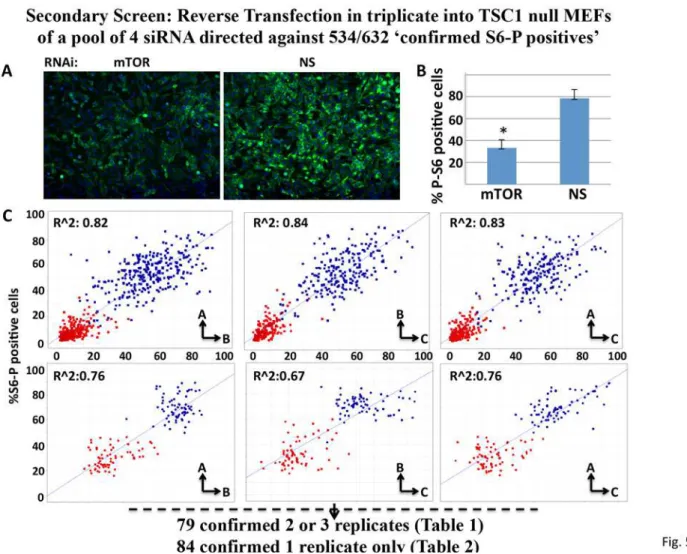
Mouse RNAi pools corresponding to 534 (seeS8 Table) of the 632 confirmed S6-P positives in the MIA PaCa-2 screen were available and were tested in triplicate. As compared with MIA PaCa-2 cells, the TSC1-null MEFs exhibit higher median“%S6-P positive”cells (Fig. 5A-C), but a more variable and less robust suppression of“%S6-P positive”cells in response to mTOR RNAi (Fig. 5C, compare the red squares in the upper panels to those in the lower panels). This likely reflects less efficient and more variable transfection and results in a smaller dynamic
range of S6 phosphorylation. We therefore applied a less stringent selection criterion as com-pared with the MIA PaCa-2 cells, i.e. altered rpS6-P>2S.D. from the scramble on at least 2 out of the 3 replicate plates, which yielded 76 hits (Table 1); an additional 84 scored positive on 1/3 plates (Table 2).
Three of the mRNAs that showed significantly reduced %S6-P positive in 2 or 3 of 3 repli-cates (henceforth called MEF2/3 positives) (Shfm1, Urm1 and Atp6v1c1), in addition to Tor, are orthologous to genes identified by Parsons et.al. [39], whose deletion confers rapamycin sensitivity in haploid strains of S. cerevisiae. Both the MEF 2/3 positives (Table 1; U2af1, Mcm5, Ddb1 and Ptpn18) and the MEF single positives (Table 2; Eif2b3, Rac1, Rps6kb1, Coasy) include 4 genes that exhibit“co-essentiality”with mTOR in the Achilles database (Fig. 4).
Fig 5. Performance Properties of the siRNA Screen using TSC1 null MEFs.A. Representative Immunofluorescence images of rpS6Ser (235/236) phosphorylation in TSC1 null MEFs transfected with nonspecific (NS) or mTOR-directed siRNAs. The cells were stained with DAPI (blue) and for rpS6(Ser 235P/236P) (green) as inFig. 1A. B. Quantitation of“%S6-P positive cells”for the TSC1 null MEFs treated with nonspecific (NS) or mTOR-directed siRNAs. Values represent the average of 42 replicate wells +/- 1S.D, for each NS and mTOR siRNA;*p = 0.05 based on two-tailed student’s t-test. C. Comparison of
MiaPaCa cells (upper three plots) and into TSC1 null MEFs (lower three plots) for“%S6-P positive cells”after transfection with nonspecific (blue squares) and mTOR (red squares) siRNA. Scatter plots comparing the positive (mTOR) and negative (NS) controls among replicate plates The MEFs exhibit higher average initial“%S6-P positive cells”but less potent and more variable suppression of“%S6-P positive cells”by mTOR siRNA.
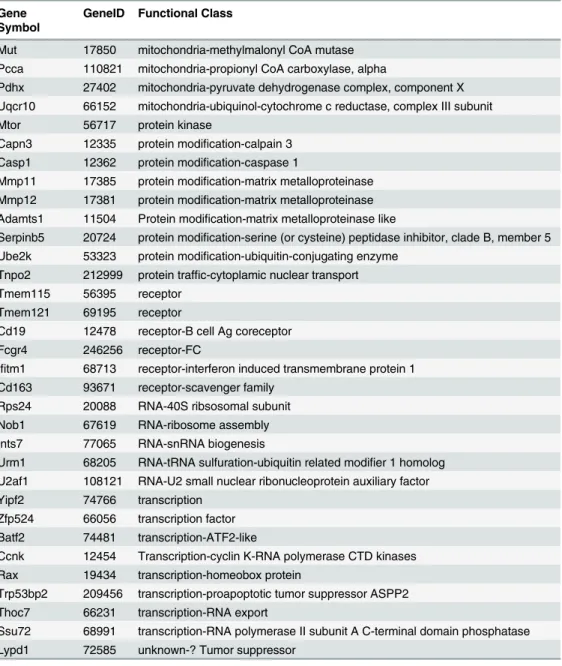
Table 1. Genes in Tsc1 null MEFs scoring positive in 2 or more replicates.
Gene Symbol
GeneID Functional Class
Tagln3 56370 cytoskeleton-actin binding Myl7 17898 cytoskeleton-myosin light chain Myo3b 329421 cytoskeleton-non-muscle myosin Tekt2 24084 cytoskeleton-spindle assembly Tuba3 22144 cytoskeleton-tubulin
Dncic1 13426 cytroskeleton-Dynein subunit
Actl6b 83766 DNA modif-transcription-chromatin remodeling
Fen1 14156 DNA modification-flap structure-specific endonuclease 1
Smarcal1 54380 DNA modification-SWI/SNF related matrix associated, actin dependent chromatin regulator
Dnttip1 76233 DNA modification-terminal transferase interacting protein Top3b 21976 DNA modification-topoisomerase 3
Wrn 22427 DNA modifocation-helicase
Shfm1 20422 DNA repair via BRCA2; also protein modification and RNA export Ddb1 13194 DNA repair; protein ubiquitination
Mcm5 17218 DNA replication Gpr1 241070 GPCR-chemerin
Ccr3 12771 GPCR-chemokine receptor Gpr23 78134 GPCR-Lysophosphatidic acid Olfr410 258702 GPCR-olf
Oxtr 18430 GPCR-oxytocin
Ffar3 233080 GPCR-short chain fatty acids Gpr3 14748 GPCR-sphingosine 1-phosphate
Sphk1 20698 intracellualr signaling-sphingosine-1 kinase
Strada 72149 intracellular signaling- AMPK cofactor; STE20-related kinase adapter protein alpha
Pla2g2e 26970 intracellular signaling- Phospholipase A variant Limd2 67803 intracellular signaling-binds protein kinase ILK Edaradd 171211 intracellular signaling-EDAR associated protein
Gnefr 27414 intracellular signaling-exocyst-secretion regulating guanine nucleotide exchange factor
Rgl2 19732 intracellular signaling-guanyl nucleotide exchanger for Ral GTPases Pla2g3 237625 intracellular signaling-Phospholipase A variant
Bmp8a 12163
ligand-Uvrag1 78610 membrane traffic-activates the Beclin1-PI(3)KC3 complex to promote autophagy Rab3a 19339 membrane traffic-Rab GTPase
Tmem38b 52076 membrane transport—TRIC-B cation channel Grik5 14809 membrane transport-ionotropic glutamate receptor Atp6v1c1 66335 membrane transport-v-ATPase subunit
Atp6v1h 108664 membrane transport-v-ATPase subunit
Mfsd10 68294 membrane-transport-major facilitator superfamily domain-containing protein 10 Cel 12613 metabolism-carboxyl ester(lipid) esterase
Fabp4 11770 metabolism-fatty acid binding
Ugcg 22234 metabolism-UDP-glucose ceramide glucosyltransferase
Slc25a24 229731 mitochondria-calcium dependent ATP-Mg2 uptake to buffer mito calcium Gtpbp8 66067 mitochondria-GTP-binding protein 8, Gtpbp8
Glutamine tRNA synthase/QARS
We were intrigued by the finding that depletion of Glutamine tRNA synthase/QARS gives strong inhibition of S6-P in MIA PaCa-2 cells and is also high on the list of genes whose deple-tion affects the proliferadeple-tion of the Achilles cancer cell cohort in a manner similar to mTOR de-pletion (Fig. 4). In contrast, RNAi directed at Leucyl tRNA synthase, which has been
previously reported as a positive regulator of TORC1 [40], did not give significant inhibition of S6-P. Similar results were observed in U2OS and HeLa cells (Fig. 6A, top): in U2OS, 90–95% reduction of QARS reduced amino acid-stimulated S6K(T389) phosphorylation by 70–80%, whereas 85–90% depletion of LARS gave a 0–25% reduction (Fig. 6A, bar graphs). Despite the marked depletion of both QARS and LARS, the phosphorylation of eIF2α(Ser51) was not in-creased. The latter is an indication that the accumulation of uncharged tRNA, if any, was
Table 1. (Continued) Gene
Symbol
GeneID Functional Class
Mut 17850 mitochondria-methylmalonyl CoA mutase Pcca 110821 mitochondria-propionyl CoA carboxylase, alpha
Pdhx 27402 mitochondria-pyruvate dehydrogenase complex, component X Uqcr10 66152 mitochondria-ubiquinol-cytochrome c reductase, complex III subunit Mtor 56717 protein kinase
Capn3 12335 protein modification-calpain 3
Casp1 12362 protein modification-caspase 1
Mmp11 17385 protein modification-matrix metalloproteinase Mmp12 17381 protein modification-matrix metalloproteinase Adamts1 11504 Protein modification-matrix metalloproteinase like
Serpinb5 20724 protein modification-serine (or cysteine) peptidase inhibitor, clade B, member 5 Ube2k 53323 protein modification-ubiquitin-conjugating enzyme
Tnpo2 212999 protein traffic-cytoplamic nuclear transport Tmem115 56395 receptor
Tmem121 69195 receptor
Cd19 12478 receptor-B cell Ag coreceptor Fcgr4 246256 receptor-FC
Ifitm1 68713 receptor-interferon induced transmembrane protein 1 Cd163 93671 receptor-scavenger family
Rps24 20088 RNA-40S ribsosomal subunit Nob1 67619 RNA-ribosome assembly Ints7 77065 RNA-snRNA biogenesis
Urm1 68205 RNA-tRNA sulfuration-ubiquitin related modifier 1 homolog U2af1 108121 RNA-U2 small nuclear ribonucleoprotein auxiliary factor Yipf2 74766 transcription
Zfp524 66056 transcription factor Batf2 74481 transcription-ATF2-like
Ccnk 12454 Transcription-cyclin K-RNA polymerase CTD kinases Rax 19434 transcription-homeobox protein
Trp53bp2 209456 transcription-proapoptotic tumor suppressor ASPP2 Thoc7 66231 transcription-RNA export
Ssu72 68991 transcription-RNA polymerase II subunit A C-terminal domain phosphatase Lypd1 72585 unknown-? Tumor suppressor
Table 2. Genes in Tsc1 null MEFs scoring positive in one of three replicates.
Gene Symbol GeneID Functional class
Fkbp5 14229 chaperone
Fkbp6 94244 chaperone
Actg2 11468 cytoskeleton-actin
Gmfg 63986 cytoskeleton-cofilin family
Smc1a 24061 DNA structure
Mcm3 17215 DNA-replication
Gpr82 319200 GPCR-lower food intake in KO
Gpr147 237362 GPCR-neuropeptide FF
Avpr1B 26361 GPCR-AVP
Crhr1 12921 GPCR-CRH
Celsr2 53883 GPCR-flamingo type EC domain
Gcgr 14527 GPCR-glucagon
Gpr48 107515 GPCR-LGR4
Lhcgr 16867 GPCR-LH
Mtnr1b 244701 GPCR-Melatonin
Olfr15 18312 GPCR-olf
Olfr152 258640 GPCR-olf
Olfr42 18341 GPCR-olf
P2ry6 233571 GPCR-pyrimidinergic
Tact3 21338 GPCR-tachykinin
Vipr1 22354 GPCR-VIP
Fzd3 14365 GPCR-Wnt
Impa2 114663 intracellular signaling-inositol(myo)-1(or 4)-monophosphatase 2
Mapk8ip2 60597 intracellular signaling-kinase scaffold
Plcg1 18803 intracellular signaling-phospholipase C, gamma 1
Pde1b 18574 intracellular signaling- CM-dependent Pde1B
Orai2 269717 intracellular signaling-Ca++release-activated Ca++channel
Itpkc 233011 intracellular signaling-inositol-trisphosphate 3-kinase C
Ikbkb 16150 intracellular signaling-NFKB pathway
Seh1l 72124 intracellular signaling-NPC Nup107–160 complex; GATOR2 complex
Ptpdc1 218232 intracellular signaling-protein tyrosine phosphatase domain containing 1
Rac1 19353 intracellular signaling-small GTPase
Bcar3 29815 intracellular signaling; SH2 domain
Calb1 12307 intracellulat signaling-cytosolic Ca++binder/buffer
Akap7 268287 intrecellular signaling-PKA anchor protein
Ccl4 20303 ligand-chemokine
Vwc2 319922 ligand-secreted BMP antagonist
Srpx2 68792 matrix-Chondroitin sulfate proteoglycan
Dspp 13517 matrix-dentin sialophosphoprotein
Cln3 12752 membrane structure-lysosomal
Nsmaf 18201 membrane structure-neutral sphingomyelinase activation associated factor
Pik4cb 107650 membrane structure-phosphatidylinositol 4-kinase, beta
Tjp2 21873 membrane structure-tight junction protein
Slc35f1 215085 membrane transport-?nucleotide sugars
Slc44a4 70129 membrane transport-thiamine pyrophosphate transporter.
Pfkfb3 170768 metabolism-6-phosphofructo-2-kinase/fructose-2,6-biphosphatase 3
insufficient to activate the GCN2 kinase (Fig. 6Abottom). Depletion of either QARS or LARS did not alter levels of the Rheb, mTOR, raptor, or S6K polypeptides, nor was the abundance of the very short-lived polypeptide REDD1 diminished (Fig. 6A). These findings suggested that RNAi-induced depletion of these AARSs did not reduce protein synthesis. Although, this held true subsequent to LARS depletion, the same effect on protein synthesis was not observed for QARS depletion. Depletion of QARS polypeptide from serum and nutrient replete U2OS in-hibited protein synthesis by 65–75% as measured by35S-Met+35Cys incorporation into protein
Table 2. (Continued)
Gene Symbol GeneID Functional class
Coasy 71743 metabolism-CoA synthase
Gpx2 14776 metabolism-glutathione peroxidase 2
Pank4 269614 metabolism-pantothenate kinase 4
Galntl4 233733 metabolism-polypeptide N-acetylgalactosaminyltransferase 18
Tpk1 29807 metabolism-thiamin pyrophosphokinase 1
Nfu1 56748 mitochondria-NFU1 iron-sulfur cluster scaffold homolog
Aldh18a1 56454 mitochondrial-proline, ornithine and arginine biosynthesis
Pink1 68943 mitochondrial-protein kinase
Ufd1l 22230 protein degradation-modification
Cdk3 69681 protein kinase-cell cycle regulation
Irak3 73914 protein kinase-IL1 receptor associated
Pim2 18715 protein kinase-overlaps specificity of Akt
Ripk5 213452 protein kinase-DUSTY like
Src 20779 protein kinase-tyrosine
Stk23 56504 protein kinase-SRSF proteins
Map4k3 225028 protein kinase-GLK
Map4k1 26411 protein kinase-HPK1
Map3k10 269881 protein kinase-MLK2
Rps6kb1 72508 protein kinase-S6
Cd3e 12501 receptor-T cell Ag
Acvr2 11480 receptor-ActivinA type
Fgfr3 14184 receptor-FGF
Cd244 18106 receptor-NK cell
Cd8a 12525 receptor-T cell
Rbm12 75710 RNA binding protein
Tdrd12 71981 RNA-piRNA biogenesis factor
Rpp25 102614 RNA-ribonuclease P subunit
Tnrc6 233833 RNA-RNAi and miRNA
Tars2 71807 RNA-Tars2 threonyl-tRNA synthetase 2, mitochondrial (putative)
Eif2b3 108067 RNA-translation initiation factor
Bhlhb9 70237 transcription factor
Nrbp 192292 transcription- nuclear receptor binding protein 1
Ccdc134 76457 Transcription-Cotranscriptional regulator-? Secreted protein
Tlx3 27140 transcription-homeobox protein
Med25 75613 Transcription-mediator of RNA polymerase II transcription, subunit 25
Smr3a 20599 submaxillary gland androgen regulated protein 3A
Sbsn 282619 unknown
Trabd 67976 unknown-TraB domain containing, TRABD
(Fig. 6B). QARS depletion led to inhibition of overall protein synthesis and S6K phosphoryla-tion (T389-P), whereas comparable deplephosphoryla-tion of LARS inhibited neither. The differential effects on protein synthesis between the two AARS raised the question of whether reduced S6K phos-phorylation (T389-P) caused by QARS depletion is due to the inhibition of protein synthesis. Brief treatment of cells with the inhibitor of global mRNA translation cycloheximide is known to activate mTORC1 [41], although the effect of sustained inhibition of protein synthesis of a magnitude comparable to that corresponding to QARS depletion is not known. U2OS cells
Fig 6. siRNA-mediated depletion of QARS inhibits mTORC1 signaling.A. The effect of mTOR, QARS and LARS siRNA upon polypeptide knockdown and S6K-Thr389phosphorylation. U2OS and Hela cells were transfected with siRNA oligos against mTOR, QARS (Q1,Q2), LARS(L1,L2) and a scramble control. After 72h amino acids were withdrawn for 2 hours and added back for 15 minutes as indicated. Cells extracts were subjected to SDS-PAGE and membranes were immunoblotted with the antibodies as indicated. The bar graphs display the combined results of three experiments (mean-/+ 1 S.D.; ** = p<0.0001 and * = p<0.002 vs scramble) The experiment shown in the bottom panels compares the effects of Thapsigargin (10M) with the indicated siRNAs on S6K-P (fourth from top), eIF2α(Ser51-P) (third from bottom) and the abundance of REDD1 (bottom). B. siRNA-mediated depletion of QARS inhibits global
protein synthesis. Graphical representation of the combined results from three experiments (mean-/+ 1 S.D.) examining the effect, relative to scramble siRNA, of siRNA against mTOR, QARS and LARS on the abundance of the target polypeptides (upper), the relative phosphorylation of S6K-P (middle; ** = p<0.0001 and * = p<0.002 vs scramble) and on overall protein synthesis (bottom) in nutrient and serum replete U2OS cells. Analyses were carried out three days after transfection.35S[Methionine+cysteine] was added two hours before harvest; cycloheximide (CHX, 100
incubated with cycloheximide (10μM for 3 days, to match the duration siRNA treatment)
ex-hibit an 80–90% reduction in total protein accumulation as compared with cells incubated with carrier alone. Under these conditions, the relative abundance of S6K and Rheb are radical-ly reduced, but phosphorylation of the mTORC1-cataradical-lyzed sites S6K (T389) is fractionalradical-ly in-creased: a similar pattern is observed with lactidomycin, a selective inhibitor of translational initiation (not shown). Sustained but nonselective inhibition of protein synthesis does not in-hibit and may activate mTORC1, an effect previously attributed to either an accumulation of cellular amino acids [41] or to loss of the TSC activator REDD1 [42]. It remains to be deter-mined whether the inhibition of mTORC1 by QARS depletion reflects the loss of an mTORC1 activator(s) whose abundance is selectively sensitive to depletion of QARS (or Urm1) or to some non-translational action of QARS.
Discussion
Primary screen
The recovery of a subset of the known elements crucial for S6 phosphorylation together with the significant enrichment of the confirmed“S6-positives”among the genes whose essentiality parallels that of mTOR in a large cohort of cancer cell lines supports the view that the 642 genes identified in the primary screen for regulators of S6 phosphorylation are in fact enriched in regulators of mTOR complex 1. The most heavily enriched categories among the“S6-P posi-tives”retrieved in the primary screen are the cell surface receptors, followed by intracellular sig-naling proteins, especially protein kinases. An enrichment of protein kinases among the“S6-P positives”is not surprising, inasmuch as multiple protein kinases are known to contribute to S6 phosphorylation, especially mTOR, RPS6KB1 and PDPK1 [13], which together with mTOR complex1 catalyzes RPS6KB1 phosphorylation and activation [12]. IKK [43] and PIM2 [44], known inhibitors of the TSC Rheb GAP activity, MAPK11/p38βwhich activates mTORC1 in response to arsenite by phosphorylation of raptor [45] and MAP4K3/Glk, which is implicated in amino acid regulation of mTORC1 [19] are among the S6-P positives as is Casein Kinase 2, which through its action on TEL2, is perhaps important for mTOR complex assembly [46]. Based on published literature, thin but plausible explanations can be inferred for several other of the protein kinases retrieved (e.g., PKC, PKC, PKA, BRSK2/SADA and six tyrosine kinases). Nevertheless, the mechanisms by which depletion of the many other protein kinases (ser/thr) diminishes S6 phoshorylation are not yet evident. The finding that S6 phosphorylation is influ-enced by an unexpectedly large number of protein kinases raises the possibility that a regulato-ry network far more complex than that currently envisioned operates upstream of RPS6K1B. Alternatively, despite the relatively high statistical stringency applied to hit selection, the possi-bility that many of these S6-P positives are in fact not regulators of S6 phosphorylation in the MIA PaCa-2 cells, i.e., are false positives, cannot be discarded.
The recovery of 83 GPCRs among the“S6-P positives”in the primary screen (e.g.,Fig. 3D) was not anticipated. Also retrieved were the GPCR-specific intracellular signaling elements Transducin/GNAT2, Gsα/GNAS, GNB1,3 and 5, GNG3, 5 and 7 and beta arrestin-1/ARRB1. A GPCR regulated pathway to mTORC1 in MiaPaCa cells might operate through Gβγ activa-tion of PI-3 kinaseγ/PI3KCG (an S6-P positive) or viaβ-arrestin recruitment of Src (also an S6-P positive) [47]. As there are nearly 800 GPCRs in the human genome, including nearly 400 olfactory receptors, some are likely to be retrieved as false positives in a primary screen. Never-theless, the prevalence of GPCRs among the S6-P positives exceeds by several fold their repre-sentation in the human genome (~13% vs ~4%) and the basis for this enrichment is
Secondary screen
A relatively small number of perturbations have been shown thus far capable of inhibiting mTORC1 signaling in TSC null cells, including H2O2, sorbitol [48], energy stress (through AMPK phosphorylation of raptor [49] or PRAK phosphorylation of Rheb(Ser130) [50]) and withdrawal of ambient amino acids [51], through an incompletely understood mechanism that involves the RagA or B/C or D heterodimeric GTPases [26,27].
Focusing on the targets in the TSC1-null MEFs confirmed on 2 or more of 3 replicates (Table 1,S2A Fig.), this cohort has proportionately fewer GPCRs (9%) as compared with the confirmed“S6-P positives”from the MIA PaCa-2 cells (13%), and apart from mTOR no pro-tein kinases; however, the 84 targets confirmed on only one of three replicates (Table 2) in-cludes 14 GPCRs (so that GPCRs comprise 13% of combined MEF“S6-P positives,”) and 11 protein kinases, including S6KB1 and MAP4K3/Glk (S2B Fig.). The MEF2/3 cohort does in-clude a diverse array of non-kinase signaling molecules that, with the exception of Stradα, have no known connection to mTORC1 signaling. Stradαis a pseudokinase scaffold necessary for the activity of Lkb1, an upstream activator of AMPK. Stradαdepletion from mouse neural pro-genitor cells activates mTORC1 through loss of AMPK activity [52]. Inasmuch as AMPK in-hibits mTORC1 both by activation of TSC [6] and by direct phosphorylation of raptor [49], it is unclear why depletion of Stradαinhibits S6 phosphorylation in TSC1null MEFs.
Among the MEF2/3 positives with a prior connection to mTORC1 are the v-ATPase sub-units V1C1 and V1H, the ubiquitin-like polypeptide Urm1 and the WD40 domain protein DDB1; we have examined the relation of the vATPase subunits and URM1 with mTORC1 in additional experiments.
v-ATPase subunits V1H & V1C
The retrieval of v-ATPase subunits V1H and V1C as confirmed“S6-P positives”both in the MIA PaCa-2 cells and in the TSC1null MEFs is supportive of the role of the v-ATPase as a posi-tive upstream mTORC1 regulator [17]. We confirmed the ability of RNAi to V1H (but not V1C1) to inhibit S6K(T389P) in U2OS cells (not shown). These v-ATPase subunits, which regu-late rotation of the ATPase assembly, are on the cytoplasmic side of the lysosome and thus avail-able to mTORC1. However we have been unavail-able to detect a specific role for V1H and V1C subunits in mTORC1 localization or activation. In experiments not shown, we found that bind-ing of recombinant V1H with coexpressed mTOR, raptor, Rheb or the Rag heterodimers is not detectable, whereas recombinant V1C1 proved generally sticky. Similarly overexpression of V1H and V1C1 does not modify the phosphorylation of co-expressed S6K in the presence or ab-sence of amino acids, either when these v-ATPase subunits are expressed as the wild type poly-peptides, or when directed to the relevant subcellular compartment either by carboxy terminal fusion of the Rheb carboxy terminal 15 amino acids, or amino terminal fusion of the p18/LAM-TOR1 amino terminal 18 amino acids. Thus, the mechanism by which the v-ATPase promotes mTORC1 activity and the specific role of these subunits, if any, requires further study.
URM1
proteins in response to oxidative stress [55] by a mechanism and specificity that are unknown, or via the mediation of the cytosolic thiouridylase CTU1-CTU2, thiolate uridine at position 34 (the wobble base of the anticodon) of the Glu, Gln and Lys tRNAs [54]. Notably, S. cerevisiae strains lacking Urm1, Uba4(MOCS3), Ncs6(CTU1) and Ncs2(CTU2) each exhibit rapamycin sensitivity [39]. Urm1 deficient strains can be rescued with the rapamycin-resistant TOR2 (S1972I) mutant [56] in S. cerevisiae, or by overexpression of the Glu/Gln/Lys tRNAs, especial-ly in combination in either budding [53] or fission [57] yeast. These findings point to an im-portant role for mistranslation in the genesis of the rapamycin sensitivity.
In the primary and confirmation MIA PaCa-2 screens, both the RNAi pool againstURM1 and all of the four individual RNAi oligonucleotides led to strong inhibition of S6 phosphoryla-tion. In subsequent experiments, URM1 knockdown by RNAi decreased S6K phosphorylation at Thr 389 in U2OS cells (not shown). The RNAi pools againstNFS1andCTU1also gave strong inhibition of S6-P but with an insufficient z, whereas the RNAi pool againstMOCS3 gave no in-hibition and an RNAi pool againstCTU2was not included in the screen (S1 Table). Because of these ambiguous results regarding the elements required for URM1 activation and U34 thiola-tion, we reexamined the impact of the original RNAi pools in comparison tomTORRNAi. In eight experiments (data not shown) wherein mTOR RNAi inhibited S6-P in MIA PaCa-2 cells with z-2 each time, the RNAi pools forNFS1,MOCS3,CTU1andCTU2did so in 7/8, 5/8, 8/ 8 and 4/8 experiments, respectively. In the TSC1null MEFs the RNAi pool againstUrm1gave strong inhibition of S6 phosphorylation, however this proved to be attributable to one of the four individual RNAis. We therefore examined an additional eight individual RNAis directed at Urm1in the TSC1null MEFs; altogether 3/12 RNAis gave consistent inhibition of S6
phosphory-lation. Moreover, RNAi pools againstMocs3,Ctu1andCtu2did not reduce S6-P in TSC1 null MEFs (data not shown). We concluded that the failure of U34 thiolation contributes to the inhi-bition of S6 phosphorylation in MIA PaCa-2 cells, presumably through mistranslation at one or more of the codons for Gln, Glu or Lys in one or more unknown proteins. In contrast to MIA PaCa-2 cells, URM1 deficiency does not impair mTORC1 signaling in TSC1 null MEFs.
DDB1
Interestingly, DDB1 is among the few mouse orthologs retrieved that overlaps with the dTORC1 regulators retrieved by Lindquist et.al. [58] from a genome wide dsRNA screen for S6-P regulators in Drosophila cells. Although first identified in the repair of UV-induced DNA damage, DDB1 is also a component of the CUL4 ubiquitin ligase, whose depletion has been previously shown to inhibit S6 and 4E-BP phosphorylation while upregulating Akt(Ser473) phosphorylation. CUL4 promotes the degradation of REDD1 and TSC2, however these events are irrelevant to mTORC1 regulation in the TSC1 null MEFs. Recently, it has been shown that the DDB1-CUL4 ubiquitination of raptor is required for the stability of the mTOR complex1 [18]. It is unclear whether the loss of this function of DDB1 accounts for the ability of DDB1 RNAi to inhibit S6 phosphorylation, inasmuch as the RNAi pools against the other compo-nents of this ubiquitin ligase, CUL4A and RBX1/ROC1, did not inhibit S6 phosphorylation in MIA PaCa-2 cells (S1 Table).
Other categories of S6-P regulators in TSC1 null MEFs
Mitochondrial Proteinsphosphokinase/TPK1 (Table 2). CoenzmeA Synthase has been detected in a stable complex with S6KB1, but overexpression of COASY does not affect S6K activity and S6K does not phos-phorylate COASY [59]. We have not determined whether depletion of these elements affects ATP content or activates AMPK. In addition, Duran et.al. [60] reported that the inhibition of mTORC1 signaling to S6K1 engendered by withdrawal of leucine could be rescued by provi-sion of esterified verprovi-sions ofαKG. Depletion of Glutamate Dehydrogenase (GLUD1) did not inhibit S6 phosphorylation in Mia-Pa Ca 2 cells. Nevertheless, propionyl CoA carboxylase/ PCCA and methylmalonyl CoA mutase, both of which were confirmed in 2/3 positives in the MEFs (Table 1) constitute an anaplerotic pathway that generates succinate from valine, isoleu-cine and odd chain fatty acids. Tumor cells utilize a variety of anaplerotic mechanisms to re-place the TCA intermediates diverted to macromolecular synthesis [61] and those of most importance to MIA PaCa-2 cells remains to be determined.
DNA repair related hits
The considerable number of MEF2/3 positives concerned with DNA structure and repair (Ta-bles1,2) is unexpected and raises consideration regarding the relationship between DNA dam-age and mTORC1 activity. DNA damdam-age uniformly inhibits mTORC1 by ATM/P53/TSC activation [62], although doxyrubicin-induced DNA damage is reported to activate mTORC1/ S6K through p38αand TSC [63]. These responses however are presumably inoperative in the TSC1 null MEF screen. It is possible that the disordered genetic background of MiaPaCa cells and the TSC1 null MEFs creates a context in which DNA modification and/or repair is re-quired to sustain S6 phosphorylation. However, the underlying mechanism and physiologic relevance of this phenomenon are unknown.
Conclusion
A genome wide screen for S6 phosphorylation has uncovered a large number of gene products whose depletion reduces mTORC1 signaling. Previously identified regulators have been re-trieved, including a number whose orthologues are also necessary for optimal TORC1 signaling in S. cerevisiae, as well as many genes not previously associated with mTORC1 regulation. Ad-ditional work will be required define the specific biochemical pathways that link these elements to mTOR complex 1. Imasmuch as many cancers exhibit mTOR hyperactivation, the identifi-cation of previously unappreciated proteins needed for maintenance of mTORC1 activity may provide new drug targets and lead to the development of beneficial therapies for tumors sensi-tive to mTOR inhibition. The 43 genes found to match the mTOR essentiality profile in the 216 different cancer cell lines represented in the Achilles dataset may help delineate a more general cellular state characterized by co-dependency with mTOR. This finding provides the rationale for selecting this set of genes for further analysis as candidate drug targets and for in-vestigating synthetic lethal relationships with known mTOR inhibitors.
Supporting Information
S1 Fig. Identification of the PANTHER categories overrepresented among the confirmed
“S6-P positives”from MiaPaCa cells.The 632 confirmed“S6-P positive”human genes were analyzed by PANTHER according to Biological Processes, Molecular Function and Protein Class and the subcategories that are enriched over their abundance in the genome are shown, ranked by the—log p value. A non-redundant list of the 217 specific genes comprising the cate-gories shown under Biological Processes is provided in SupplementalS7 Table, and their distri-bution by Molecular Function is shown inFig. 3D.
S2 Fig. Classification by Molecular Function of the S6-P positives identified in TSC1-null mouse embryo fibroblasts.A. Functional categories of S6-P positives confirmed in 2 or more replicates, corresponding toTable 1. B. Functional categories of S6-P positives confirmed in one of three replicates, corresponding toTable 2. C. Functional categories of S6-P positives confirmed in any replicate, corresponding to the combined sets in Tables1and2.
(TIF)
S1 Table. Results of primary screen in MiaPaCa cells.Primary screen, arranged by plate. Avg.% S6P positive shown for each replicate plate. N = scramble RNAi (negative control); P = mTOR RNAi (positive control); X = experimental RNAi.
(XLSX)
S2 Table. RNAi pool positives excluded because cell numbers were reduced>2S.D. below cell number seen with mTOR RNAi.Primary S6P positives not retested due to reduced cell number>2SD below the mTOR RNAi on plates used for scoring. N = scramble RNAi (nega-tive control); P = mTOR RNAi (posi(nega-tive control); X = experimental RNAi.
(XLSX)
S3 Table. 1046“primary S6P positives”from MiaPaCa cells. Sheet A:Primary positives cho-sen for retesting with 4 individual RNAi-seeSupp Table 4; results shown here are from initial testing with RNAi poolSheet B: Primary S6P positives not retested with individual RNAis.
Primary S6P positives NOT selected for retesting with the 4 individual RNAi used in the intial screen.
(XLSX)
S4 Table. Results of retesting 870“primary S6P positives”with individual RNAis.Number of RNAi scoring positive.
(XLSX)
S5 Table. All genes scored in primary screen ranked by avg. z or Q.Rank by avg. z of all genes, including only the plates used for scoring.
(XLSX)
S6 Table. Performance of putatively known mTORC1/S6-P regulators in primary Screen.
The effect of RNAi pools directed against putatively known regulators of S6-P in the MiaPaCa cell primary screen. Blue identifies plates not included in the scoring due to unacceptably low plate z’values.
(XLSX)
S7 Table. Genes comprising the PANTHER subcategories of“Biological Processes”that are overrepresented in comparison to the whole genome (SeeS1 Fig.).The nonredundant Mia-PaCa genes contained in the overrepresented subcategories of Biological Processes (seeS1 Fig.) classified by Molecular Function inFig. 3D.
(XLSX)
S8 Table. 534 genes tested with RNAi pools in TSC1 null Mouse Embryonic Fibroblasts.
RNAi corresponding to 98/632“confirmed S6P positives”identified in the primary screen were unavailable.
Acknowledgments
Supported by NIH grants CA73818 (JA), DK17776 (JA) and institutional funds. We are espe-cially grateful to Cell Signaling Inc. for the gift of Rabbit Monoclonal Antibody (2F9) S6 Ribo-somal protein (Ser 235-P/236-P). We thank Caroline Shamu and acknowledge the ICCB-Longwood Screening facility at Harvard Medical School (esp. S.M. Johnston and J. Nale). We thank Ernest Chin (Dotmatics), Sylvia de Bruin, Aylwin C.Y. Ng, Katja Luck and David E. Hill for discussions and advice.
Author Contributions
Conceived and designed the experiments: JA AP. Performed the experiments: AP JR. Analyzed the data: AP JA JR PT. Contributed reagents/materials/analysis tools: JPM. Wrote the paper: JA AP PT. Designed the software used in analysis: JPM PT.
References
1. Hara K, Maruki Y, Long X, Yoshino K, Oshiro N, et al. (2002) Raptor, a binding partner of target of rapa-mycin (TOR), mediates TOR action. Cell 110: 177–189. PMID:12150926
2. Kim DH, Sarbassov DD, Ali SM, King JE, Latek RR (2002) mTOR interacts with raptor to form a nutri-ent-sensitive complex that signals to the cell growth machinery. Cell 110: 163–175. PMID:12150925 3. Loewith R, Jacinto E, Wullschleger S, Lorberg A, Crespo JL, et al. (2002) Two TOR complexes, only
one of which is rapamycin sensitive, have distinct roles in cell growth control. Mol Cell 10: 457–468. PMID:12408816
4. Laplante M, Sabatin DM (2012) mTOR signaling in growth control and disease Cell 149: 274–293. doi:
10.1016/j.cell.2012.03.017PMID:22500797
5. Shimobayashi M, Hall MN (2014) Making new contacts: the mTOR network in metabolism and signal-ing crosswalk. Nat Rev Mol Cell Biol 15: 155–162. doi:10.1038/nrm3757PMID:24556838
6. Huang J, Manning BD (2008) The TSC1-TSC2 complex: a molecular switchboard controlling cell growth. Biochem J 412: 179–190. doi:10.1042/BJ20080281PMID:18466115
7. Long X, Lin Y, Ortiz-Vega S, Yonezawa K, Avruch J (2005) Rheb binds and regulates the mTOR ki-nase. Curr Biol 15: 702–713. PMID:15854902
8. Roccio M, Bos JL, Zwartkruis FJ (2006) Regulation of the small GTPase Rheb by amino acids. Onco-gene 25: 657–664. PMID:16170341
9. Meyuhas O (2008) Physiological roles of ribosomal protein S6: one of its kind. Int Rev Cell Mol Biol 268: 1–37. doi:10.1016/S1937-6448(08)00801-0PMID:18703402
10. Meyuhas O, Dreazen A (2009) Ribosomal protein S6 kinase from TOP mRNAs to cell size. Prog Mol Biol Transl Sci 90: 109–153. doi:10.1016/S1877-1173(09)90003-5PMID:20374740
11. Magnuson B, Ekim B, Fingar DC (2012)Regulation and function of ribosomal protein S6 kinase (S6K) within mTOR signalling networks. Biochem J 441: 1–21. doi:10.1042/BJ20110892PMID:22168436 12. Isotani S, Hara K, Tokunaga C, Inoue H, Avruch J, et al. (1999) Immunopurified mammalian target of
rapamycin phosphorylates and activates p70 S6 kinase alpha in vitro. J Biol Chem 274: 34493–34498. PMID:10567431
13. Alessi DR, Kozlowski MT, Weng QP, Morrice N, Avruch J (1998) 3-Phosphoinositide-dependent pro-tein kinase 1 (PDK1) phosphorylates and activates the p70 S6 kinase in vivo and in vitro. Curr Biol 8: 69–81. PMID:9427642
14. Price DJ, Grove JR, Calvo V, Avruch J, Bierer BE (1992) Rapamycin-induced inhibition of the 70-kilo-dalton S6 protein kinase. Science 257: 973–977. PMID:1380182
15. Rapley J, Oshiro N, Ortiz-Vega S, Avruch J (2011) The mechanism of insulin-stimulated 4E-BP protein binding to mammalian target of rapamycin (mTOR) complex 1 and its contribution to mTOR complex 1 signaling. J Biol Chem 286: 38043–38053. doi:10.1074/jbc.M111.245449PMID:21914810 16. Kwiatkowski DJ, Zhang H, Bandura JL, Heiberger KM, Glogauer M, et al. (2002) A mouse model of
TSC1 reveals sex-dependent lethality from liver hemangiomas, and up-regulation of p70S6 kinase ac-tivity in Tsc1 null cells. Hum Mol Genet 11: 525–534. PMID:11875047
17. Zoncu R, Zoncu R, Bar-Peled L, Efeyan A, Wang S, et al. (2011) mTORC1 senses lysosomal amino acids through an inside-out mechanism that requires the vacuolar H(+)-ATPase. Science 334: 678–
18. Hussain S, Feldman AL, Das C, Ziesmer SC, Ansell SM, et al. (2013) Ubiquitin hydrolase UCH-L1 de-stabilizes mTOR complex 1 by antagonizing DDB1-CUL4-mediated ubiquitination of raptor. Mol Cell Biol 33: 1188–1197. doi:10.1128/MCB.01389-12PMID:23297343
19. Yan L, Mieulet V, Burgess D, Findlay GM, Sully K, et al. (2010) PP2A T61 epsilon is an inhibitor of MAP4K3 in nutrient signaling to mTOR. Mol Cell 37: 633–642. doi:10.1016/j.molcel.2010.01.031 PMID:20227368
20. Saci A, Cantley LC, Carpenter CL (2011)Rac1 regulates the activity of mTORC1 and mTORC2 and controls cellular size. Mol Cell. 42: 50–61. doi:10.1016/j.molcel.2011.03.017PMID:21474067 21. Papageorgiou A, Avruch J (2012) A genome-wide RNAi screen for polypeptides that alter rpS6
phos-phorylation. Methods Mol Biol 821: 187–214. doi:10.1007/978-1-61779-430-8_11PMID:22125066 22. Mi H Mi H, Muruganujan A, Thomas PD. Mi H, et al. (2013) PANTHER in 2013: modeling the evolution
of gene function, and other gene attributes, in the context of phylogenetic trees. Nucleic Acids Res 41 (Database issue):D377–386. doi:10.1093/nar/gks1118PMID:23193289
23. Grewe M, Gansauge F, Schmid RM, Adler G, Seufferlein T (1999) Regulation of cell growth and cyclin D1 expression by the constitutively active FRAP-p70s6K pathway in human pancreatic cancer cells. Cancer Res 59: 3581–3587. PMID:10446965
24. Deer EL, González-Hernández J, Coursen JD (2010) Phenotype and genotype of pancreatic cancer cell lines. Pancreas 39: 425–435. doi:10.1097/MPA.0b013e3181c15963PMID:20418756
25. Song H, Hollstein M, Xu Y (2007) p53 gain-of-function cancer mutants induce genetic instability by inac-tivating ATM. Nat Cell Biol 9: 573–580. PMID:17417627
26. Sancak Y, Peterson TR, Shaul YD, Lindquist RA, Thoreen CC, et al. (2008) The Rag GTPases bind raptor and mediate amino acid signaling to mTORC1. Science 320: 1496–1501. doi:10.1126/science. 1157535PMID:18497260
27. Kim E, Goraksha-Hicks P, Li L, Neufeld TP, Guan KL (2008) Regulation of TORC1 by Rag GTPases in nutrient response. Nat Cell Biol 10: 935–945. doi:10.1038/ncb1753PMID:18604198
28. Sancak Y, Bar-Peled L, Zoncu R, Markhard AL, Nada S, et al. (2010) Ragulator-Rag complex targets mTORC1 to the lysosomal surface and is necessary for its activation by amino acids. Cell 141: 290–
303. doi:10.1016/j.cell.2010.02.024PMID:20381137
29. Bar-Peled L, Schweitzer LD, Zoncu R, Sabatini DM (2012) Ragulator is a GEF for the rag GTPases that signal amino acid levels to mTORC1. Cell 150: 1196–1208. doi:10.1016/j.cell.2012.07.032PMID: 22980980
30. Bar-Peled L, Chantranupong L, Cherniack AD, Chen WW, Ottina KA, et al. (2013) A Tumor suppressor complex with GAP activity for the Rag GTPases that signal amino acid sufficiency to mTORC1. Science 340: 1100–1106. doi:10.1126/science.1232044PMID:23723238
31. Duran A, Amanchy R, Linares JF, Joshi J, Abu-Baker S, et al. (2011) p62 is a key regulator of nutrient sensing in the mTORC1 pathway. Mol Cell 44: 134–146 doi:10.1016/j.molcel.2011.06.038PMID: 21981924
32. Ögmundsdóttir MH, Heublein S, Kazi S, Reynolds B, Visvalingam SM, et al. (2012) Proton-assisted amino acid transporter PAT1 complexes with Rag GTPases and activates TORC1 on late endosomal and lysosomal membranes. PLoS One 7:e36616. doi:10.1371/journal.pone.0036616PMID: 22574197
33. Tsun ZY, Bar-Peled L, Chantranupong L, Zoncu R, Wang T, et al. (2013) The folliculin tumor suppres-sor is a GAP for the RagC/D GTPases that signal amino acid levels to mTORC1. Mol Cell 52: 495–
505. doi:10.1016/j.molcel.2013.09.016PMID:24095279
34. Kim YM, Stone M, Hwang TH, Kim YG, Dunlevy JR, et al. (2012) SH3BP4 is a negative regulator of amino acid-Rag GTPase-mTORC1 signaling. Mol Cell 46: 833–846. doi:10.1016/j.molcel.2012.04. 007PMID:22575674
35. Cheung HW, Crowley GS, Weir BA, Boehm JS, et.al. (2011) Systematic investigation of genetic vulner-abilities across cancer cell lines reveals lineage-specific dependencies of ovarian cancer. Proc Natl Acad Sci USA 108: 12372–12377. doi:10.1073/pnas.1109363108PMID:21746896
36. Shao DD, Tsherniak A, Gopal S, Weir BA, Tamayo P, et.al. (2013) ATARIS: computational quantifica-tion of gene suppression phenotypes from multisample RNAi screens. Genome Res 23: 665–678. doi: 10.1101/gr.143586.112PMID:23269662
37. Cowley GS, Weir BA, Vasquez F, Tamayo P, Scott JA, et al. (2014) Parallel genome-scale loss of func-tion screens in 216 cancer cell lines for the identificafunc-tion of context-specific genetic dependencies. Sci. Data 1:140035 doi:10.1038/data.2014.35
39. Parsons AB, Brost RL, Ding H, Li Z, Zhang C, et al. (2004) Integration of chemical-genetic and genetic interaction data links bioactive compounds to cellular target pathways. Nat Biotechnol 22: 62–69.
PMID:14661025
40. Han JM, Jeong SJ, Park MC, Kim G, Kwon NH, et al. (2012) Leucyl-tRNA synthetase is an intracellular leucine sensor for the mTORC1-signaling pathway. Cell 149: 410–424. doi:10.1016/j.cell.2012.02.044 PMID:22424946
41. Beugnet A, Tee AR, Taylor PM, Proud CG (2003) Regulation of targets of mTOR (mammalian target of rapamycin) signalling by intracellular amino acid availability Biochem J 372(Pt 2): 555–566. PMID: 12611592
42. Kimball SR, Do AN, Kutzler L, Cavener DR, Jefferson LS (2008) Rapid turnover of the mTOR complex 1 (mTORC1) repressor REDD1 and activation of mTORC1 signaling following inhibition of protein syn-thesis. J Biol Chem 283: 3465–3475. PMID:18070882
43. Lee DF, Kuo HP, Chen CT, Hsu JM, Chou CK, et al. (2007) IKK beta suppression of TSC1 links inflam-mation and tumor angiogenesis via the mTOR pathway. Cell 130: 440–455. PMID:17693255 44. Lu J, Zavorotinskaya T, Dai Y, Niu XH, Castillo J, et al. (2013) Pim2 is required for maintaining multiple
myeloma cell growth through modulating TSC2 phosphorylation. Blood 122: 1610–1620. doi:10.1182/ blood-2013-01-481457PMID:23818547
45. Wu XN, Wang XK, Wu SQ, Lu J, et al. (2011) Phosphorylation of Raptor by p38beta participates in ar-senite-induced mammalian target of rapamycin complex 1 (mTORC1) activation. J Biol Chem 286: 31501–1511. doi:10.1074/jbc.M111.233122PMID:21757713
46. Horejsí Z, Takai H, Adelman CA, Collis SJ, Flynn H, et al. (2010) CK2 phospho-dependent binding of R2TP complex to TEL2 is essential for mTOR and SMG1 stability. Mol Cell 39: 839–850. doi:10.1016/ j.molcel.2010.08.037PMID:20864032
47. Lappano R, Maggiolini M (2011) G protein-coupled receptors: novel targets for drug discovery in can-cer. Nat Rev Drug Discov 10: 47–60. doi:10.1038/nrd3320PMID:21193867
48. Smith EM, Finn SG, Tee AR, Browne GJ, Proud CG (2005) The tuberous sclerosis protein TSC2 is not required for the regulation of the mammalian target of rapamycin by amino acids and certain cellular stresses. J Biol Chem 280: 18717–18727. PMID:15772076
49. Gwinn DM, Shackelford DB, Egan DF, Mihaylova MM, Mery A, et al. (2008) AMPK phosphorylation of raptor mediates a metabolic checkpoint. Mol Cell 30: 214–226. doi:10.1016/j.molcel.2008.03.003 PMID:18439900
50. Zheng M, Wang YH, Wu XN, Wu SQ, Lu BJ, et al. (2011) Inactivation of Rheb by PRAK-mediated phos-phorylation is essential for energy-depletion-induced suppression of mTORC1. Nat Cell Biol 13: 263–
272. doi:10.1038/ncb2168PMID:21336308
51. Hara K, Yonezawa K, Weng QP, Kozlowski MT, Belham C, et al. (1998) Amino acid sufficiency and mTOR regulate p70 S6 kinase and eIF-4E BP1 through a common effector mechanism. J Biol Chem 273: 14484–14494. PMID:9603962
52. Orlova KA, Parker WE, Heuer GG, Tsai V, Yoon J, et al. (2010) STRADalpha deficiency results in aber-rant mTORC1 signaling during corticogenesis in humans and mice. J Clin Invest 120: 1591–1602. doi: 10.1172/JCI41592PMID:20424326
53. Rubio-Texeira M (2007) Urmylation controls Nil1p and Gln3p-dependent expression of nitrogen-catab-olite repressed genes in Saccharomyces cerevisiae. FEBS Lett. 581: 541–550. PMID:17254574 54. Leidel S, Pedrioli PG, Bucher T, Brost R, Costanzo M, et al. (2009) Ubiquitin-related modifier Urm1 acts
as a sulphur carrier in thiolation of eukaryotic transfer RNA. Nature 458: 228–232. doi:10.1038/ nature07643PMID:19145231
55. Van der Veen AG, Schorpp K, Schlieker C, Buti L, et al. (2011) Role of the ubiquitin-like protein Urm1 as a noncanonical lysine-directed protein modifier. Proc Natl Acad Sci U S A. 108: 1763–1770. doi:10. 1073/pnas.1014402108PMID:21209336
56. Goehring AS, Rivers DM, Sprague GF Jr. (2003) Urmylation: a ubiquitin-like pathway that functions dur-ing invasive growth and budddur-ing in yeast Mol Biol Cell 14: 4329–4341. PMID:14551258
57. Dewez M, Bauer F, Dieu M, Raes M, Vandenhaute J, et al. (2003) The conserved Wobble uridine tRNA thiolase Ctu1-Ctu2 is required to maintain genome integrity. Proc Natl Acad Sci U S A. 105: 5459–
5464.
58. Lindquist RA, Ottina KA, Wheeler DB, Hsu PP, Thoreen CC, et al. (2011) Genome-scale RNAi on liv-ing-cell microarrays identifies novel regulators of Drosophila melanogaster TORC1-S6K pathway sig-naling. Genome Res 21: 433–446. doi:10.1101/gr.111492.110PMID:21239477