The Association of Human Apolipoprotein
C-III Sialylation Proteoforms with Plasma
Triglycerides
Hussein N. Yassine1*, Olgica Trenchevska2, Ambika Ramrakhiani1, Aarushi Parekh1, Juraj Koska3, Ryan W. Walker4, Dean Billheimer6, Peter D. Reaven3, Frances T. Yen7, Randall W. Nelson2, Michael I. Goran5, Dobrin Nedelkov2
1Department of Medicine, University of Southern California, Los Angeles, United States of America,2The Biodesign Institute, Arizona State University, Tempe, AZ, United States of America,3Department of Medicine, Phoenix Veteran Affairs Medical Center, Phoenix, AZ, United States of America,4Department of Preventive Medicine, University of Southern California, Los Angeles, United States of America,
5Department of Preventive Medicine, Icahn School of Medicine at Mount Sinai, New York, NY, United States of America,6Biostatics Consulting Lab, University of Arizona, Tucson, AZ, United States of America,
7Université de Lorraine, URAFPA, INSERM, Vandoeuvre-lès-Nancy, France
Abstract
Introduction
Apolipoprotein C-III (apoC-III) regulates triglyceride (TG) metabolism. In plasma, apoC-III exists in non-sialylated (apoC-III0awithout glycosylation and apoC-III0bwith glycosylation), monosialylated (apoC-III1) or disialylated (apoC-III2) proteoforms. Our aim was to clarify the relationship between apoC-III sialylation proteoforms with fasting plasma TG
concentrations.
Methods
In 204 non-diabetic adolescent participants, the relative abundance of apoC-III plasma pro-teoforms was measured using mass spectrometric immunoassay.
Results
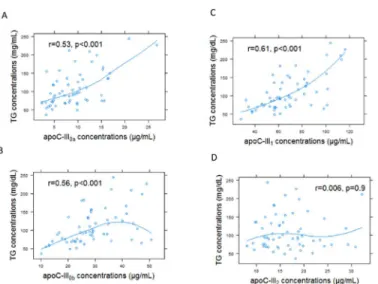
Compared with the healthy weight subgroup (n = 16), the ratios of apoC-III0a, apoC-III0b, and apoC-III1to apoC-III2were significantly greater in overweight (n = 33) and obese partici-pants (n = 155). These ratios were positively correlated with BMI z-scores and negatively correlated with measures of insulin sensitivity (Si). The relationship of apoC-III1/ apoC-III2 with Sipersisted after adjusting for BMI (p = 0.02). Fasting TG was correlated with the ratio of apoC-III0a/ apoC-III2(r = 0.47, p<0.001), apoC-III0b/ apoC-III2(r = 0.41, p<0.001), apoC-III1/ apoC-III2(r = 0.43, p<0.001). By examining apoC-III concentrations, the association of apoC-III proteoforms with TG was driven by apoC-III0a(r = 0.57, p<0.001), apoC-III0b(r = 0.56. p<0.001) and apoC-III1(r = 0.67, p<0.001), but not apoC-III2(r = 0.006, p = 0.9)
OPEN ACCESS
Citation:Yassine HN, Trenchevska O, Ramrakhiani A, Parekh A, Koska J, Walker RW, et al. (2015) The Association of Human Apolipoprotein C-III Sialylation Proteoforms with Plasma Triglycerides. PLoS ONE 10(12): e0144138. doi:10.1371/journal.pone.0144138
Editor:Yingmei Feng, Katholieke Universiteit Leuven, BELGIUM
Received:June 3, 2015
Accepted:November 14, 2015
Published:December 3, 2015
Copyright:This is an open access article, free of all copyright, and may be freely reproduced, distributed, transmitted, modified, built upon, or otherwise used by anyone for any lawful purpose. The work is made available under theCreative Commons CC0public domain dedication.
Data Availability Statement:The minimal data set is included in the Supporting Information files.
Funding:Dr. Yassine was supported by K23HL107389 from National Institute of Heart, Lung and Blood, 12CRP11750017 from the American Heart Association and USC CTSI pilot UL1TR000130. Mass spectrometry work was supported by Awards R01DK082542 and
concentrations, indicating that apoC-III relationship with plasma TG differed in apoC-III2 compared with the other proteoforms.
Conclusion
We conclude that apoC-III0a, apoC-III0b, and apoC-III1, but not apoC- III2appear to be under metabolic control and associate with fasting plasma TG. Measurement of apoC-III proteo-forms can offer insights into the biology of TG metabolism in obesity.
Introduction
Apolipoprotein C-III (apoC-III) is a protein of 79 amino acids that is synthesized in the liver
and, to a lesser degree in the intestine, and regulates triglyceride (TG) metabolism [1]. It is
pri-marily located on the surface of lipoproteins [2]. In the circulation, apoC-III is a constituent of
both apoB and apoA-I containing lipoproteins. The majority of apoC-III is found on the HDL fraction in normolipidemic individuals and on triglyceride-rich lipoproteins in patients with
elevated levels of plasma triglyceride [3]. ApoC-III plays a pivotal role in regulating the plasma
metabolism of VLDL, IDL, and LDL, primarily by inhibiting receptor-mediated uptake of
these lipoproteins by the liver [4]. Overexpression of apoC-III in transgenic mice leads to
severely increased plasma TG levels [5]. Mutations that disrupt apoC-III expression and
func-tion in humans are associated with lower plasma TG and apoC-III levels, and lower risk of
cor-onary artery disease [6].
Overproduction of apoC-III and of apoB lipoproteins that contain apoC-III is a common
feature of patients with obesity and hypertriglyceridemia [7,8]. Insulin and glucose regulate
apoC-III expression [9–11]. Treatment of insulin-deficient diabetic mice with insulin resulted
in a 2.5-fold decrease in hepatic apoC-III mRNA levels and a corresponding decrease in
apoC--III gene transcriptional activity [11]. Insulin treatment of HepG2 cells transfected with an
apoC-III luciferase reporter construction caused a dose-dependent two-fold reduction in
apoC-III transcriptional activity [11]. A genetic variant form of the human apoC-III promoter,
containing five single base pair changes that makes it less responsive to insulin, has been
shown to be associated with severe hypertriglyceridemia [10]. Glucose can also induce apoC-III
transcription in primary rat hepatocytes and immortalized human hepatocytes via a
mecha-nism involving the transcription factors carbohydrate response element–binding protein and
hepatocyte nuclear factor-4 [9]. Lowering of apoC-III by antisense oligonucleotides, reduces
fasting and post prandial triglyceride levels [12,13]. Thus, apoC-III is induced in obesity by
dysregulation of insulin and glucose signaling, and is intricately involved in establishing hypertriglyceridemia.
ApoC-III in plasma exists in multiple proteoforms. The most common proteoforms differ
by their sialic acid content: apoC-III0, apoC-III1and apoC-III2containing 0, 1, and 2 molecules
of sialic acid per molecule of protein, respectively [14–16]. In plasma from healthy volunteers,
apoC-III0, apoC-III1and apoC-III2comprise approximately 22, 45, and 33% of the total
apoC--III, respectively [17,18]. Sialylation of apoC-III occurs in the Golgi compartment by the
activ-ity of sialyltransferases [19], whereas de-sialylation of this protein is mediated by lysosomal
neuraminidase [20]. ApoC-III sialylation appears to be under metabolic control. For example,
reduced apoC-III1to apoC-III2ratio was observed following weight loss by caloric restriction
[21] or bariatric surgery [22]. In contrast, increased apoC-III0was demonstrated after
carbohydrate feeding [23,24], in familial combined hyperlipidemia [25], and in metabolic
syn-drome [26].
Progress toward understanding the importance of apoC-III sialylations in TG metabolism
in vivohas been hindered by the lack of a robust method to measure these sialylated
proteo-forms in plasma. Traditionally, sialylation of apoC-III has been studied using isoelectric focus-ing, a time sensitive method that is not amenable for use in large studies. In addition,
isoelectric focusing can only resolve three or four apoC-III proteoforms based on mass and
charge [24,27–29]. Mass spectrometric immunoassay (MSIA) is a high throughput
methodol-ogy that is utilized to identify and quantify molecular variants and posttranslational modifica-tions of plasma proteins. MSIA is based on the isolation of protein moieties from a biological milieu by immobilized antibodies, which is followed by mass spectrometry detection. In our previous work using MSIA, we identified numerous proteoforms originating from
apolipopro-tein A-I, A-II, C and serum amyloid A [30–33]. In this study, our objectives were to isolate and
identify the different apoC-III sialylated forms by MSIA, and determine the relationship between these proteoforms with fasting plasma TG levels.
Materials and Methods
Reagents
Affinity purified polyclonal goat anti-human antibodies to apoC-I (Cat. No. 31A-G1b), apoC-II (32AG2b), apoC-III (33A-G2b), and HRP Goat Anti-Human apoC-III (33H-G2a), apoC-II (32H-G4a) were obtained from Academy Bio-medical Co. (Houston, TX, USA). Pro-tein calibration standard I (Cat. No. 206355) was purchased from Bruker (Billerica, MA). Phos-phate buffered saline (PBS) buffer (Cat. No. 28372), MES buffered saline (28390), acetonitrile
solution (ACN; A955-4), hydrochloric acid (HCl; A144-212),N-methylpyrrolidinone (NMP;
BP1172-4), 1,1’Carbonyldiimidazole (97%) (CDI, 530-62-1), affinity pipettes fitted with
porous micro columns (991CUS01) were obtained from Thermo Scientific (Waltham, MA, USA). Tween20 (Cat. No. P7949), trifluoracetic acid (TFA, 299537), sinapic acid (85429-5G), sodium chloride (S7653), HEPES (H3375), ethanolamine (ETA; 398136) were obtained from Sigma Aldrich (St. Louis, MO, USA). Acetone (Cat. No. 0000017150) was obtained from Avan-tor Performance Materials (Center Valley, PA, USA).
Mass spectrometric immunoassay
Analysis of apoC-III was performed using triplexed mass spectrometric immunoassay (MSIA)
for analysis of apoC-I, apoC-II and apoC-III, as previously described [33]. In short, affinity
pipettes were derivatized with corresponding antibodies (0.4, 2.25 and 2.5μg of anti-apoC-I,
anti-apoC-II and anti-apoC-III and 0.8μg anti-lysozyme per pipette respectively). Following
sample preparation (total of 120μL of plasma sample, diluted 120-fold in PBS,0.1%Tween),
towards the lysozyme signal. Peaks that were not resolved at baseline were integrated manually. In addition, the peak areas were corrected individually with baseline noise-bin signals. To assess for the consistency of the ionization efficiency and reproducibility between and within runs, a control plasma sample was run in triplicate with each analysis. Although ssamples for these analyses were stored for up to 12 years at -80°C before measurements of apoC proteo-forms were performed, previous investigation of the effects of storage, time and freeze/thaw
cycles on these assays indicated that the measurements are relatively stable [33].
ELISA
Sandwich ELISA using apoC-III antibodies and apoC-III protein standard obtained from
Academy Biomedical was performed as previously described [8]. The inter- and intra-assay
coefficients of variation were less than 10%.
Clinical Samples
Adolescent Hispanic children (8–17 years of age) without type two diabetes (n = 204) were
recruited. Samples were obtained from a variety of studies using essentially identical protocols and measures conducted by the University of Southern California Childhood Obesity Research
Center over the past 15 years. BMI percentiles and z-scores were calculated as described [34].
The study group was divided by BMI percentiles into three groups: healthy weight (<85th
per-centile, n = 16), overweight (between 85thand 95thpercentile, n = 33) and obese (>95th
percen-tile, n = 155). Blood was collected for clinical laboratory measurements (lipid profile, liver function tests, and insulin-modified frequently sampled intravenous glucose tolerance test for
measuring insulin sensitivity-Si[35] in a subset of these participants,Table 1) after an
over-night fast (10 hours). Additional samples were collected in EDTA tubes, and plasma from these samples was separated and immediately frozen at -80°C for all other assays. Demographic information (sex, age, and ethnicity), physical exam measurements (height, weight, and body mass index-BMI), medication use, and medical history (hypertension, hyperlipidemia, and smoking) were recorded. Exclusion criteria included the following: (i) met any diagnostic crite-ria for diabetes; (ii) the use of medications or supplements or the past or present diagnosis of
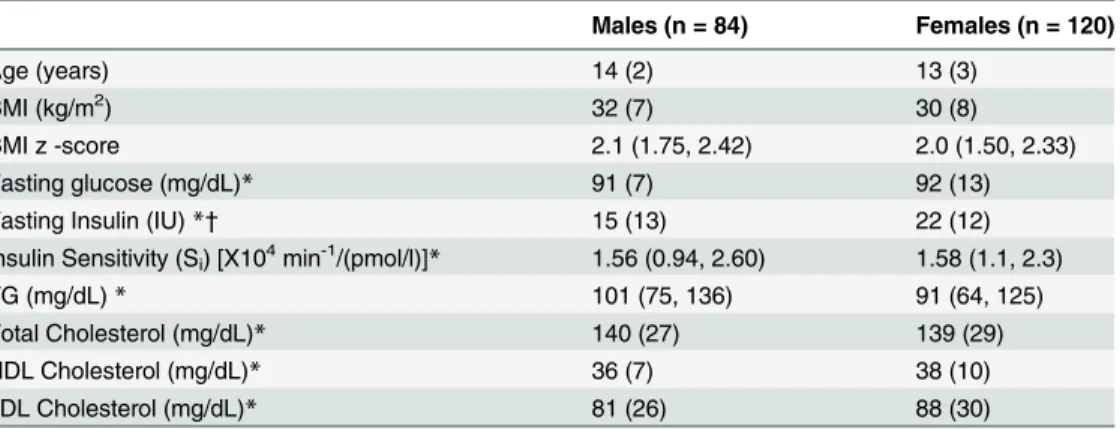
Table 1. The clinical and biochemical characteristics of the study population by sex.
Males (n = 84) Females (n = 120)
Age (years) 14 (2) 13 (3)
BMI (kg/m2) 32 (7) 30 (8)
BMI z -score 2.1 (1.75, 2.42) 2.0 (1.50, 2.33)
Fasting glucose (mg/dL)* 91 (7) 92 (13)
Fasting Insulin (IU)*† 15 (13) 22 (12)
Insulin Sensitivity (Si) [X104min-1/(pmol/l)]* 1.56 (0.94, 2.60) 1.58 (1.1, 2.3)
TG (mg/dL)* 101 (75, 136) 91 (64, 125)
Total Cholesterol (mg/dL)* 140 (27) 139 (29)
HDL Cholesterol (mg/dL)* 36 (7) 38 (10)
LDL Cholesterol (mg/dL)* 81 (26) 88 (30)
Data are presented as means (SD) or median (25th, 75thpercentile) for non-normally distributed data. The
differences between males and females in age, BMI or lipid measures were not significant. *Fasting glucose, n = 120, Fasting insulin, n = 119, Si, n = 117, TG, n = 173, cholesterol, n = 132.
†
p = 0.005. IU: International Units. TG: Triglycerides.
other syndromes or diseases known to influence liver function, insulin action, or lipid levels; (iii) previous diagnosis of any major illness since birth; (iv) smoking (currently smoked, or had smoked more than 100 cigarettes in their lifetime) or drinking alcohol on a regular basis (in excess of two drinks per week as determined by a questionnaire; (v) or involvement in any weight loss/exercise/sports program currently or within 6 months prior to participation.
Study approval
This study was approved by the University of Southern California (USC) Institutional Review Board. Written informed consent was obtained from parents or legal guardians of minors. Additionally, child assent was obtained in writing.
Statistical Analysis
Mean (SD) or median (25thand 75thpercentiles) for non-normally distributed data were
calcu-lated for continuous variables. The study subgroups were compared using ANOVA. The sialy-lation ratios between the groups were modeled using logistic regression adjusting for age and
sex. The relation between apoC-III proteoform ratios with BMI z-scores, Si, or TG
concentra-tions was analyzed using Spearman correlation coefficient. To test if apoC-III concentraconcentra-tions
and apoC-III1/apoC-III2ratio were independently associated with TG concentrations, a linear
regression model was used, and apoC-III concentrations and ratio were centered to facilitate interpretation of the results. Centering the regressors allowed the coefficients to represent the change in TG associated with one SD change in the predictor. Statistical analyses used R
pro-gram version 3.3. p<0.05 was defined as significant.
Results
The study participants were predominantly overweight and obese Hispanic adolescents with a
BMI z-score between–0.98 and 3.1, and fasting plasma TG levels ranging from 19 to 330 mg/
dL. None of the recruited participants had been diagnosed with diabetes, nor were on diabetes or lipid-lowering therapies. The mean fasting glucose among the participants was 92 mg/dL. With the exception of fasting insulin, the characteristics of the study participants did not differ
by sex. Additional clinical and biochemical characteristics are summarized inTable 1.
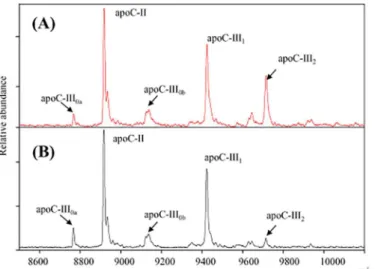
The relative abundance of apoC-I, C-II and C-III proteoforms in fasting plasma was
assessed by MSIA (Fig 1). A total of 12 apoC-III proteoforms were detected, reflecting
varia-tions in galactose (Gal), N-acteyl galactosamine (GalNAc), fucose, alanine truncavaria-tions or sialic acid residues. Because of the higher abundance and potential functional importance of the sia-lylations, analysis of apoC-III was largely restricted to these proteoforms. In addition, MSIA was utilized to measure apoC-I and C-II proteins. Characteristics of apoC-I, C-II and C-III
proteoforms by MSIA are summarized inTable 2. In contrast to isoelectric focusing, MSIA can
resolve two asialylated proteoforms based on mass (apoC-III0a, and apoC-III0b) with
apoC-III0bhaving a galactose and GalNAc residues. ApoC-III0ais referred here as the native
apoC-III, and corresponds to the full-length sequence of unmodified apoC-III protein (MW = 8765
Da). As shown inFig 1, the most abundant proteoform of apoC-III is the mono-sialylated
(apoC-III1: 52.5± 3.6 peak area ratio to total apoC-III peak area), followed by the di-sialylated
protein (apoC-III2: 12.4 ± 3.8 peak area ratio), with the native proteoform being less in
abun-dance (apoC-III0a: 6.9 ± 3.5 peak area ratio). In this study, apoC-III0bwas relatively greater in
abundance than apoC-III0a(apoC-III0b: 22.3 ± 3.3 peak area ratio).
fewer males compared to the two other subgroups. Obesity was associated with decreases in
both insulin sensitivity (Si) and HDL cholesterol concentrations, and increases in TG
concen-trations. These data are summarized inTable 3. The ratios apoC-III0a, apoC-III0band
apoC-III1to apoC-III2were significantly greater in the overweight and obese groups compared to the
healthy weight group (Table 3). These ratios were positively correlated with BMI z-scores (Fig
2A, 2B and 2C), and negatively correlated with measures of insulin sensitivity (Fig 3A, 3B and
3C). The relationship between apoC-III1/ apoC-III2ratio and insulin sensitivity persisted after
adjusting for BMI, age and sex (R2= 0.19, p = 0.02). Fasting glucose levels did not significantly
correlate with the apoC-III proteoform ratios (p>0.1).
ApoC-III2had a different relationship with fasting TG than the other apoC-III proteoforms.
Representative MSIA mass spectra from two participants in the upper and lower quartiles of
TG levels are presented inFig 4. Compared to the normotriglyceridemic participant, mass
spectrum from the hypertriglyceridemic individual revealed a greater ratio of apoC-III0a,
Fig 1. Mass spectra of plasma apolipoproteins C-I, C-II and C-III and their proteoforms resolved using MSIA loaded with antibodies for apoC-I, C-II and C-III.Two proteoforms of apoC-I (native and TP truncated), and two proteoforms of apoC-II (native and TQQPQQ truncation) can be detected. 12 different proteoforms of apoC-III can be resolved. This study was focused on four proteoforms of apoC-III: native apoC-III (apoC-III0a), glycosylated apoC-III (apoC-III0b), monosialylated (apoC-III1), and disialylated
(apoC-III2).
doi:10.1371/journal.pone.0144138.g001
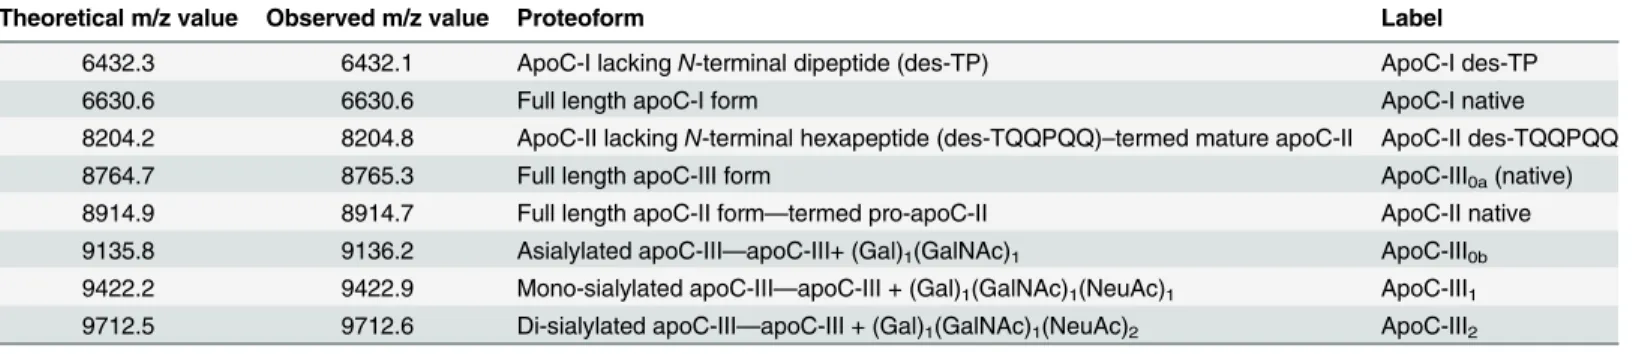
Table 2. ApoC-I, apoC-II and apoC-III proteoforms detected by MSIA.
Theoretical m/z value Observed m/z value Proteoform Label
6432.3 6432.1 ApoC-I lackingN-terminal dipeptide (des-TP) ApoC-I des-TP
6630.6 6630.6 Full length apoC-I form ApoC-I native
8204.2 8204.8 ApoC-II lackingN-terminal hexapeptide (des-TQQPQQ)–termed mature apoC-II ApoC-II des-TQQPQQ
8764.7 8765.3 Full length apoC-III form ApoC-III0a(native)
8914.9 8914.7 Full length apoC-II form—termed pro-apoC-II ApoC-II native
9135.8 9136.2 Asialylated apoC-III—apoC-III+ (Gal)1(GalNAc)1 ApoC-III0b
9422.2 9422.9 Mono-sialylated apoC-III—apoC-III + (Gal)1(GalNAc)1(NeuAc)1 ApoC-III1
9712.5 9712.6 Di-sialylated apoC-III—apoC-III + (Gal)1(GalNAc)1(NeuAc)2 ApoC-III2
Gal—galactose; GalNAc—N-acetylgalactosamine; NeuAc—N-acetyl neuraminic acid (sialic acid)
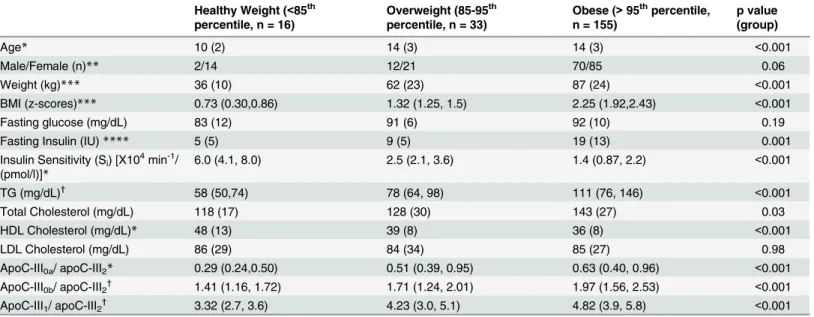
Table 3. The clinical and biochemical characteristics of the study population by weight groups.
Healthy Weight (<85th percentile, n = 16)
Overweight (85-95th percentile, n = 33)
Obese (>95thpercentile, n = 155)
p value (group)
Age* 10 (2) 14 (3) 14 (3) <0.001
Male/Female (n)** 2/14 12/21 70/85 0.06
Weight (kg)*** 36 (10) 62 (23) 87 (24) <0.001
BMI (z-scores)*** 0.73 (0.30,0.86) 1.32 (1.25, 1.5) 2.25 (1.92,2.43) <0.001
Fasting glucose (mg/dL) 83 (12) 91 (6) 92 (10) 0.19
Fasting Insulin (IU)**** 5 (5) 9 (5) 19 (13) 0.001
Insulin Sensitivity (Si) [X104min-1/
(pmol/l)]*
6.0 (4.1, 8.0) 2.5 (2.1, 3.6) 1.4 (0.87, 2.2) <0.001
TG (mg/dL)† 58 (50,74) 78 (64, 98) 111 (76, 146) <0.001
Total Cholesterol (mg/dL) 118 (17) 128 (30) 143 (27) 0.03
HDL Cholesterol (mg/dL)* 48 (13) 39 (8) 36 (8) <0.001
LDL Cholesterol (mg/dL) 86 (29) 84 (34) 85 (27) 0.98
ApoC-III0a/ apoC-III2* 0.29 (0.24,0.50) 0.51 (0.39, 0.95) 0.63 (0.40, 0.96) <0.001
ApoC-III0b/ apoC-III2† 1.41 (1.16, 1.72) 1.71 (1.24, 2.01) 1.97 (1.56, 2.53) <0.001
ApoC-III1/ apoC-III2† 3.32 (2.7, 3.6) 4.23 (3.0, 5.1) 4.82 (3.9, 5.8) <0.001
BMI percentile categories were based on BMI z-scores. Data are presented as means (SD) or median (25th, 75thpercentile) for non-normally distributed
data. The data was analyzed by ANOVA followed by groupwise comparisons. Significance was defined with a p<0.05. The differences of the apoC-III ratios among the three groups were adjusted for age and sex using logistic regression.
*healthy weight group was significantly different from the overweight and obese groups **less males than females in healthy weight compared to the overweight and obese groups ***three groups were significantly different
****obese group was significantly different from the overweight group
†
obese group was significantly different from overweight and healthy groups
doi:10.1371/journal.pone.0144138.t003
Fig 2. BMI z-scores were associated with greater ratio of apoC-III0and apoC-III1proteoforms to apoC-III2in plasma (n = 204).BMI z-scores correlated with apoC-III0a/ apoC-III2ratio (r = 0.30, p<0.001, A),
apoC-III0b/ apoC-III2ratio (r = 0.36, p<0.001, B), and apoC-III1/ apoC-III2ratio (r = 0.38, p<0.001, C).
apoC-III0b, or apoC-III1to apoC-III2.In all the participants, the ratios of apoC-III0a/
apoC-III2, apoC-III0b/ apoCIII2and apoC-III1/ apoC-III2were significantly correlated with greater
fasting TG (Fig 5A, 5B and 5C). Although the ratio of apoC-III1/ apoC-III0awas associated
with greater TG concentrations (r = 0.35, p<0.001), the association of apo-CIII1/apoC-III0b
ratio and TG concentrations was not significant (r = 0.06, p = 0.38). Total plasma apoC-III concentration was measured in a subset of samples at the upper (HC-III) and lower (LC-III)
quartiles of the apoC-III1/ apoC-III2ratio (n = 72). The individual concentrations of apoC-III
proteoforms were then computed by multiplying the total concentration with the relative
Fig 3. Insulin sensitivity measures (Si) were associated with lower ratios of apoC-III0and apoC-III1 proteoforms to apoC-III2in plasma.Siwas measured in a subset of participants (n = 117). Sinegatively
correlated with apoC-III0a/ apoC-III2ratio (r = -0.21, p = 0.02, A), apoC-III0b/ apoC-III2ratio (r = -0.39,
p<0.001, B), and apoC-III1/ apoC-III2ratio (r = -0.42, p<0.001, C).
doi:10.1371/journal.pone.0144138.g003
Fig 4. Representative MSIA mass spectra from two participants of the upper and lower quartile of TG concentrations.Participant 1 (upper panel) is a 15 years old male with a BMI z-score of 1.6, TG of 36 and HDL of 41 mg/dL. In contrast, participant 2 (lower panel) is a 14 years old male with a BMI z-score of 2.73, TG of 224 and HDL of 36 mg/dL. Compared to the participant with lower TG concentrations, mass spectrum from the individual with hypertriglyceridemia reveals a greater ratio of apoC-III0a, apoC-III0b, and apoC-III1to
apoC-III2.
abundance of each protein. The concentrations of apoC-III0band apoC-III1were highly
corre-lated (r = 0.89, p<0.001), suggesting that the glycosylation of apoC-III (C-III0b) and
glycosyla-tion and sialylaglycosyla-tion of this protein (apoC-III1) are result of the same process, and explaining
the lack of correlation of the ratio of apoC-III1/ apoC-III0bwith fasting TG. The
concentra-tions of apoC-III0awere also correlated with the concentrations of apoC-III0b(r = 0.55,
p<0.001) and apoC-III1(r = 0.6, p<0.001). However, concentrations of apoC-III2did not
cor-relate with any of the other apoC-III proteoforms suggesting that a different mechanism regu-lates the addition of the second sialic acid to apoC-III.
ApoC-III proteoform concentrations were examined in relation to fasting plasma TG. As expected, total apoC-III concentrations were strongly correlated with plasma TG
Fig 5. The ratio of apoC-III0and apoC-III1proteoforms to apoC-III2in plasma was positively correlated with fasting plasma TG concentrations (n = 173).TG concentrations correlated with apoC-III0a/ apoC-III2
ratio in plasma (r = 0.47, p<0.001, A), and apoC-III0b/ apoC-III2ratio (r = 0.42, p<0.001, B) and C-III1/
apoC-III2ratio (r = 0.43, p<0.001, C) in plasma.
doi:10.1371/journal.pone.0144138.g005
Fig 6. Relationship of apoC-III proteoforms concentrations and plasma TG concentrations (n = 72).
This association was driven by apoC-III0a(r = 0.53, p<0.001, A), apoC-III0b(r = 0.56, p<0.001, B) and
apoC-III1(r = 0.61, p<0.001, C), but not apoC-III2(r = 0.006, p = 0.9, D).
concentrations (r = 0.63, p<0.001). The association of apoC-III proteoforms with TG was
driven by apoC-III0a, apoC-III0b, and apoC-III1but not apoC-III2concentrations (Fig 6A, 6B,
6C and 6D). These data indicate that apoC-III0a, apoC-III0band apoC-III1were better
indica-tors of fasting TG levels than apoC-III2. Using a linear multivariate regression model with
apoC-III concentrations and ratios as predictors of TG concentrations, an independent
associ-ation between apoC-III concentrassoci-ations and the ratio of the other proteoforms to apoC-III2
with TG concentrations was demonstrated (p<0.001 for all). For example, for one SD increase
in total apoC-III concentrations, there was a 23 unit (standard error 5, p<0.001) increase in
TG concentrations. For one SD increase in apoC-III1/ apoC-III2ratio, there was 17 unit
(stan-dard error 4.8, p = 0.001) increase in TG concentrations.
Discussion
ApoC-III in the plasma circulates predominantly as a sialylated apolipoprotein containing one or two molecules of sialic acid. ApoC-III is a key regulator of TG metabolism; however, the roles of the individual apoC-III proteoforms are not well understood. In the present study, we
found that overweight and obese individuals had greater ratios of apoC-III0or apoC-III1
pro-teoforms to apoC-III2compared with leaner individuals. These ratios negatively correlated
with insulin sensitivity (Si) and positively correlated with TG concentrations. Concentrations
of apoC-III0a, apoC-III0band apoC-III1, but not apoC-III2, correlated with fasting TG. These
findings indicate that apoC-III0and apoC-III1are under metabolic control with a potential
role for decreased insulin sensitivity in their formation, independent of changes in obesity. Our
findings indicate that apoC-III2’s effects on TG metabolism differ from the other apoC-III
proteoforms.
The majority of apoC-III is sialylated at the Thr-74 residue through a process of O-linked
glycosylation [18]. Sialylation is an intracellular process driven by sialyltransferases, a family of
Golgi-membrane bound enzymes [36]. The exact sialyltransferases or sialidases that modulate
apoC-III sialylation remain to be identified, but two candidate sialyltransferases areα
2,3-sialyl-transferase, that can add sialic acid to galactose in position 3’(ST3Gal-I), andα
2,6-sialyltrans-ferase that can add sialic acid to GalNAc in position 6’(ST6Gal-I). Human GWAS study
implicated GALNT2 as an enzyme that regulates HDL and TG metabolism [37], potentially by
modulating apoC-III glycosylation [38]. Carriers of GALNT2 gene variants have altered
apoC-III sialylation patterns [28]. In addition, GALNT2 expression is under glycemic control
[39]. Neuraminidase, a lysosomal enzyme responsible for removal of sialic acid residues of
pro-teins, has been detected in the circulation. However, desialylation activity via this enzyme in
plasma is unlikely, since the optimal pH for the reaction ranges from 4–5 [20]. Roghani et al
[19] demonstrated that apoC-III sialylation is not essential for its secretion or packaging into
VLDL using a cell line expressing Thr-to-Ala 74 apoC-III mutant. It is thus likely that apoC-III sialylation is a variable and nonobligatory step for further protein processing and secretion [20].
Our study is novel for the following reasons: (1) we used a high throughput mass spectrom-etry-based technique to identify apoC-III proteoforms in plasma; (2) we examined an obese group not taking any medications that can alter lipid physiology and without the confounding effects of type 2 diabetes hyperglycemia; (3) our obese study group was assessed for measures of insulin sensitivity (which is a factor that regulates apoC-III expression); and (4) the study highlights important changes in lipid metabolism with obesity that appear early in adolescence with potential implications for diabetes complications later on. Previous studies using different populations and techniques present conflicting results on the role of apoC-III sialylation in TG
metformin [22] have been reported to increase apoC-III sialylations confounding the
interpre-tation of these results. In agreement with our findings, Savinova et al [26] found relative
decreases in apoC-III2to apoC-III1in patients with metabolic syndrome compared to controls.
In addition, an earlier study by Falko et al demonstrated that high carbohydrate diet
preferen-tially increases apoC-III0but not the other proteoforms [24]. Dietary weight loss or gastric
bypass reduced the ratio of apoC-III1/ apoC-III2[21,22]. In contrast to our findings and those
of others [24,26,40], two other studies reported an association between increased apoC-III2
and type IV hypertriglyceridemia [17,41]. This discrepancy could have resulted from
examin-ing different populations, the use of lipid alterexamin-ing therapies and by the use of different method-ologies (such as isoelectric focusing) to assess apoC-III sialylations.
Although a minor fraction of apoC-III is carried by LDL, increases in apoC-III on LDL were
observed in diabetes [42]. These changes are considered atherogenic [42], as apoC-III on LDL
associates with small dense LDL formation [18]. We are currently investigating the hypothesis
that more efficient liver uptake of sialylated apoC-III on VLDL enhances TG metabolism and limits its conversion to LDL, resulting in the appearance of apoC-III on LDL. This is a potential
mechanism that can explain the relation between apoC-III2and plasma TG.
Recruiting healthy controls in pediatric research is challenging, yet we were able to recruit a small number of normal weight participants. Our control subgroup, however, was small in size, with younger individuals, and fewer males than the overweight and obese subgroups. The dif-ferences in apoC-III proteoform patterns persisted after adjusting for age and sex. Our study was conducted in a younger Hispanic population and generalization to different age groups and ethnicities requires additional studies. MALDI TOF MS affects the carboxyl groups in cosylated proteins and causes their loss, therefore it is considered less efficient in analyzing gly-cans that contain carboxyl groups (i.e. sialic acid contains one carboxyl group). The majority of studies which report this issue are focused on analyzing isolated glycans, or glycans from glyco-sylated proteins obtained after enzyme digestion, rather than looking at them in the complex
structure of the protein [43]. In addition, literature confirms that loss of sialic acid in glycans is
common when MS/MS analyses are performed [43] (which was not the case for our sample
set). The benefit of MSIA (used in our study) is that the glycated proteoforms are analyzed intact, and in a very short time (to complete 5000 mass spectra average takes less than 15s). In addition, all samples throughout the analysis were treated in the same way (same laser intensity for ionization). A control plasma sample was analyzed in triplicate with each run and relative percent ratios for all apoC proteoforms (including the sialylated and asialylated apoC-III) were compared between the different runs. The variability between the signals from apoC-III
pro-teoforms that contained zero, one and two sialic acids was<10%. Neither apoC-III0anor
apoC-III0bhave sialic acid in their structure. The low abundance of the native
(non-glycosy-lated apoC-III proteoforms—apoC-III0a) as opposed to the glycosylated apoC-III is in
accor-dance to previous literature data [44]. Furthermore, Bondarenko et al [44] demonstrated
similar profiles of the apoC-III sialic acid proteoforms with both MALDI and ESI-TOF (which is a softer ionization technique), indicating that the MALDI ionization did not induce removal of sialic acids in intact apoC-III..
We conclude that apoC-III proteoforms are associated with obesity and insulin signaling
with apoC-III2showing a different pattern of association. ApoC-III2, unlike the other apoC-III
proteoforms, did not associate with greater fasting plasma TG. Our findings support kinetic studies to examine how the different proteoforms regulate VLDL clearance. Measuring plasma
apoC-III sialylation ratio (such as the ratio of apoC-III1/ apoC-III2) can provide important
insights into the biology of TG metabolism in conditions such as obesity and metabolic syndrome.
Supporting Information
S1 Table. The dataset for the association of apoC-III proteoforms with clinical and bio-chemical measurements.
(XLSX)
Author Contributions
Conceived and designed the experiments: HY MG RN DN. Performed the experiments: OT AR AP RW MG. Analyzed the data: HY JK DB. Contributed reagents/materials/analysis tools: DN DB. Wrote the paper: HY AR OT JK PR FY DN RW.
References
1. Wang C-S, McConathy WJ, Kloer HU, Alaupovic P. Modulation of lipoprotein lipase activity by apolipo-proteins. Effect of apolipoprotein C-III. Journal of Clinical Investigation. 1985; 75(2):384. PMID:3973011
2. Breyer ED, Le N-A, Li X, Martinson D, Brown WV. Apolipoprotein C-III displacement of apolipoprotein E from VLDL: effect of particle size. Journal of lipid research. 1999; 40(10):1875–82. PMID:10508207
3. Fredenrich A, Giroux L, Tremblay M, Krimbou L, Davignon J, Cohn J. Plasma lipoprotein distribution of apoC-III in normolipidemic and hypertriglyceridemic subjects: comparison of the apoC-III to apoE ratio in different lipoprotein fractions. Journal of lipid research. 1997; 38(7):1421–32. PMID:9254067
4. Windler E, Havel RJ. Inhibitory effects of C apolipoproteins from rats and humans on the uptake of tri-glyceride-rich lipoproteins and their remnants by the perfused rat liver. Journal of lipid research. 1985; 26(5):556–65. PMID:4020294
5. Ito Y, Azrolan N, O'Connell A, Walsh A, Breslow JL. Hypertriglyceridemia as a result of human apo CIII gene expression in transgenic mice. Science. 1990; 249(4970):790–3. PMID:2167514
6. Crosby J, Peloso GM, Auer PL, Crosslin DR, Stitziel NO, Lange LA, et al. Loss-of-function mutations in APOC3, triglycerides, and coronary disease. The New England journal of medicine. 2014; 371(1):22–
31. Epub 2014/06/19. doi:10.1056/NEJMoa1307095PMID:24941081; PubMed Central PMCID: PMCPMC4180269.
7. Batal R, Tremblay M, Barrett PHR, Jacques H, Fredenrich A, Mamer O, et al. Plasma kinetics of apoC-III and apoE in normolipidemic and hypertriglyceridemic subjects. Journal of lipid research. 2000; 41 (5):706–18. PMID:10787431
8. Zheng C, Khoo C, Ikewaki K, Sacks FM. Rapid turnover of apolipoprotein C-III-containing triglyceride-rich lipoproteins contributing to the formation of LDL subfractions. Journal of lipid research. 2007; 48 (5):1190–203. Epub 2007/02/23. doi:10.1194/jlr.P600011-JLR200PMID:17314277.
9. Caron S, Verrijken A, Mertens I, Samanez CH, Mautino G, Haas JT, et al. Transcriptional activation of apolipoprotein CIII expression by glucose may contribute to diabetic dyslipidemia. Arteriosclerosis, thrombosis, and vascular biology. 2011; 31(3):513–9. doi:10.1161/ATVBAHA.110.220723PMID: 21183731
10. Li WW, Dammerman MM, Smith JD, Metzger S, Breslow JL, Leff T. Common genetic variation in the promoter of the human apo CIII gene abolishes regulation by insulin and may contribute to hypertrigly-ceridemia. Journal of Clinical Investigation. 1995; 96(6):2601. PMID:8675624
11. Chen M, Breslow JL, Li W, Leff T. Transcriptional regulation of the apoC-III gene by insulin in diabetic mice: correlation with changes in plasma triglyceride levels. Journal of lipid research. 1994; 35 (11):1918–24. Epub 1994/11/01. PMID:7868970.
12. Graham MJ, Lee RG, Bell TA, Fu W, Mullick AE, Alexander VJ, et al. Antisense oligonucleotide inhibition of apolipoprotein C-III reduces plasma triglycerides in rodents, nonhuman primates, and humans. Circu-lation research. 2013; 112(11):1479–90. doi:10.1161/CIRCRESAHA.111.300367PMID:23542898
13. Gaudet D, Alexander VJ, Baker BF, Brisson D, Tremblay K, Singleton W, et al. Antisense Inhibition of Apolipoprotein C-III in Patients with Hypertriglyceridemia. New England Journal of Medicine. 2015; 373 (5):438–47. doi:10.1056/NEJMoa1400283PMID:26222559
14. Brewer HB, Shulman R, Herbert P, Ronan R, Wehrly K. The complete amino acid sequence of alanine apolipoprotein (apoC-III), an apolipoprotein from human plasma very low density lipoproteins. Journal of Biological Chemistry. 1974; 249(15):4975–84. PMID:4846755
16. Zannis VI, Breslow JL. Genetic mutations affecting human lipoprotein metabolism. Advances in Human Genetics 14: Springer; 1985. p. 125–215. PMID:2986430
17. Kashyap M, Srivastava L, Hynd B, Gartside P, Perisutti G. Quantitation of human apolipoprotein C-III and its subspecie by radioimmunoassay and analytical isoelectric focusing: abnormal plasma triglycer-ide-rich lipoprotein apolipoprotein C-III subspecie concentrations in hypertriglyceridemia. Journal of lipid research. 1981; 22(5):800–10. PMID:7288286
18. Mauger J-F, Couture P, Bergeron N, Lamarche B. Apolipoprotein C-III isoforms: kinetics and relative implication in lipid metabolism. Journal of lipid research. 2006; 47(6):1212–8. PMID:16495512
19. Roghani A, Zannis V. Mutagenesis of the glycosylation site of human ApoCIII. O-linked glycosylation is not required for ApoCIII secretion and lipid binding. Journal of Biological Chemistry. 1988; 263 (34):17925–32. PMID:3192519
20. Millar JS. The sialylation of plasma lipoproteins. Atherosclerosis. 2001; 154(1):1–13. PMID:11137077
21. Bosello O, Cominacini L, Zocca I, Garbin U, Ferrari F, Davoli A. Effects of severe caloric restriction on the degree of sialylation of apoprotein C-III in obese women. Annals of nutrition and metabolism. 1985; 29(1):33–9. PMID:3977292
22. Harvey SB, Zhang Y, Wilson-Grady J, Monkkonen T, Nelsestuen GL, Kasthuri RS, et al. O-glycoside biomarker of apolipoprotein C3: responsiveness to obesity, bariatric surgery, and therapy with metfor-min, to chronic or severe liver disease and to mortality in severe sepsis and graft vs host disease. Jour-nal of proteome research. 2008; 8(2):603–12.
23. Witztum JL, Schonfeld G. Carbohydrate diet-induced changes in very low density lipoprotein composi-tion and structure. Diabetes. 1978; 27(12):1215–29. Epub 1978/12/01. PMID:214369.
24. Falko JM, Schonfeld G, Witztum JL, Kolar JB, Salmon P. Effects of short-term high carbohydrate, fat-free diet on plasma levels of Apo C-II and Apo C-III and on the Apo C subspecies in human plasma lipo-proteins. Metabolism: clinical and experimental. 1980; 29(7):654–61. Epub 1980/07/01. PMID: 7382829.
25. Lindbohm N, Gylling H, Miettinen TE, Miettinen TA. Sialic acid content of LDL and lipoprotein metabo-lism in combined hyperlipidemia and primary moderate hypercholesterolemia. Clinica Chimica Acta. 1999; 285(1–2):69–84. doi:10.1016/S0009-8981(99)00107-2
26. Savinova OV, Fillaus K, Jing L, Harris WS, Shearer GC. Reduced Apolipoprotein Glycosylation in Patients with the Metabolic Syndrome. PloS one. 2014; 9(8):e104833. doi:10.1371/journal.pone. 0104833PMID:25118169
27. Mann CJ, Troussard AA, Yen FT, Hannouche N, Najib J, Fruchart JC, et al. Inhibitory effects of specific apolipoprotein C-III isoforms on the binding of triglyceride-rich lipoproteins to the lipolysis-stimulated receptor. The Journal of biological chemistry. 1997; 272(50):31348–54. PMID:9395464.
28. Holleboom AG, Karlsson H, Lin RS, Beres TM, Sierts JA, Herman DS, et al. Heterozygosity for a loss-of-function mutation in GALNT2 improves plasma triglyceride clearance in man. Cell Metab. 2011; 14 (6):811–8. Epub 2011/12/14. doi:10.1016/j.cmet.2011.11.005PMID:22152306; PubMed Central PMCID: PMCPMC3523677.
29. Catapano AL. Activation of lipoprotein lipase by apolipoprotein C-II is modulated by the COOH terminal region of apolipoprotein C-III. Chemistry and Physics of Lipids. 1987; 45(1):39–47. doi: 10.1016/0009-3084(87)90038-7PMID:3446410
30. Nelson RW, Borges CR. Mass spectrometric immunoassay revisited. J Am Soc Mass Spectrom. 2011; 22(6):960–8. doi:10.1007/s13361-011-0094-zPMID:21953037.
31. Nelson RW, Krone JR, Bieber AL, Williams P. Mass spectrometric immunoassay. Anal Chem. 1995; 67 (7):1153–8. Epub 1995/04/01. PMID:15134097.
32. Yassine HN, Trenchevska O, He H, Borges CR, Nedelkov D, Mack W, et al. Serum amyloid a trunca-tions in type 2 diabetes mellitus. PloS one. 2015; 10(1):e0115320. Epub 2015/01/22. doi:10.1371/ journal.pone.0115320PMID:25607823.
33. Trenchevska O, Schaab MR, Nelson RW, Nedelkov D. Development of multiplex mass spectrometric immunoassay for detection and quantification of apolipoproteins CI, C-II, C-III and their proteoforms. Methods. 2015.
34. Must A, Anderson S. PEDIATRIC MINI REVIEW Body mass index in children and adolescents: consid-erations for population-based applications. International journal of obesity. 2006; 30:590–4.
35. Cruz ML, Bergman RN, Goran MI. Unique effect of visceral fat on insulin sensitivity in obese Hispanic children with a family history of type 2 diabetes. Diabetes care. 2002; 25(9):1631–6. PMID:12196439
37. Willer CJ, Sanna S, Jackson AU, Scuteri A, Bonnycastle LL, Clarke R, et al. Newly identified loci that influence lipid concentrations and risk of coronary artery disease. Nature genetics. 2008; 40(2):161–9. doi:10.1038/ng.76PMID:18193043
38. Katrine T-BS, Vakhrushev SY, Kong Y, Steentoft C, Nudelman AS, Pedersen NB, et al. Probing iso-form-specific functions of polypeptide GalNAc-transferases using zinc finger nuclease glycoengineered SimpleCells. Proceedings of the National Academy of Sciences. 2012; 109(25):9893–8.
39. Marucci A, di Mauro L, Menzaghi C, Prudente S, Mangiacotti D, Fini G, et al. GALNT2 expression is reduced in patients with type 2 diabetes: possible role of hyperglycemia. PloS one. 2013; 8(7):e70159. doi:10.1371/journal.pone.0070159PMID:23894607
40. Savinova OV, Fillaus K, Harris WS, Shearer GC. Effects of niacin and omega-3 fatty acids on the apoli-poproteins in overweight patients with elevated triglycerides and reduced HDL cholesterol. Atheroscle-rosis. 2015; 240(2):520–5. doi:10.1016/j.atherosclerosis.2015.04.793PMID:25932792
41. Holdsworth G, Stocks J, Dodson P, Galton DJ. An abnormal triglyceride-rich lipoprotein containing excess sialylated apolipoprotein C-III. The Journal of clinical investigation. 1982; 69(4):932–9. Epub 1982/04/01. PMID:7076853; PubMed Central PMCID: PMCPMC370147.
42. Hiukka A, Ståhlman M, Pettersson C, Levin M, Adiels M, Teneberg S, et al. ApoCIII-enriched LDL in type 2 diabetes displays altered lipid composition, increased susceptibility for sphingomyelinase, and increased binding to biglycan. Diabetes. 2009; 58(9):2018–26. doi:10.2337/db09-0206PMID: 19502413
43. Wada Y, Azadi P, Costello CE, Dell A, Dwek RA, Geyer H, et al. Comparison of the methods for profiling glycoprotein glycans—HUPO Human Disease Glycomics/Proteome Initiative multi-institutional study. Glycobiology. 2007; 17(4):411–22. PMID:17223647
44. Bondarenko PV, Cockrill SL, Watkins LK, Cruzado ID, Macfarlane RD. Mass spectral study of polymor-phism of the apolipoproteins of very low density lipoprotein. Journal of lipid research. 1999; 40(3):543–