ACPD
11, 25037–25061, 2011Correlation of cirrus, water vapor and temperature in TTL
T. Flury et al.
Title Page
Abstract Introduction
Conclusions References
Tables Figures
◭ ◮
◭ ◮
Back Close
Full Screen / Esc
Printer-friendly Version Interactive Discussion
Discussion
P
a
per
|
Dis
cussion
P
a
per
|
Discussion
P
a
per
|
Discussio
n
P
a
per
|
Atmos. Chem. Phys. Discuss., 11, 25037–25061, 2011 www.atmos-chem-phys-discuss.net/11/25037/2011/ doi:10.5194/acpd-11-25037-2011
© Author(s) 2011. CC Attribution 3.0 License.
Atmospheric Chemistry and Physics Discussions
This discussion paper is/has been under review for the journal Atmospheric Chemistry and Physics (ACP). Please refer to the corresponding final paper in ACP if available.
Correlation among cirrus ice content,
water vapor and temperature in the TTL
as observed by CALIPSO and Aura/MLS
T. Flury, D. L. Wu, and W. G. Read
Jet Propulsion Laboratory, California Institute of Technology, Pasadena, California, USA
Received: 23 July 2011 – Accepted: 24 August 2011 – Published: 8 September 2011
Correspondence to: T. Flury ([email protected])
ACPD
11, 25037–25061, 2011Correlation of cirrus, water vapor and temperature in TTL
T. Flury et al.
Title Page
Abstract Introduction
Conclusions References
Tables Figures
◭ ◮
◭ ◮
Back Close
Full Screen / Esc
Printer-friendly Version Interactive Discussion
Discussion
P
a
per
|
Dis
cussion
P
a
per
|
Discussion
P
a
per
|
Discussio
n
P
a
per
|
Abstract
Water vapor in the tropical tropopause layer (TTL) has a significant radiative cooling ef-fect on the Earth’s climate system. As a source for cirrus clouds, however, it can also in-directly produce infrared heating. The amount of water vapor in the TTL is strongly con-trolled by temperature (correlationr=0.94) with a seasonal cycle of ∼1–2 ppm vmr in
5
amplitude at 100 hPa and minimum values in Northern Hemisphere winter (December-January-February, DJF). Studying the A-Train CALIPSO cirrus and MLS water vapor measurements, we find that the cirrus seasonal cycle is highly (r=−0.9) anticorrelated
with the water vapor variation in the TTL, showing higher cloud occurrence during DJF. We further investigate the anticorrelation on a regional scale and find that the high
10
anticorrelation occurs generally in the ITCZ (Intertropical Convergence Zone). The seasonal cycle of the cirrus ice water content is also highly anticorrelated to water va-por (r=−0.91) and our results support the hypothesis that the total water is roughly
constant in the TTL at 100 hPa. Temperature acts as a main regulator for balancing the partition between water vapor and cirrus clouds. Thus, to a large extent, the depleting
15
water vapor in the TTL during DJF is a manifestation of cirrus formation.
1 Introduction
Water vapor (H2O) is a key constituent of the Earth atmosphere and climate system. It
is the dominant greenhouse gas and has important impacts on atmospheric circulations through latent heat exchanges and redistribution of energy (Schneider et al., 2010). As
20
a source of clouds, water vapor has an indirect effect on the surface longwave and
shortwave radiation budget.
Water vapor is also important for the radiative balance and chemistry in the strato-sphere (de F. Forster and Shine, 1999). An increase in stratospheric water vapor tends to cool the stratosphere due to more longwave emission to space. Recent decadal
25
ACPD
11, 25037–25061, 2011Correlation of cirrus, water vapor and temperature in TTL
T. Flury et al.
Title Page
Abstract Introduction
Conclusions References
Tables Figures
◭ ◮
◭ ◮
Back Close
Full Screen / Esc
Printer-friendly Version Interactive Discussion
Discussion
P
a
per
|
Dis
cussion
P
a
per
|
Discussion
P
a
per
|
Discussio
n
P
a
per
|
Rosenlof et al., 2001) and it is still under debate how water vapor reaches the sphere (Chae et al., 2011). It is widely accepted that water vapor enters the strato-sphere through the tropical tropopause layer (TTL), which is the layer on top of the main cumulus outflow extending to∼1 km above the thermal tropopause. The TTL ex-tends approximately from 14 km (p=150 hPa, Θ =355 K) to 18.5 km altitude (70 hPa,
5
425 K) (Fueglistaler et al., 2009) representing a mixed layer having both tropospheric and stratospheric characteristics. The bottom of the TTL is usually defined by the level of zero net radiative heating. Above this level air tends to rise by radiative heating whereas below, it tends to sink. The top of the TTL is the maximum height of over-shooting convection.
10
Convection brings water vapor into the TTL and the interplay between transport and freeze-drying controls the amount of water vapor lifted into the stratosphere (Read et al., 2008). Yang et al. (2010) suggest that water vapor from overshooting convection can be radiatively lifted up to the stratosphere which is supported by measurements of Grosvenor et al. (2007) and Corti et al. (2008). Thus stratospheric water vapor is
15
closely linked to convection and vertical ascent in the TTL.
The ascent of TTL air is predominantly regulated by cirrus clouds that provide the necessary radiative heating to balance the adiabatic cooling produced by the slow as-cent of air that enters the stratosphere (Jensen et al., 2010). Cirrus above convective cumulus clouds prevail much longer in the atmosphere than the anvils below (Garrett
20
et al., 2004) and have a warming effect on the surface (Jensen et al., 2010). It is
thus crucial to know the water budget as well as the form of water in the TTL when it comes to determine its effect on surface warming since water vapor and cirrus have
opposite effects (Solomon et al., 2010). Wang et al. (1996) already stated that
cir-rus clouds are more frequent during Northern Hemisphere (NH) winter which is also
25
ACPD
11, 25037–25061, 2011Correlation of cirrus, water vapor and temperature in TTL
T. Flury et al.
Title Page
Abstract Introduction
Conclusions References
Tables Figures
◭ ◮
◭ ◮
Back Close
Full Screen / Esc
Printer-friendly Version Interactive Discussion
Discussion
P
a
per
|
Dis
cussion
P
a
per
|
Discussion
P
a
per
|
Discussio
n
P
a
per
|
Randel et al. (2004) showed that temperature and water vapor are correlated (r=
0.73) in the TTL using NCEP temperatures and UARS/HALOE satellite water vapor data. In this study we further investigate the roles of temperature in regulating the water partition between vapor and ice, not only for the TTL but also on a regional basis. We seek to better quantify the amount of cirrus clouds that can serve as a reservoir for TTL
5
water vapor. For this puropse we use data from the NASA A-Train satellite instruments MLS and CALIOP and determine the correlation of water vapor, cirrus cloud fraction and ice water content in the TTL in the years 2006–2011. Section 2 presents the data and method whereas Sect. 3 presents the results from the correlation studies. In Sect. 4 we discuss our findings and conclude in Sect. 5.
10
2 Data and method
In this study we use water vapor and cloud data from the NASA A-Train satellite instru-ments MLS (Microwave Limb Sounder) on Aura and CALIOP (Cloud-Aerosol Lidar with Orthogonal Polarization) on CALIPSO (Cloud-Aerosol Lidar and Infrared Pathfinder Satellite Observation), respectively. The data cover the time period from June 2006
15
(start of CALIPSO) to February 2011. MLS water vapor is retrieved from 316 hPa to 0.002 hPa from 82◦S to 82◦N. The data have been validated by Read et al. (2007). We use daily version 2.2 (v.2.2) data. MLS has a horizontal resolution of 200–300 km along track, 7 km across track and 3–4 km in the vertical. The fields are averaged and mapped onto a 4◦ latitude and 8◦ longitude grid. For this study we use the vertical
20
levels of 147 hPa, 121 hPa, 100 hPa, 83 hPa, 68 hPa, 56 hPa, 46 hPa, 38 hPa, 32 hPa, 26 hPa and 22 hPa but the study focuses on 100 hPa in the tropics.
CALIPSO cloud occurrence frequency and Ice Water Content (IWC) level 2 data are of version 3. This data has a horizontal resolution of 5 km and 60 m in the vertical (Winker et al., 2007). We binned the data to the coarser MLS grid described above.
25
ACPD
11, 25037–25061, 2011Correlation of cirrus, water vapor and temperature in TTL
T. Flury et al.
Title Page
Abstract Introduction
Conclusions References
Tables Figures
◭ ◮
◭ ◮
Back Close
Full Screen / Esc
Printer-friendly Version Interactive Discussion
Discussion
P
a
per
|
Dis
cussion
P
a
per
|
Discussion
P
a
per
|
Discussio
n
P
a
per
|
correlation study with water vapor presented in section 3.1. The NCEP data is provided on a 2.5◦by 2.5◦horizontal grid and on pressure levels from 1000 hPa to 10 hPa, but is also interpolated to the MLS horizontal and vertical grid.
In the following analysis we use daily Aura/MLS H2O and NCEP temperature data. Monthly and seasonal averages are determined out of the daily satellite and reanalysis
5
data and used for the correlation studies. The covered time period consists of 57 months which makes a total of 19 seasons. Hence the main results of our study rely on the 19 season time series whilst only one result is based on the daily data, namely the correlation of temperature and water vapor in Sect. 3.1.
3 Results
10
3.1 Water vapor dependence on temperature
Air masses entering the stratosphere in the tropics must pass through the low tem-perature at the tropopause with substantial dehydration. This was first recognized by Brewer (1949) after he had observed surprisingly low water vapor concentrations in the lower stratosphere. The process of temperature dependent dehydration can be
15
observed in the so called atmospheric tape recorder (Mote et al., 1996). The variations in TTL water vapor are slowly carried upward into the stratosphere and the signal is observable from 100 hPa to about 10 hPa.
In order to determine to what extent tropical 100 hPa temperatures control tropical and subtropical water vapor we calculated the correlation of the daily zonal mean water
20
vapor and the daily 100 hPa tropical zonal mean temperature (8◦S to 8◦N). The calcu-lation was made for the latitudes 40◦S to 40◦N at each pressure level from the upper troposphere to the mid stratosphere using Aura/MLS H2O and NCEP T time series
from August 2004 (start of Aura/MLS) to February 2011.
Since water vapor is transported upward and poleward from the tropics by the
25
ACPD
11, 25037–25061, 2011Correlation of cirrus, water vapor and temperature in TTL
T. Flury et al.
Title Page
Abstract Introduction
Conclusions References
Tables Figures
◭ ◮
◭ ◮
Back Close
Full Screen / Esc
Printer-friendly Version Interactive Discussion
Discussion
P
a
per
|
Dis
cussion
P
a
per
|
Discussion
P
a
per
|
Discussio
n
P
a
per
|
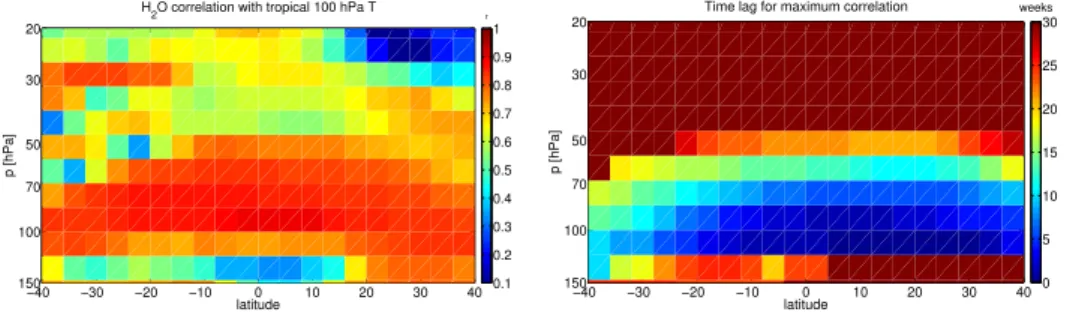
100 hPa temperatures at higher altitudes and higher latitudes. On account of this trans-port we determine the time lag (in weeks) in order to find the maximum correlation of tropicalT and H2O.
The left plot in Fig. 1 shows the maximum correlation of zonal mean water vapor and tropical 100 hPa temperatures between 150 hPa and 20 hPa as a function of time
5
lag displayed in the left plot. There is high correlation inside the tropics up to 20 hPa due to the rising water vapor (atmospheric tape recorder). The time lag is between 1 and 21 weeks from 100 hPa (∼16.4 km) to 56 hPa (∼20.1 km) which corresponds to an average vertical ascent rate of about 0.3 mm s−1, which is similar to results obtained by Schoeberl et al. (2008). Poleward transport is much faster and happens over a few
10
weeks. The time lag at 40◦N and 100 hPa is 7 weeks whilst the time lag at the same pressure level at 40◦S is 14 weeks which means that transport toward the Southern Hemisphere is slower. This is in agreement with the known characteristics of the BDC and the tropical pipe (Plumb, 1996). The correlation decreases with altitude and lat-itude because of mixing with other air masses and in situ water vapor production by
15
the oxidation of methane (CH4). It is interesting to see that the tropical water vapor at
121 hPa has no correlation to the 100 hPa temperature which suggests that the 100 hPa temperature is not controlled from below.
But the main result here is that the 100 hPa tropical temperature determines a large portion of lower stratospheric water vapor and its signal is carried upward and poleward
20
with the characteristic time scales of the BDC. Randel et al. (2004) found a maximum correlation coefficient of 0.73 using UARS/HALOE water vapor and NCEP
tempera-tures at 100 hPa. In this study the maximum value is 0.94. Aura/MLS data have a more uniform sampling than HALOE (HALOE took about 1 month to sample 1 latitude band compared to 1 day for MLS), which may explain the higher MLS correlation coefficients.
25
3.2 Seasonal cycle of water vapor and cirrus clouds
ACPD
11, 25037–25061, 2011Correlation of cirrus, water vapor and temperature in TTL
T. Flury et al.
Title Page
Abstract Introduction
Conclusions References
Tables Figures
◭ ◮
◭ ◮
Back Close
Full Screen / Esc
Printer-friendly Version Interactive Discussion
Discussion
P
a
per
|
Dis
cussion
P
a
per
|
Discussion
P
a
per
|
Discussio
n
P
a
per
|
answer this question we utilize CALIPSO cirrus cloud data. CALIPSO can detect thin and subvisible clouds in the TTL and lower stratosphere.
Figure 2 shows a composite map of CALIPSO cirrus cloud fraction (contours 5– 40 %) and MLS water vapor (color 2.5–5 ppm vmr) at 100 hPa averaged over 5 yr of the NH winter months December, January and February (DJF) on the left and the NH
5
summer months June, July and August (JJA) on the right. For DJF significant cloud cover is found over land (South America, Africa, Northern Australia) in the Inter Tropical Convegence Zone (ITCZ) and over the maritime continent (Indonesia) and the Tropical West Pacific (TWP). The TWP pacific is known for its coldest tropopause and supposed to be the region where water vapor is freeze-dried to the lowest values according to
10
saturation vapor pressure before it eventually enters the stratosphere through slow ascent (Gettelman et al., 2002; Fueglistaler et al., 2009). This region corresponds also to the lowest TTL water vapor values (dark blue∼2.5 ppm).
The JJA map on the right of Fig. 2 shows much higher water vapor values in the tropics (please notice the different color scale 3.5–6 ppm vmr) and especially in the
15
subtropical monsoon regions over Asia and America. This is the source region of high water vapor values which are later distributed over the globe and eventually enter the stratosphere visible as ascending branch of high H2O in the atmospheric tape recorder
(Mote et al., 1996). The higher temperatures lead to less cirrus cloud cover, except over Asia. This is likely due to an elevated tropopause. In JJA the tropopause over the
20
Indian monsoon region is around 85 hPa (not shown here) hence the 100 hPa level is more influenced by convection therefore cloud cover and water vapor are both elevated. The Brewer-Dobson circulation (BDC) distributes TTL water vapor from the tropics poleward into the lower stratosphere. This transport can be seen in a zonal mean wa-ter vapor time series on the 100 hPa level. Figure 3 shows the time series of monthly
25
ACPD
11, 25037–25061, 2011Correlation of cirrus, water vapor and temperature in TTL
T. Flury et al.
Title Page
Abstract Introduction
Conclusions References
Tables Figures
◭ ◮
◭ ◮
Back Close
Full Screen / Esc
Printer-friendly Version Interactive Discussion
Discussion
P
a
per
|
Dis
cussion
P
a
per
|
Discussion
P
a
per
|
Discussio
n
P
a
per
|
same season (DJF). Water vapor maxima can be found at about 25◦N in October. H2O is very low in 2008 and 2009 due to ENSO (La Ni ˜na) and QBO occurring in phase
(Liang et al., 2011) which led to colder TTL temperatures associated with faster BDC upwelling. Significant cirrus cloud fraction is found up to 35◦N whereas it ends at 25◦S. The highest cirrus fraction occurs during winter when water vapor is low. The poleward
5
transport of H2O can be identified to be faster to the NH and slower to the SH (evident
from the steeper bend of the surfaces of same color to the south).
3.3 Anticorrelation of water vapor and cirrus clouds
Figure 2 and 3 clearly suggest that cirrus cloud fraction and water vapor are anticorre-lated. In order to quantify the relation between cirrus clouds and water vapor at 100 hPa
10
we utilize cirrus ice water content (IWC), which is also measured by CALIPSO. IWC and cirrus cloud fraction are nearly perfectly correlated (r=0.99) hence the results we
show with IWC would be the same if cirrus cloud fraction would be used. However, IWC has a more useful meaning on the amount of water measured. Seasonal averages of 100 hPa water vapor and IWC are analyzed to derive their relationship in the TTL. The
15
here covered 5 yr seasonal time series of H2O and IWC consists of a total of 19 data
points at each location which are used for deriving the correlation.
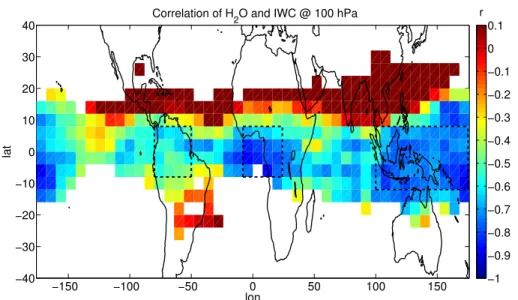
Figure 4 shows the correlation map of water vapor (H2O) and ice (IWC) at 100 hPa.
The coefficients are close to −1 inside the tropics over land as well as over ocean.
However the anticorrelation is higher over Indonesia and the Pacific Ocean than over
20
South America. The correlation is positive outside the tropics in the NH. This is due to the elevated tropopause during the monsoon season, where the positive correlation reflects tropical tropospheric air. For this reason we leave out latitudes north of 8◦N and define three regions for the TTL analysis. The dashed boxes in Fig. 4 highlight the defined regions Indonesia, Africa and South America.
25
ACPD
11, 25037–25061, 2011Correlation of cirrus, water vapor and temperature in TTL
T. Flury et al.
Title Page
Abstract Introduction
Conclusions References
Tables Figures
◭ ◮
◭ ◮
Back Close
Full Screen / Esc
Printer-friendly Version Interactive Discussion
Discussion
P
a
per
|
Dis
cussion
P
a
per
|
Discussion
P
a
per
|
Discussio
n
P
a
per
|
is given in units of mg m−3 and water vapor (H2O) in parts per million (ppm) volume
mixing ratio (vmr). At 100 hPa 1 ppm of water vapor corresponds to approximately 0.1 mg m−3of ice (using the ideal gas equation and meanT of 195 K for the TTL).
Figure 5 shows scatter plots of tropical H2O and IWC at 100 hPa. The investigated
regions are the entire Tropics, Indonesia, Africa and South America as highlighted in
5
Fig. 4 (Tropics: zonal mean 8◦S–8◦N, Indonesia: 12◦S–8◦N, 100◦E–170◦E, Africa: 8◦S–8◦N, 8◦W–24◦E, South America: 8◦S–8◦N, 80◦W–50◦W). Seasonal H2O and
IWC data are taken and averaged longitudinally and latitudinally in each domain. The linear regression equation is added in each Figure where the anticorrelation is clearly evident. The slopes are between −0.05 for the tropical zonal mean and −0.11 for
10
Indonesia. Hence the range of slopes encloses the theoretical vapor to ice conversion factor of−0.1 according to which freezing of 1 ppm H2O results in 0.1 mg m
−3
ice. The slope for Indonesia (−0.11) is closest to the theoretical one and might also be the best representative, since this is the region of highest cirrus cloud occurrence throughout the year. Hence time periods of no IWC are rare and do not affect the seasonal averages.
15
The slope for the tropical mean is lower because there are regions with much less IWC and hence the average is lower. These data clearly suggest that total water stays constant at 100 hPa in the ITCZ and that the temperature determines the partitioning between cirrus clouds (IWC) and water vapor.
The correlation coefficients of temperature and water vapor (T, H2O), temperature
20
and ice water content (T, IWC), water vapor and ice water content (H2O, IWC) as well as the slopes (mH
2O,IWC) of the regression lines of Fig. 5 and their uncertainties (∆mH
2O,IWC) are summarized in Table 1. The tabulated correlation of H2O and IWC does not represent the average of the correlation coefficients shown in Fig. 4 but the
correlation was calculated with the averages of H2O and IWC in each region instead.
25
The first and second column show that H2O and IWC are highly anticorrelated and
correlated with temperature, respectively. Our hypothesis of total water conservation at 100 hPa is supported by observations over Indonesia where the correlation coefficients
are highest and the slopemH
ACPD
11, 25037–25061, 2011Correlation of cirrus, water vapor and temperature in TTL
T. Flury et al.
Title Page
Abstract Introduction
Conclusions References
Tables Figures
◭ ◮
◭ ◮
Back Close
Full Screen / Esc
Printer-friendly Version Interactive Discussion
Discussion
P
a
per
|
Dis
cussion
P
a
per
|
Discussion
P
a
per
|
Discussio
n
P
a
per
|
4 Discussion
We showed in Fig. 1 that tropical 100 hPa temperatures determine TTL and lower stratospheric water vapor (H2O) and show high correlation with H2O (∼0.9) to
midlat-itudes and up to 20 hPa. The 100 hPaT is mainly controlled from above by variations in the BDC (cooler when strong BDC, warmer when weak BDC).
5
The temperature is also the key parameter which determines the partitioning of va-por and ice in the TTL. We anticipated that temperature acts as the regulator for the coherent water vapor and cloud variabilities by balancing the partition between water vapor and ice in cirrus clouds. A decrease in temperature increases the relative humid-ity which favors freezing. This hypothesis is supported by the correlation study of H2O
10
and IWC (Figs. 3 and 4). H2O and IWC are highly anticorrelated inside the tropics with
highest values over Indonesia where cirrus clouds are most abundant. Highest IWC values are directly linked to lowest H2O values (in DJF). The linear regression line of seasonal IWC and H2O over Indonesia (Fig. 5) furthermore strongly suggests that total
water at 100 hPa remains constant. Hence water switches seasonally between ice and
15
vapor. Thus the yearly decrease of about 2 ppm H2O over Indonesia from JJA to DJF translates into an icrease of about 0.2 mg m−3in IWC. This further supports that cirrus clouds to a large extent serve as a seasonal reservoir for TTL water vapor. In other words this study points up that the supply of water into the TTL, which is convection, does not have a strong seasonal cycle.
20
However there is no anticorrelation of H2O and IWC in the NH monsoon regions (i.e.
between∼10◦N and∼20◦N, 100 hPa, Fig. 4). This is due to the elevated tropopause which is around 85 hPa. Hence the analysed 100 hPa level is within the convection where H2O and cloud fraction are both enhanced. For this reason we chose our domain
of analysis south of 8◦N. The anticorrelation of H2O and IWC is a little smaller over
25
ACPD
11, 25037–25061, 2011Correlation of cirrus, water vapor and temperature in TTL
T. Flury et al.
Title Page
Abstract Introduction
Conclusions References
Tables Figures
◭ ◮
◭ ◮
Back Close
Full Screen / Esc
Printer-friendly Version Interactive Discussion
Discussion
P
a
per
|
Dis
cussion
P
a
per
|
Discussion
P
a
per
|
Discussio
n
P
a
per
|
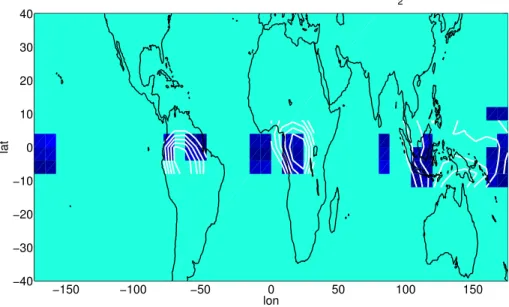
We also found that the region of highest correlation of water vapor and cirrus cloud fraction is generally away from the regions of highest cirrus cloud occurrence as seen in Fig. 6. White contours show the 5 yr average of cirrus cloud fraction. The data are normalized in each region and the contours show 60 % to 100 % of the maximum cir-rus cloud fraction in each region. The same normalization is applied to the maximum
5
anticorrelation of H2O and IWC (from Fig. 4). The highest anticorrelation for South
America and Indonesia (dark blue rectangles) is found offthe center of maximum
cir-rus occurrence. Maximum correlation is almost symmetrically East and West of the center of maximum cirrus over Indonesia. Over Africa, we also find a region of high anticorrelation far offthe center and offthe coast whilst there is still some collocation
10
in the center.
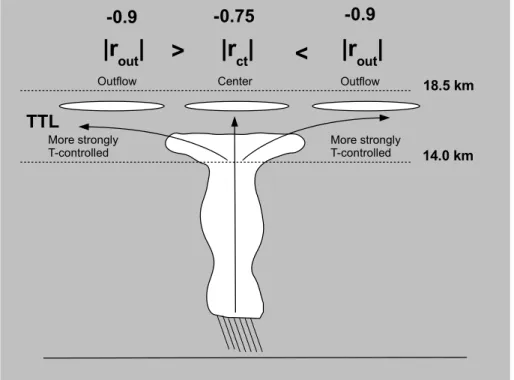
A plausible cause for the off-center correlation is that temperature could become
more potent to steer ice sublimation and evaporation in the outflow regions of the ITCZ as shown by the drawing in Fig. 7. The correlation is higher at the wings of the main convective areas than in the center where temperatures might be too low such that
15
a small increase in temperature is not sufficient to evaporate all the ice. Whilst in
the outflow regions the air is in the vicinity of the saturation condition and a small change in temperature can induce a phase change from ice to vapor and vice-versa, resulting in a higher anticorrelation between water vapor and cirrus clouds. Thus water is more strongly controlled by temperature in the outflow regions. But even inside the
20
main convective areas the correlation is about−0.75 which supports the hypothesis of conserved total water at 100 hPa. We will explore this idea in the future.
In sum decreased TTL temperatures reduce the amount of water vapor to favor the increase of cirrus clouds. The question is if this is also true for decadal temperature variations. The increase in stratospheric water vapor between the last two decades
25
ACPD
11, 25037–25061, 2011Correlation of cirrus, water vapor and temperature in TTL
T. Flury et al.
Title Page
Abstract Introduction
Conclusions References
Tables Figures
◭ ◮
◭ ◮
Back Close
Full Screen / Esc
Printer-friendly Version Interactive Discussion
Discussion
P
a
per
|
Dis
cussion
P
a
per
|
Discussion
P
a
per
|
Discussio
n
P
a
per
|
we speculate that there must have been as well an increase of a comparable amount in the tropics. If our result is valid for decadal variations then a decrease in cirrus cloud fraction or IWC would have occurred during the same time period. A gain of 0.74 ppm H2O would roughly correspond to a loss of 0.074 mg m−
3
IWC. We are not aware of any observations of TTL IWC from 1980 to 2000. But it would be interesting
5
to study this change with model simulations for the observed surface temperature in-crease (Solomon et al., 2010) to reproduce and test the effect of reduced IWC in cirrus
clouds.
Current general circulation models poorly represent the seasonal cycle of cirrus clouds and water vapor in the TTL. Our results suggest that the tropical 100 hPa
10
tropopause temperature determines the balance between cirrus cloud ice and water vapor at 100 hPa so that total water stays roughly constant. The seasonal cycle of wa-ter vapor is clearly anticorrelated with the seasonal cycle of cirrus cloud cover. There are more cirrus clouds during DJF when water vapor is low. This is a feature that is not yet represented in the GMAO GEOS-5 model (Global Modeling and Assimilation Office
15
Goddard Earth Observing System Model, Version 5). Jiang et al. (2010) showed that the model represents the seasonal cycle of water vapor at 100 hPa though the numbers disagree with Aura/MLS especially during JJA. But there is no clear anticorrelation with the modeled IWC. And there is also not enough IWC found in the SH tropics as sug-gested by CALIPSO data (Fig. 3). If this observed relationship is not well represented
20
by model physics it will certainly add to already large uncertainty in climate predictions since TTL water vapor and cirrus clouds have significant and opposite effects on the
Earth’s radiation budget.
5 Conclusions
We calculated the correlation of Aura/MLS water vapor and NCEP temperature as well
25
ACPD
11, 25037–25061, 2011Correlation of cirrus, water vapor and temperature in TTL
T. Flury et al.
Title Page
Abstract Introduction
Conclusions References
Tables Figures
◭ ◮
◭ ◮
Back Close
Full Screen / Esc
Printer-friendly Version Interactive Discussion
Discussion
P
a
per
|
Dis
cussion
P
a
per
|
Discussion
P
a
per
|
Discussio
n
P
a
per
|
100 hPa temperature and has a maximum correlation of 0.94. Water vapor is trans-ported upward and poleward following the Brewer-Dobson circulation and remains highly correlated with tropical 100 hPa temperatures throughout the lower stratosphere from tropics to midlatitudes. The correlation of T and H2O decreases rapidly above
20 hPa due to mixing with air masses from outside the TTL and local H2O production
5
by the oxidation of methane. The center of H2O transport is located at about 20◦N
dur-ing JJA and at the Equator durdur-ing DJF. High water vapor values are distributed durdur-ing JJA due to the convection in the monsoon regions, which brings a lot of H2O to 100 hPa as can be seen in Fig. 2. Poleward transport is faster than upward and also faster in the Northern Hemisphere.
10
Furthermore, we find a high anticorrelation of H2O and cirrus cloud fraction at 100 hPa in the tropics. The anticorrelation of water vapor and cirrus ice water content (r=−0.91) suggests that total water is constant throughout the year and temperature
determines the balance between water vapor and ice in cirrus clouds. This result puts emphasis on the fact that convection, which is the supplier of TTL water, has no strong
15
seasonal cycle. A linear regression analysis of H2O and IWC shows that the slope (in
[−0.11,−0.05]) encloses the theoretical slope of−0.1 if vapor is fully condensed in ice at 100 hPa in the TTL. Hence the seasonal cycle of water vapor is mainly a manifesta-tion of cirrus formamanifesta-tion leaving the total water at 100 hPa roughly constant. So basically cirrus clouds serve as a reservoir for TTL water vapor.
20
Current general circulation models (e.g. GMAO GEOS-5) do not represent the an-ticorrelation of water vapor and ice in the TTL and need to be improved to capture this important balance correctly since cirrus and water vapor have opposite effects on
global climate.
Further we find that the regions of highest anticorrelation are in the outflow regions of
25
the main convective areas. The reason for this is supposed to be related to a different
ACPD
11, 25037–25061, 2011Correlation of cirrus, water vapor and temperature in TTL
T. Flury et al.
Title Page
Abstract Introduction
Conclusions References
Tables Figures
◭ ◮
◭ ◮
Back Close
Full Screen / Esc
Printer-friendly Version Interactive Discussion
Discussion
P
a
per
|
Dis
cussion
P
a
per
|
Discussion
P
a
per
|
Discussio
n
P
a
per
|
Acknowledgements. The work of TF has been supported by the Swiss National Science Foun-dation and the National Aeronautics and Space Administration (NASA) at the Jet Propulsion Laboratory (JPL). The research by DLW and WGR was performed at JPL, California Institute of Technology under contract with NASA.
References
5
Brewer, A. W.: Evidence for a world circulation provided by measurements of helium and water vapor distribution in the stratosphere, Q. J. Roy. Meteor. Soc., 75, 351, doi:10.1002/qj.49707532603, 1949. 25041
Chae, J. H., Wu, D. L., Read, W. G., and Sherwood, S. C.: The role of tropical deep convective clouds on temperature, water vapor, and dehydration in the tropical tropopause layer (TTL),
10
Atmos. Chem. Phys., 11, 3811–3821, doi:10.5194/acp-11-3811-2011, 2011. 25039
Corti, T., Luo, B. P., de Reus, M., Brunner, D., Cairo, F., Mahoney, M. J., Martucci, G., Matthey, R., Mitev, V., dos Santos, F. H., Schiller, C., Shur, G., Sitnikov, N. M., Spel-ten, N., V ¨ossing, H. J., Borrmann, S., and Peter, T.: Unprecedented evidence for deep convection hydrating the tropical stratosphere, Geophys. Res. Lett., 35, L10810,
15
doi:10.1029/2008GL033641, 2008. 25039
Dessler, A. E., Palm, S. P., Hart, W. D., and Spinhirne, J. D.: Tropopause-level thin cirrus coverage revealed by ICESat/Geoscience Laser Altimeter System, J. Geophys. Res., 111, D08203, doi:10.1029/2005JD006586, 2006. 25039
de F. Forster, P. M. and Shine, K. P.: Stratospheric water vapor changes as a
possi-20
ble contributor to observed stratospheric cooling, Geophys. Res. Lett., 26, 3309–3312, doi:10.1029/1999GL010487, 1999. 25038
Fueglistaler, S., Dessler, A.-E., Dunkerton, T.-J., Folkins, I., Fu, Q., and Mote, P.-W.: Tropi-cal tropopause layer, Rev. Geophys., 47, 1004, doi:10.1029/2008RG000267, 2009. 25039, 25043
25
Garrett, T. J., Heymsfield, A. J., McGill, M. J., Ridley, B. A., Baumgardner, D. G., Bui, T. P., and Webster, C. R.: Convective generation of cirrus near the tropopause, J. Geophys. Res., 109, D21203, doi:10.1029/2004JD004952, 2004. 25039
Gettelman, A., Randel, W. J., Wu, F., and Massie, S. T.: Transport of water vapor in the tropical tropopause layer, Geophys. Res. Lett., 29, 1009, doi:10.1029/2001GL013818, 2002. 25043
ACPD
11, 25037–25061, 2011Correlation of cirrus, water vapor and temperature in TTL
T. Flury et al.
Title Page
Abstract Introduction
Conclusions References
Tables Figures
◭ ◮
◭ ◮
Back Close
Full Screen / Esc
Printer-friendly Version Interactive Discussion
Discussion
P
a
per
|
Dis
cussion
P
a
per
|
Discussion
P
a
per
|
Discussio
n
P
a
per
|
Grosvenor, D. P., Choularton, T. W., Coe, H., and Held, G.: A study of the effect of overshooting deep convection on the water content of the TTL and lower stratosphere from Cloud Resolv-ing Model simulations, Atmos. Chem. Phys., 7, 4977–5002, doi:10.5194/acp-7-4977-2007, 2007. 25039
Hurst, D. F., Oltmans, S. J., V ¨omel, H., Rosenlof, K. H., Davis, S. M., Ray, E. A., Hall, E. G.,
5
and Jordan, A. F.: Stratospheric water vapor trends over Boulder, Colorado: analysis of the 30 year Boulder record, J. Geophys. Res., 116, D02306, doi:10.1029/2010JD015065, 2011. 25047
Jensen, E. J., Pfister, L., Bui, T.-P., Lawson, P., and Baumgardner, D.: Ice nucleation and cloud microphysical properties in tropical tropopause layer cirrus, Atmos. Chem. Phys., 10, 1369–
10
1384, doi:10.5194/acp-10-1369-2010, 2010. 25039
Jiang, J. H., Su, H., Pawson, S., Liu, H.-C., Read, W. G., Waters, J. W., Santee, M. L., Wu, D. L., Schwartz, M. J., Livesey, N. J., Lambert, A., Fuller, R. A., and Lee, J. N.: Five year (2004– 2009) observations of upper tropospheric water vapor and cloud ice from MLS and compar-isons with GEOS-5 analyses, J. Geophys. Res., 115, D15103, doi:10.1029/2009JD013256,
15
2010. 25048
Liang, C. K., Eldering, A., Gettelman, A., Tian, B., Wong, S., Fetzer, E. J., and Liou, K. N.: Record of tropical interannual variability of temperature and water vapor from a combined AIRS-MLS data sets, J. Geophys. Res., 116, D06103, doi:10.1029/2010JD014841, 2011. 25044
20
Mote, P. W., Rosenlof, K.-H., McIntyre, M.-E., Carr, E.-S. Gille, J.-C., Holton, J.-R., Kinnersley, J.-S., Pumphrey, H.-C., Russel III, J.-M., and Waters, J.-W.: An atmospheric tape recorder: the imprint of tropical tropopause temperatures on stratospheric water vapor, J. Geophys. Res., 101, 3989–4006, doi:10.1029/95JD03422, 1996. 25041, 25043
Plumb, R. A.: A “tropical pipe” model of stratospheric transport, J. Geophys. Res., 101, 3957–
25
3972, doi:10.1029/95JD03002, 1996. 25042
Randel, W. J., Wu, F., Oltmans, S. J., Rosenlof, K., and Nedoluha, G. E.: Interannual changes of stratospheric water vapor and correlations with tropical tropopause temperatures, J. Atmos. Sci., 61, 2133–2148, doi:10.1175/1520-0469(2004)061h2133:ICOSWVi2.0.CO;2, 2004. 25039, 25042
30
ACPD
11, 25037–25061, 2011Correlation of cirrus, water vapor and temperature in TTL
T. Flury et al.
Title Page
Abstract Introduction
Conclusions References
Tables Figures
◭ ◮
◭ ◮
Back Close
Full Screen / Esc
Printer-friendly Version Interactive Discussion
Discussion
P
a
per
|
Dis
cussion
P
a
per
|
Discussion
P
a
per
|
Discussio
n
P
a
per
|
Manney, G. L., Pickett, H. M., Pumphrey, H. C., Rosenlof, K. H., Sabounchi, X., Santee, M. L., Schwartz, M. J., Snyder, W. V., Stek, P. C., Su, H., Takacs, L. L., Thurstans, R. P., V ¨omel, H., Wagner, P. A., Waters, J. W., Webster, C. R., Weinstock, E. M., and Wu, D. L.: Aura Micro-wave Limb Sounder upper tropospheric and lower stratospheric H2O and relative humidity with respect to ice validation, J. Geophys. Res., 112, D24S35, doi:10.1029/2007JD008752,
5
2007. 25040
Read, W. G., Schwartz, M. J., Lambert, A., Su, H., Livesey, N. J., Daffer, W. H., and Boone, C. D.: The roles of convection, extratropical mixing, and in-situ freeze-drying in the Tropical Tropopause Layer, Atmos. Chem. Phys., 8, 6051–6067, doi:10.5194/acp-8-6051-2008, 2008. 25039
10
Rosenlof, K. H., Oltmans, S.-J., Kley, D., Russel, J.-M., Chiou, E.-W., Chu, W.-P., Johnson, D.-G., Kelly, K.-K, Michelsen, H.-A., Nedoluha, G.-E., Remsberg, E.-E., Toon, G.-C., and McCormick, M.-P.: Stratospheric water vapor increases over the past half-century, Geophys. Res. Lett., 28, 1195–1198, doi:10.1029/2000GL012502, 2001. 25039, 25047
Schneider, T., O’Gorman, P.-A., and Levine, X.-J.: Water vapor and the dynamics of climate
15
changes, Rev. Geophys., 8, RG3001, doi:10.1029/2009RG000302, 2010. 25038
Schoeberl, M. R., Douglass, A.-R., Stolarski, R.-S., Pawson, S., Strahan, S.-E., and Read, W.-G.: Comparison of lower stratospheric tropical mean vertical velocities, J. Geophys. Res., 113, 24109, doi:10.1029/2008JD010221, 2008. 25042
Solomon, S., Rosenlof, K.-H., Portmann, R.-W., Daniel, J.-S., Davis, S.-M., Sanford, T.-J., and
20
Plattner, G.-K.: Contributions of stratospheric water vapor to decadal changes in the rate of global warming, Science, 327(5970), 1219–1223, doi:10.1126/science.1182488, 2010. 25038, 25039, 25048
Wang, P.-H., Minnis, P., McCormick, M. P., Kent, G. S., and Skeens, K. M.: A 6-year climatology of cloud occurrence frequency from Stratospheric Aerosol and Gas Experiment II
observa-25
tions (1985–1990), J. Geophys. Res., 101, 29407–29430, doi:10.1029/96JD01780, 1996. 25039
Winker, D. M., Hunt, W. H., and McGill, M. J.: Initial performance assessment of CALIOP, Geophys. Res. Lett., 34, 19803, doi:10.1029/2007GL030135, 2007. 25040
Wu, D. L., Chae, J. H., Lambert, A., and Zhang, F. F.: Characteristics of CALIOP attenuated
30
ACPD
11, 25037–25061, 2011Correlation of cirrus, water vapor and temperature in TTL
T. Flury et al.
Title Page
Abstract Introduction
Conclusions References
Tables Figures
◭ ◮
◭ ◮
Back Close
Full Screen / Esc
Printer-friendly Version Interactive Discussion
Discussion
P
a
per
|
Dis
cussion
P
a
per
|
Discussion
P
a
per
|
Discussio
n
P
a
per
|
Yang, Q., Fu, Q., and Hu, Y.: Radiative impacts of clouds in the tropical tropopause layer, J. Geophys. Res., 115, D00H12, doi:10.1029/2009JD012393, 2010. 25040
ACPD
11, 25037–25061, 2011Correlation of cirrus, water vapor and temperature in TTL
T. Flury et al.
Title Page
Abstract Introduction
Conclusions References
Tables Figures
◭ ◮
◭ ◮
Back Close
Full Screen / Esc
Printer-friendly Version Interactive Discussion
Discussion
P
a
per
|
Dis
cussion
P
a
per
|
Discussion
P
a
per
|
Discussio
n
P
a
per
|
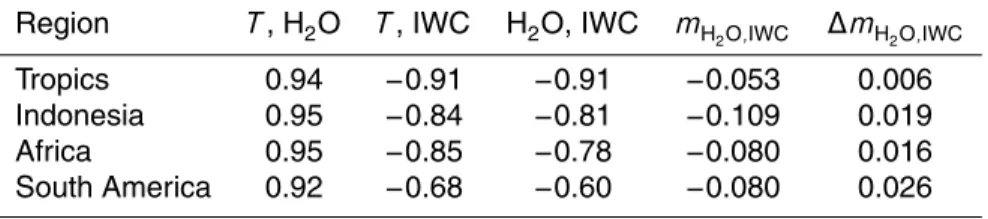
Table 1.Correlations ofT, H2O and ice water content (IWC) in different regions. Tropics (zonal mean 8◦S–8◦N), Indonesia (12◦S–8◦N, 100◦E–180◦E), Africa (8◦S–8◦N, 8◦W–24◦E), South America (8◦S–8◦N, 80◦W–50◦W). The first column shows that 100 hPa temperature and water vapor are highly correlated.T and IWC are highly anticorrelated with a smaller value over South America though. The third, fourth and fifth column show the correlation of H2O and IWC, the slope of the regression line as shown in Fig. 5 as well as the 2σuncertainty of the slope. The anticorrelation is high with lower values over South America. The slope in the selected regions is between−0.08 and−0.11 which is fairly close to the theoretically expected −0.1 if water transform totally from ice to vapor and back.
Region T, H2O T, IWC H2O, IWC mH 2O,IWC
∆mH 2O,IWC
Tropics 0.94 −0.91 −0.91 −0.053 0.006
Indonesia 0.95 −0.84 −0.81 −0.109 0.019
Africa 0.95 −0.85 −0.78 −0.080 0.016
ACPD
11, 25037–25061, 2011Correlation of cirrus, water vapor and temperature in TTL
T. Flury et al.
Title Page
Abstract Introduction
Conclusions References
Tables Figures
◭ ◮
◭ ◮
Back Close
Full Screen / Esc
Printer-friendly Version Interactive Discussion
Discussion
P
a
per
|
Dis
cussion
P
a
per
|
Discussion
P
a
per
|
Discussio
n
P
a
per
|
−40 −30 −20 −10 0 10 20 30 40
20
30
50
70
100
150
latitude
p [hPa]
H2O correlation with tropical 100 hPa T
r
0.1 0.2 0.3 0.4 0.5 0.6 0.7 0.8 0.9 1
−40 −30 −20 −10 0 10 20 30 40
20
30
50
70
100
150
latitude
p [hPa]
Time lag for maximum correlation weeks
0 5 10 15 20 25 30
ACPD
11, 25037–25061, 2011Correlation of cirrus, water vapor and temperature in TTL
T. Flury et al.
Title Page Abstract Introduction Conclusions References Tables Figures ◭ ◮ ◭ ◮ Back Close
Full Screen / Esc
Printer-friendly Version Interactive Discussion Discussion P a per | Dis cussion P a per | Discussion P a per | Discussio n P a per |
−150 −100 −50 0 50 100 150 −40 −30 −20 −10 0 10 20 30 40 lon lat
DJF mean H2O (color) and cirrus @ 100 hPa
5 5 5 5 5 5 5 5 5 5 5 5 10 10 10 10 10 10 10 15 15 15 15 15 15 15 20 20 20 20 20 20 25 25 25 25 25 30 30
3035 35
40 45 ppm 2.5 3 3.5 4 4.5 5
−150 −100 −50 0 50 100 150 −40 −30 −20 −10 0 10 20 30 40 lon lat
JJA mean H2O (color) and cirrus @ 100 hPa
5 5 5 5 5 5 5 5 10 10 15 15 20 20 25 30 35 ppm 3.5 4 4.5 5 5.5 6
ACPD
11, 25037–25061, 2011Correlation of cirrus, water vapor and temperature in TTL
T. Flury et al.
Title Page
Abstract Introduction
Conclusions References
Tables Figures
◭ ◮
◭ ◮
Back Close
Full Screen / Esc
Printer-friendly Version Interactive Discussion
Discussion
P
a
per
|
Dis
cussion
P
a
per
|
Discussion
P
a
per
|
Discussio
n
P
a
per
|
time
latitude
H
2
O (color) and cirrus fraction (contour) @ 100 hPa
0.01
0.01
0.01
0.01
0.01
0.01
0.01
0.06
0.06
0.06
0.06
0.06
0.06
0.06
0.06
0.06
0.11
0.11
0.11
0.11
0.11
0.11
0.16
0.16
2007
2008
2009
2010
2011
−40
−20
0
20
40
ppm
2
3
4
5
6
ACPD
11, 25037–25061, 2011Correlation of cirrus, water vapor and temperature in TTL
T. Flury et al.
Title Page
Abstract Introduction
Conclusions References
Tables Figures
◭ ◮
◭ ◮
Back Close
Full Screen / Esc
Printer-friendly Version Interactive Discussion
Discussion
P
a
per
|
Dis
cussion
P
a
per
|
Discussion
P
a
per
|
Discussio
n
P
a
per
|
−150 −100 −50 0 50 100 150
−40 −30 −20 −10 0 10 20 30 40
lon
lat
Correlation of H
2O and IWC @ 100 hPa r
−1 −0.9 −0.8 −0.7 −0.6 −0.5 −0.4 −0.3 −0.2 −0.1 0 0.1
ACPD
11, 25037–25061, 2011Correlation of cirrus, water vapor and temperature in TTL
T. Flury et al.
Title Page
Abstract Introduction
Conclusions References
Tables Figures
◭ ◮
◭ ◮
Back Close
Full Screen / Esc
Printer-friendly Version Interactive Discussion
Discussion
P
a
per
|
Dis
cussion
P
a
per
|
Discussion
P
a
per
|
Discussio
n
P
a
per
|
2.5 3 3.5 4 4.5 5 5.5 6
0
0.05
0.1
0.15
0.2
0.25
0.3
0.35
0.4
iwc [mg/m
3
]
Tropics
iwc=−0.05H2O+0.29
r=−0.91
2.5 3 3.5 4 4.5 5 5.5 6
0
0.05
0.1
0.15
0.2
0.25
0.3
0.35
0.4
Indonesia
iwc=−0.11H2O+0.54
r=−0.81
2.5 3 3.5 4 4.5 5 5.5 6
0
0.05
0.1
0.15
0.2
0.25
0.3
0.35
0.4
H
2
O [ppm]
iwc [mg/m
3
]
Africa
iwc=−0.08H
2O+0.45
r=−0.78
2.5 3 3.5 4 4.5 5 5.5 6
0
0.05
0.1
0.15
0.2
0.25
0.3
0.35
0.4
H
2
O [ppm]
South America
iwc=−0.08H
2O+0.44
r=−0.60
ACPD
11, 25037–25061, 2011Correlation of cirrus, water vapor and temperature in TTL
T. Flury et al.
Title Page
Abstract Introduction
Conclusions References
Tables Figures
◭ ◮
◭ ◮
Back Close
Full Screen / Esc
Printer-friendly Version Interactive Discussion
Discussion
P
a
per
|
Dis
cussion
P
a
per
|
Discussion
P
a
per
|
Discussio
n
P
a
per
|
−150 −100 −50 0 50 100 150
−40 −30 −20 −10 0 10 20 30 40
Maximum cirrus cloud fraction and maximum correlation of H2O and cirrus
lat
lon
ACPD
11, 25037–25061, 2011Correlation of cirrus, water vapor and temperature in TTL
T. Flury et al.
Title Page
Abstract Introduction
Conclusions References
Tables Figures
◭ ◮
◭ ◮
Back Close
Full Screen / Esc
Printer-friendly Version Interactive Discussion
Discussion
P
a
per
|
Dis
cussion
P
a
per
|
Discussion
P
a
per
|
Discussio
n
P
a
per
|
|r
out|
|r
ct
|
>
<
|r
out|
-0.9
-0.75
-0.9
TTL
18.5 km
14.0 km
Outflow Center Outflow
More strongly T-controlled
More strongly T-controlled