Discovery in Sequence Data: Application to
Protein Hydropathy
Omar Hadzipasic1, James O. Wrabl1, Vincent J. Hilser1,2*
1Department of Biology, Johns Hopkins University, Baltimore, Maryland, United States of America,2T.C. Jenkins Department of Biophysics, Johns Hopkins University, Baltimore, Maryland, United States of America
Abstract
An algorithm is presented that returns the optimal pairwise gapped alignment of two sets of signed numerical sequence values. One distinguishing feature of this algorithm is a flexible comparison engine (based on both relative shape and absolute similarity measures) that does not rely on explicit gap penalties. Additionally, an empirical probability model is developed to estimate the significance of the returned alignment with respect to randomized data. The algorithm’s utility for biological hypothesis formulation is demonstrated with test cases including database search and pairwise alignment of protein hydropathy. However, the algorithm and probability model could possibly be extended to accommodate other diverse types of protein or nucleic acid data, including positional thermodynamic stability and mRNA translation efficiency. The algorithm requires only numerical values as input and will readily compare data other than protein hydropathy. The tool is therefore expected to complement, rather than replace, existing sequence and structure based tools and may inform medical discovery, as exemplified by proposed similarity between a chlamydial ORFan protein and bacterial colicin pore-forming domain. The source code, documentation, and a basic web-server application are available.
Citation:Hadzipasic O, Wrabl JO, Hilser VJ (2013) A Horizontal Alignment Tool for Numerical Trend Discovery in Sequence Data: Application to ?Protein Hydropathy. PLoS Comput Biol 9(10): e1003247. doi:10.1371/journal.pcbi.1003247
Editor:Jacquelyn S. Fetrow, Wake Forest University, United States of America ReceivedApril 19, 2013;AcceptedJuly 10, 2013;PublishedOctober 10, 2013
Copyright:ß2013 Hadzipasic et al. This is an open-access article distributed under the terms of the Creative Commons Attribution License, which permits unrestricted use, distribution, and reproduction in any medium, provided the original author and source are credited.
Funding:This work is supported by the NSF USA MCB-0446050 (http://nsf.gov) and the NIH USA GM063747 (http://nih.gov). Publication of this article was funded in part by the Open Access Promotion Fund of the Johns Hopkins University Libraries. The funders had no role in study design, data collection and analysis, decision to publish, or preparation of the manuscript.
Competing Interests:The authors declare that a United States Patent Application relating to the HePCaT algorithm has been filed, and is pending, on behalf of The Johns Hopkins University.
* E-mail: hilser@jhu.edu
This is aPLOS Computational BiologyMethods article.
Introduction
Determining the evolutionary relatedness of two protein sequences is most successfully performed by amino acid sequence comparison [1–5]. However, it is well known that structure can be preserved even when sequence has diverged past the point of amino acid similarity recognition [6], suggesting that sequences can bestow local, subglobal, and global properties to a protein that can be preserved in the absence of strict conservation of the side chain atoms. In other words, similar properties could exist horizontally in a sequence even when recognizable vertical conservation is lost [7]. Even if such similarities are due to analogy rather than homology [8], approaches are needed that can augment sequence based analysis by matching patterns that may be independent of amino acid conservation at each position. Comparison of three-dimensional atomic structures [9–13] is one example of such pattern matching. However, protein func-tion and evolufunc-tion arise from a manifold of physical, chemical, and biological mechanisms, only partly accounted for by side chain identity or structural similarity [14–18]. It may be the case that proteins can also be meaningfully characterized by other attributes, such as the energetic contributions to stability [19] or
the predicted codon translation efficiency along the mRNA [20– 22]. Yet, such attributes are not easily accommodated by simple adaptation of current algorithms, largely because the scoring systems for such algorithms are based on positional sequence identity (amino acid substitution matrices) or absolute geometric structural similarity (Euclidean distance).
As a result, properties other than sequence and structure, and their additional potential biological insight into proteins, have not been as thoroughly explored. For example, the local thermody-namic stability of a protein, as experimentally measured by deuterium-hydrogen exchange [23,24], is described by a one-dimensional sequence of numerical values (i.e. amide protection factors). These values are well-known to be a combination of sequence, structure, and solvent effects [25], but no substitution matrix or distance measure exists for the objective comparison of two sets of protection factors. As such, important relationships could be overlooked, or worse, erroneous knowledge could be inferred from comparisons that separate the effects (e.g.comparing side chain identity in the absence of information about the thermodynamic stability at the same position).
gap penalties. Such heuristics hinder the algorithms’ transferability to different proteins or applicability to data types other than transmembrane protein hydrophobicity. In addition, the scoring functions for hydrophobicity analysis are often based on template-based matching or absolute similarity [30], and while this is effective at finding matches that are similar in both shape and magnitude, two sets of data that describe the same shape, but are offset by a scalar value, would be missed. For example, such a case can arise for experimentally measured local thermodynamic stabilities of proteins, where the relative stabilities of the same structural region of two homologs are observed to be strikingly similar, yet offset by a constantDDG value [31]. Finally, some of these previous tools lack the capability for large database searches or do not include estimates of statistical significance, limiting their usefulness and effectiveness even for the appropriate input data.
To address these shortcomings, we have developed a tool to compare the internal consistency of one-dimensional profiles defined by arbitrary sequences of numerical data. To maximize the flexibility of the tool, we have deliberately chosen in the design to include two metrics that match both the relative shapes of the two profiles as well as the absolute similarity of the numerical values. Thus, the scoring system is designed to be independent of the input data type (as opposed to the tool’s probability model which is very much dependent on the data type). Since this design emphasizes the closeness in shape of the two sets scanned over a horizontal range of positions, in contrast to the vertical position-by-position independent scoring of a standard amino acid substitution matrix, the algorithm is named Horizontal Protein Comparison Tool(HePCaT).
Materials and Methods
Detailed description of theHePCaTalgorithm
The algorithm proceeds by creating internal signed distance matrices from each of two sets of input numerical data vectorsv
(Figure 1, Steps 1 and 2). The vector is composed ofMelements given a protein of length M residues. In the following develop-ment,videnotes an arbitrary numerical value at residuei. For a
protein of Mresidues, each element of its distance matrixD is defined as
Di~1::M,j~1::M~sign vi{vj
ffiffiffiffiffiffiffiffiffiffiffiffiffiffiffiffiffiffi vi{vj
2
q
ð1Þ
The signed distance matrices, while not symmetric, are reflections across the diagonal (Figure 1, Step 2). Thus, both shape and magnitude information about each data set are encoded in these matrices. For example, the Protein 2 matrixD2(Figure 1, Step 2)
clearly indicates the strong local maximum in the N-terminal half relative to the strong local minimum in the C-terminal half as prominent red or blue regions.
Equation 1 demonstrates a key conceptual difference from structure comparison algorithms that are usually based on distance or contact matrices restricted to only positive values [32,33]. This difference reflects the nature of the information being compared. For structure comparison, the distance between two atoms is identical whether it is computed between the first and second atom or vice versa, while in the case of thermodynamic stability, for example, there may be a relative stabilization between the first and second atoms, which becomes a relative destabilization between second and first. The sign in Equation 1 thus represents this key conceptual difference: a ‘‘distance’’ inHePCaThasbothsign and magnitude. (It is noted that Equation 1 may be extended to an arbitrary number of mathematical dimensions, but the present work only considers the one-dimensional case.)
A shape similarity matrix,S, is then constructed from the two distance matrices (Figure 1, Step 3). To speed the calculation, a heuristic window size,W, is introduced. (In this work,Wis always five residues, but we note that this is potentially an adjustable parameter and a completely exhaustive search may be performed withW= 1.) For each position i = M2(W21)in Protein 1 and each position j = N2(W21) in Protein 2, the relative shape similarity is computed between the two five-residue blocks originating at positionsiandj:
Si~1::M{(W{1),j~1::N{(W{1)~
1 W
X W{1
k~0
D1i,izk{D2j,jzk
ð2Þ
Equation 2 is simply the average absolute value of the difference of equivalenced internal distances between the two blocks. If the shape similarity is high this value will be small, if the shape similarity is very different this value will be large. Such dissimilarity can be readily viewed for the example proteins: the Figure 1 similarity matrix contains strong positive values (darkest red) where the large peak in the middle of the first protein coincides with the deep valley in the C-terminal region of the second (orvice versa).
In this implementation, the signed internal distances within each block ofW= 5 residues are scaled such that the longest absolute value of the internal distance is one,
Di,izk~
Di,izk maxabs Dð i,izkÞDk
~W k~1
ð3Þ
Although this normalization can be disabled, we believe that emphasizing comparison of relative shape improves detection of relative trends in biological data, which can exhibit wide variations in scale. Practically, normalization also intuitively simplifies the choice of the user-defined alignment shape similarity cutoff, as described below.
Author Summary
The optimal alignment between Proteins 1 and 2 is found by exhaustive search of the shape similarity matrix (Figure 1, Steps 4 and 5). ‘‘Optimal’’ is defined as the largest unique set of blocks of size W, subject to at most GapMax skipped positions of the similarity matrix between blocks, which exhibits the smallest
RMSD of all such sets passing a user-defined shape similarity cutoff,C. IfC= 0, exact shape matches only are permitted in the alignment list. For this work, where Equation 3 applies,Cwas set to 0.40, meaning that an alignment whose average normalized distance between two five residue blocks was at most 40% different was counted as a matching shape. If Equation 3 were disabled,C
would have to be adjusted empirically based on the dynamic ranges of data compared.
The algorithm starts at cell (1,1) ofS(i.e.the lower left corner of the matrix in Figure 1, Step 3), corresponding to the average
difference between the scaled intraprotein distances of residues 1– 5 in Protein 1 and residues 1–5 in Protein 2. If S1,1,=C, this match is kept and positionS6,6is checked, until all cells ofSare evaluated up to the position SM-W
+1,N-W+1 (i.e. the upper right corner of the matrix in Figure 1, Step 3). If at any pointSi,j.C, single cell gaps are inserted in one or both sequences up to a maximum of GapMaxin an attempt to obtain the longest path throughSsubject toC. A list of the longest gapped paths is kept at this stage (Figure 1, Step 3, colored arrows). Therefore, all paths in this list are comprised of equivalenced positions in the two proteins such that, on average, the intraprotein distances seen at every position match to at least degreeC; this average value is named Average Path Distance (APD, Figure 1, Step 4). GapMax was empirically set to 4 for this work. No penalty is applied toAPDfor insertion of a gap. Importantly, at this first stage only relative Figure 1. Overview of the Horizontal Protein Comparison Tool (HePCaT) algorithm.The hydropathy profiles of two hypothetical proteins, each of lengthM=N= 20 residues, are shown (Step 1). Intraprotein signed distances are computed within each protein according to Equation 1 in the main text (Step 2). Positive distances,e.g. measured from a residue with a local minimum value to a residue with a local maximum value, are indicated in red, negative distances in blue. The signed distance matrices are therefore square and symmetrically reflected across the diagonal. Distances for protein 1 and protein 2 correspond to matricesD1andD2, respectively. The similarity matrixS that ultimately compares the two proteins is constructed from the average absolute distance differences ofW= 5 residue blocks betweenD1andD2, according to Equation 2 (Step 3). InS, light colored squares indicate blocks ofW= 5 residues starting at residueiin protein 1 and residuejin protein 2 with similarly shaped hydropathy, dark squares indicate dissimilar shapes. (Si = 1,j = 1is the lower left corner in the figure.) As described in the text,Sis exhaustively searched and all longest
alignments with up to possiblyGapMaxgaps, whose squares (average path distance,APD) pass a user-defined average similarity cutoffC, are kept in a list (set of colored arrows). The alignment of this list with the closest absolute shape (lowestRMSD) is defined as the optimal match (Step 5). An Optimal Path Score (OPS), defined by Equation 4, is assigned to the alignment and its significance is computed with respect to the score distribution of random alignments of identical length (Step 6). Note that the example alignment, while a reasonable visual match, is only marginally significant with respect to random alignments of identical length, due to its short length of 10 residues.
shape similarity is checked; any systematic offset between the two data sets is ignored because only the differences between intraprotein distances are evaluated.
After S has been exhaustively searched, the list of longest alignments passing the shape cutoff is filtered by RMSDof the aligned positions (Figure 1, Step 5). The smallestRMSDalignment is defined as the optimal (thus, theRMSDis effectively a magnitude filter). If multiple alignments of identical longest length happen to exhibit identical RMSD, only the first such one encountered is returned. In HePCaT, the RMSD calculation is executed after translation of both sets to data to their respective centers-of-mass, thus effects of a global offset between each data set are again minimized. Following Jia,et al.[34], we define an Optimal Path Score (OPS) for this optimal alignment according to the formula:
OPS~RMSD
L 1z
Gaps L
ð4Þ
In Equation 4, L is the alignment length andGaps is the total number of cells skipped inSto obtain that alignment. Note that, as mentioned above, gaps are not explicitly penalized during alignment, but gaps will penalize the final score according to Equation 4, under the reasonable and common assumption that a gapless match is a ‘‘better’’ match than a gapped one. Alternatively, the GapMax parameter could be set to zero if desired so that all gaps are forbidden.
A probability model to estimate the significance of anOPSscore
s of an alignment of length L was derived from analysis of randomly generated alignments (Figure 1, Step 6). It is important to realize that a probability model is specific to the type of data aligned and must also be recalibrated for a specific combination of
W, C, and GapMax. The probability model for Kyte-Doolittle hydropathy [35], averaged over a 15-residue window, is listed in Tables 1 and 2 and was built for the following HePCaT
parameters: W= 5 residues, GapMax= 4 residues, C= 0.4 with the local scaling of Equation 3. (Other probability models have been constructed and tested by the authors, including models based on eScape predicted native state thermodynamic stability [19], and predicted translation efficiency index tAI[20,21], and are available upon request.)
Construction of probability model
Significance of the Equation 4 score of optimal HePCaT
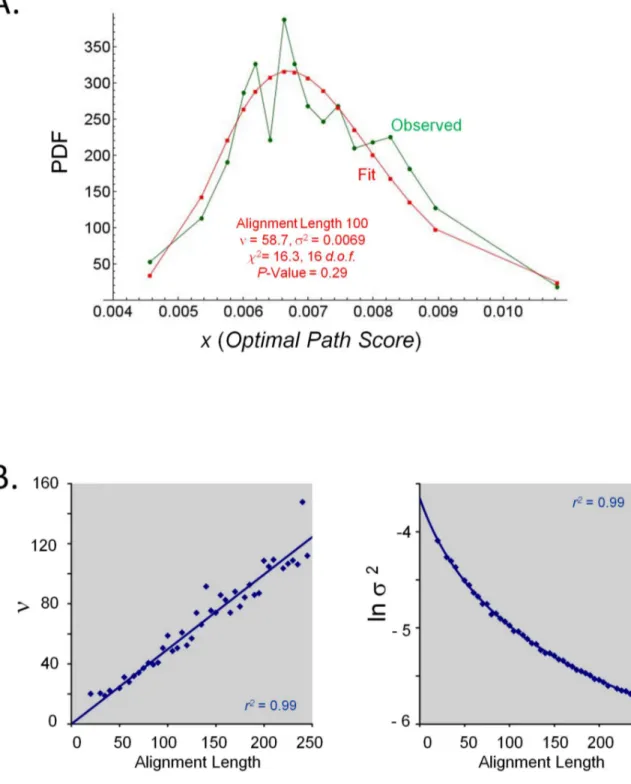
alignments was estimated with respect to the scores of optimal alignments of identical length between proteins of random amino acid sequence. Two random proteins of equal lengths between 10 and 500 residues were generated according to background amino acid frequencies as given by Robinson & Robinson. [36] Sets of at least 20,000 such pairs for each length were optimally aligned using HePCaT, and the distributions of Equation 4 scores for a given optimal alignment length from the entire pool were tabulated (Figure 2A). It was observed that these skewed unimodal distributions exhibited a strong dependence on alignment length (Figure 2B). Out of several possible two-variable formulae, it was empirically determined that these score distributions were statistically best fit by Scaled Inverse Chi-Squared probability density functions (Figure 2, Tables 1 and 2) [37],
PDFInverseChiSquaredx;v,s2DL~
s2n 2
n2 e{s2n
2x C n 2 x 1zn 2 ð5Þ
In Equation 5, L is optimal alignment length, and C(x) is the
Gamma function. [38] Parametersn and s2
were estimated by minimum chi-squared fits to the binned score data at each observed alignment length (Figure 2A). Binning and parameter estimation were performed using customMathematica 8.0 scripts, such that each variable-width bin contained at least 20 points, additional details are provided in Table 1.
Ad-hocanalytical expressions were fitted to the collected best-fit parameters of Equation 5 as a function of optimal alignment lengthL(Figure 2B):
nðLDW,C,GapMaxÞ~m Lð Þ ð6Þ
s2ðLDW,C,GapMaxÞ~eazblnðLzcÞ ð7Þ
Determination of coefficients a, b, c, and m only employed reasonably well-fit Equation 5 values whose null hypotheses (i.e.
that the simulated data were drawn from Inverse Chi Square Distributions) could not be rejected atp,0.05. Equations 6 and 7 coefficients for protein hydropathy are given in Table 2, all resulted from excellent fits of R2= 0.99 or better using gnumeric
spreadsheet software (Figure 2B).
Therefore, given an observed optimal HePCaT alignment of lengthLwith Equation 4 scores, the probabilitypof observing that alignment of protein hydropathy by chance could be estimated from the corresponding Scaled Inverse Chi-Squared cumulative distribution function as:
p sðjL,W,C,GapMaxÞ~
ð xvs
0
PDFInverseChiSquaredx,nð Þ,L s2ð ÞLdx~ ð xvs
0 Q n
2, s2n
2x
dxð8Þ
In Equation 8, Q(a,x) is the complement of the regularized Gamma function [38];nands2were estimated from Equations 6 and 7, using coefficients of Table 2.
Clustering of membrane protein structures based on hydropathy
All 1604 amino acid sequences corresponding to every membrane protein structure in SCOP 1.73 (class f ) [39] were obtained from the ASTRAL domain database [40] and clustered at 70% sequence identity by the cd-hit server [41], resulting in 214 representative sequences. The Kyte-Doolittle hydropathy values [35] for each sequence were averaged over a window size of 15 residues, with the average being assigned to the middle position of the window. These 214 hydropathy profiles were then compared usingHePCaTin an all-vs-all manner, with the probability value for each optimal match computed using the model coefficients listed in Table 2. For each protein, a vector of length 214 containing the probability values against all other proteins was constructed. These 214 vectors were then clustered by Manhattan Distance and Ward’s minimum variance criterion as implemented in the Hierarchical Clustering Package of Mathematica 8.0
(Wolfram Research) to create a dendrogram. A similar tree was computed from FASTA [42] E-values of all pairwise sequence comparisons. Significance of each grouping was estimated using the bootstrap ‘‘Gap Test’’ option of the software.
Hydropathy database search of the human proteome using adenosine receptor A2a as query
(April 30, 2008). Each amino acid in every protein was assigned a value according to the Kyte-Doolittle hydropathy scale.[35] The values for each protein were averaged using a 15 residue sliding window; averaged values for the first and last seven residues in each protein were subsequently ignored. The averaged values for the G-protein coupled receptor (GPCR) human adenosine receptor A2a (CCDS 13826.1, gi|5921992) were used as query against the human proteome,i.e.the averaged hydropathy values of each protein in the proteome were optimally pairwise aligned to A2a using HePCaT with the following parameters: W= 5 residues,C= 0.4,GapMax= 4 residues.P-values for each alignment were computed using the probability model specific to these data as described above. GPCRs were checked and annotated in our local copy of the human proteome byFASTA-aligning [42] amino acid sequences of the proteome with amino acid sequences of known GPCRs obtained from theGPCRDB [44]. Modeling was performed with a local installation of I-TASSER software [45] using default parameters. Structural similarity between the first I-TASSER model and known proteins was assessed using the DALI server [46].
Discovery of similarity betweenORFanproteinTC0624
and colicin pore-forming domain
A dataset of 8812 ORFan protein sequences was obtained from Yomtovian,et al. [47] As described above,HePCaT was used to optimally align the Kyte-Doolittle averaged hydropathy profiles of each ORFan protein with the profile of each member of the non-redundant set of 214 membrane proteins of known structure described above Secondary structure prediction was performed using the PSIPRED server [48] [49] and Hidden Markov Model sequence profile comparison was performed using the HHpred server [50], both with default parameters. Modeling was performed with a local installation of I-TASSER software [45] using default parameters. Structural similarity between the first I-TASSER model and known proteins was assessed using the DALI server [46]. Table 1.Goodness of fit statistics between Scaled Inverse Chi
Squared probability distribution function (Equation 5) and OPSscore distributions of various length optimalHePCaT alignments of random amino acid sequences.
Hydropathy
Kyte-Doolittle Hydropathy, averaged over 15 residues
W= 5 residues
GapMax= 4 residues
C= 0.4
HePCaTAlignment
Length n lns2 x2 d.o.f. P-Value N
20 20.030 24.092 19.4 20 0.37 433
25a
30 20.444 24.266 2.3 9 0.94 205
35 18.771 24.305 9.8 15 0.71 322
40 22.152 24.371 16.8 17 0.33 365
45
50 23.895 24.507 10.2 14 0.60 309
55 31.086 24.556 23.7 17 0.07 368
60 27.883 24.634 17.9 19 0.39 414
65 31.871 24.675 9.1 17 0.87 379
70 34.017 24.751 11.3 15 0.58 339
75 37.144 24.752 16.0 19 0.52 405
80 40.667 24.860 15.5 19 0.56 419
85 39.468 24.851 19.2 17 0.21 374
90 40.866 24.903 15.1 16 0.37 343
95 50.460 24.935 19.0 18 0.27 386
100 58.710 24.974 16.3 16 0.29 352
105 48.502 25.033 15.0 15 0.31 329
110 50.481 25.038 5.4 11 0.80 254
115 60.850 25.074 6.9 14 0.86 315
120 52.309 25.114 8.6 12 0.57 267
125 56.929 25.160 7.4 13 0.76 295
130 73.921 25.170 11.6 12 0.31 279
135 66.086 25.231 3.7 13 0.98 282
140 91.441 25.262 8.4 11 0.50 251
145 75.360 25.265 4.6 12 0.92 276
150 74.003 25.289 5.2 13 0.92 296
155
160 82.535 25.341 8.7 14 0.73 308
165 74.069 25.378 7.9 15 0.85 331
170 87.990 25.403 12.0 14 0.45 319
175 78.128 25.437 19.1 17 0.21 362
180 84.227 25.449 22.2 17 0.10 360
185 92.662 25.472 9.8 15 0.71 332
190 85.812 25.493 12.0 16 0.61 343
195 86.967 25.531 12.7 16 0.55 344
200 108.592 25.540 12.5 14 0.41 319
205 104.753 25.565 13.1 15 0.44 332
210 109.308 25.603 9.8 14 0.64 317
215
Table 2.Parameters used in Equations 6 and 7 to estimate length-dependent random protein data probability
distributions based on the Inverse Chi-Squared Distribution.
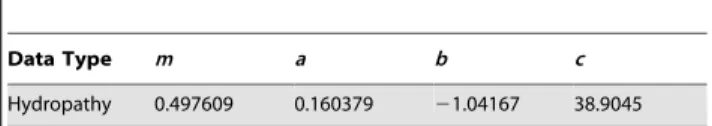
Data Type m a b c
Hydropathy 0.497609 0.160379 21.04167 38.9045
doi:10.1371/journal.pcbi.1003247.t002 Table 1.Cont.
HePCaTAlignment
Length n lns2 x2 d.o.f. P-Value N
220 103.593 25.631 11.9 12 0.29 262
225 106.655 25.651 9.2 12 0.51 260
230 108.842 25.658 5.1 9 0.65 213
235 106.144 25.687 9.1 9 0.25 203
240 147.619 25.705 6.2 9 0.52 201
245 111.964 25.717 4.7 7 0.45 173
aBlank rows for certain alignment lengths indicate that the null hypothesis (i.e.
that the distribution ofOPSscores for randomly generated sequences was drawn from an underlying inverse chi square distribution) was rejected at the p,0.05 level.
Figure 2. Empirically determined probability model for protein hydropathy. A. Inverse Chi-Squared model for the distribution of observed scores.Distributions of Equation 4 scores forHePCaTalignments of lengthL= 100 obtained from parametersW= 5 residues,GapMax= 4 residues,C= 0.4. Pairs of random sequences were generated, their Kyte-Doolittle amino acid hydropathies averaged over a 15-residue window, and subjected to optimal alignment usingHePCaT, as described in the text. Binned data in each case was reasonably fit to the Inverse Chi-Squared probability distribution function (PDF, Equation 5), as described in Methods and tabulated in Table 1.B. Analytical parameters to estimate statistical significance.Parametersnands2for the PDF were observed to vary smoothly as a function ofHePCaTalignment length, allowing the parameters, and thus alignment significance, to be analytically estimated for arbitrary alignment length using Equations 6 and 7 and parameters in Table 2. Discrete best-fit parameters for n and s2 are given in Table 1. Equations for displayed best-fit curves are as follows: y = 0.497609x (Hydropathy,n), y = 0.160379–1.04167 ln(x+38.9045) (Hydropathy,s2).
Results
The biological utility ofHePCaTwas assessed by exploring three different questions relating to protein hydropathy: sequence clustering of known membrane protein structures, similarity search against a database, and structure prediction of an ORFan protein. Results described below provided biological insight and testable hypotheses from these common bioinformatics tasks. However, it is emphasized that the results are not intended to demonstrate improvement ofHePCaTover current state-of-the-art methods for sequence and structure comparison, rather, the results do illuminate strengths and weaknesses of the algorithm’s current implementation.
Clustering of known membrane protein structures based on common hydropathy patterns
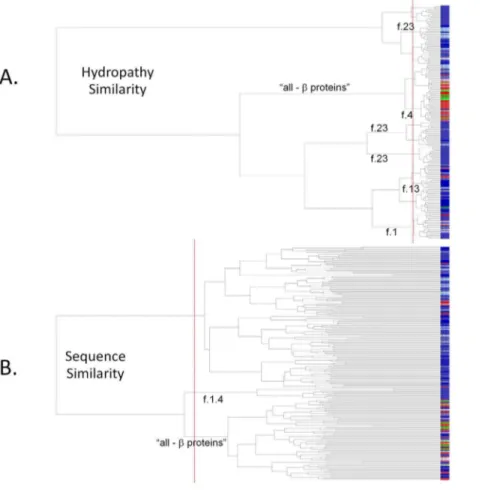
Unlike most globular proteins, most membrane protein structures can be classified, independent of evolutionary relationships, into two main groups, ‘‘all-alpha’’ and ‘‘all-beta’’, based on structural characteristics alone [51,52]. One dominant characteristic is the
requirement for stability within the nonpolar interior of the membrane, and this is reflected in recurring patterns of defined length hydrophobic segments, imposed by the physical constraints of alpha-helical or beta-strand secondary structure elements. Such patterns can be used for the effective prediction of transmembrane spanning segments and fold topology of the inserted protein [53–55]. Analysis and clustering of a set of diverse membrane protein structures, based on similarities in the proteins’ average hydrop-athy patterns usingHePCaT, reflects this major level of structural organization (Figure 3A). In this dendrogram, the ‘‘all-beta’’ proteins clearly segregate into distinct and statistically significant sub-branches of the tree. Finer levels of overall fold similarity, including the G-protein coupled receptors (f.13), toxins’ mem-brane translocation domains (f.1), and the transmemmem-brane beta barrels (f.4), can also largely be resolved only on the basis of hydropathy similarity (labeled sub-branches in Figure 3A). Inter-estingly, proteins belonging to f.13, annotated as ‘‘single transmembrane helix’’ and thus ‘‘not a true SCOP fold’’ [56], are spread among several dispersed sub-branches, consistent with this provisional expert curation.
Figure 3. Clustering of known membrane protein structures by hydropathy similarity.Dendrogram leaves are members of a set of 214 representative membrane protein structures taken from SCOP 1.73, as described in the text. Blue colors denote proteins of all (or mostly) alpha helical secondary structure, red colors denote proteins of all (or mostly) beta strand secondary structure, and green colors indicate proteins of mixed structure. Identical shades of color denote identical SCOP fold. Particular sub-branches that significantly cluster according to known evolutionary or structural relationships are labeled by SCOP fold. Vertical dashed red lines indicate statistical significance of the clustering.A. Dendrogram based on hydropathy similarity.Branch lengths are inversely proportional to theHePCaTsignificance of the pairwise similarity between hydropathy patterns (i.e.shorter branch lengths indicate higher similarity).B. Dendrogram based on sequence similarity.Branch lengths are inversely proportional to FASTA E-value of pairwise sequence similarity. For these diverse proteins, both sequence and hydropathy similarity differentiate beta proteins from alpha proteins. However, theHePCaTbeta dendrogram cluster is evidently more homogenous than theFASTAbeta cluster, and more individual protein folds are segregated based on hydropathy similarity than by sequence similarity. Both observations suggest that meaningful information about protein structure and evolution can be objectively detected by theHePCaTalgorithm.
In contrast, clustering of the identical proteins based on pairwise amino acid sequence similarity alone appears less resolved at levels higher than pairs of highly similar sequences (Figure 3B). In particular, the ‘‘all-beta’’ proteins, while also resolved to a particular statistically significant sub-branch, are not cleanly segregated from other ‘‘all-alpha’’ proteins. Few fold families are clustered at statistical significance, probably due to the overall low level of sequence similarity in this diverse set (approximately 30% identity over 40 residues on average). Clearly, patterns of hydropathy, reflecting the well-known idea that protein structure similarity is more conserved than sequence similarity [57,58], can be objectively recovered using pairwise HePCaT alignments in conjunction with the appropriate probability model described above.
Database search using human adenosine receptor A2a as query
Given the ability of HePCaT to match expected hydropathy patterns, an exploratory search was initiated to discover unknown matches. The hydropathy profile of the human adenosine A2a 7Tm G-protein coupled receptor (GPCR) was used to search the
human proteome for close unreported matches. As expected, hundreds of known 7Tm GPCRs were significantly matched by
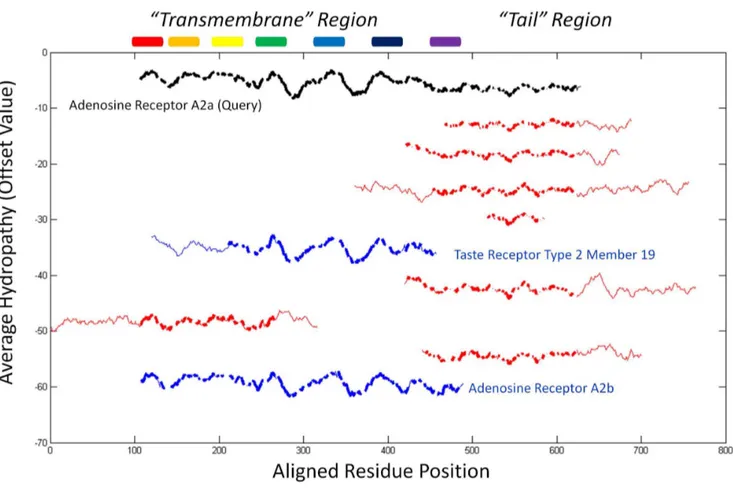
HePCaT (p,0.01, data not shown). The most significant ten matches are displayed in Figure 4. These hits fell into two categories: those that matched the transmembrane region [59] of A2a (Figure 4, blue) and those that mostly matched the tail region (Figure 4, red).
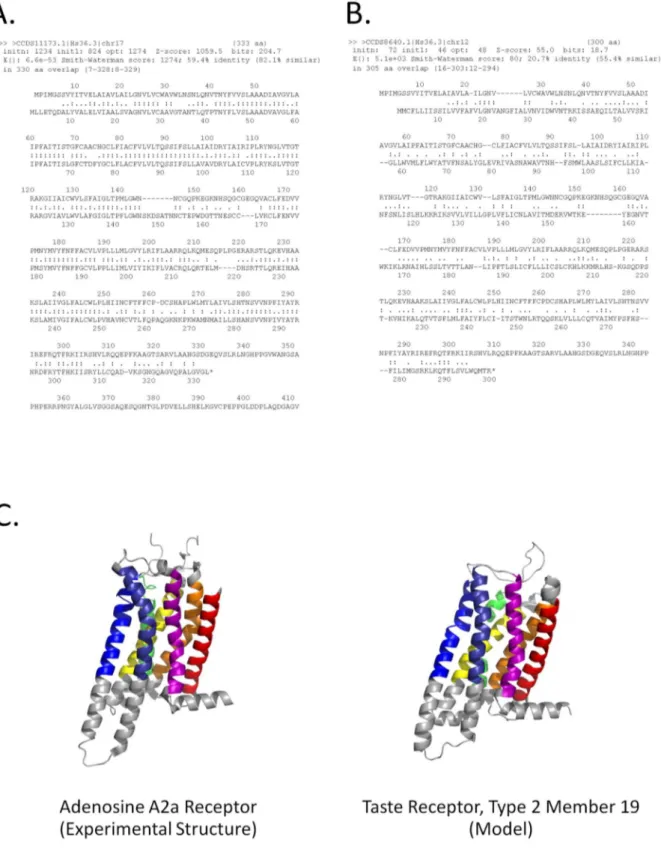
The longest match to the transmembrane region was the A2b isoform, which is also 59% sequence identical to A2a (Figure 5A). Unexpectedly, a Type 2 taste receptor also exhibited a significant match to this region (Figure 4). As this taste receptor has insignificant pairwise sequence identity to A2a (Figure 5B) and its structure has not been experimentally determined [60], this observed similarity was consistent with an independently produced model of the taste receptor, constructed using no HePCaT
information (Figure 5C). Additionally, the originalHePCaTmatch was demonstrated to be a useful template for a homology model [61] based on the A2a structure (data not shown). The validity of the hydropathy similarity between A2a and the taste receptor was further demonstrated to be robust with respect to the particular hydrophobicity scale used (Text S1; Figures S1 and S2 in Text S1). Figure 4. Most significant similarities in the human proteome to the Kyte-Doolittle hydropathy profile of adenosine receptor A2a. PairwiseHePCaTalignments are shown for A2a (black, gi|5921992) and the top nine most significant nonredundant hits in the human proteome. Blue color indicates known seven transmembrane spanning region proteins as annotated by theGPCRDBdatabase, red mostly indicates hits to the tail region of A2a. The hits are shown from top to bottom in order of most to least significant: hematological and neurological expressed protein-like 1 (gi|21700763,p= 4.061026), ephrin-A4 isoform a precursor (gi|4885197,p= 7.661025), NSFL1 cofactor p47 isoform a (gi|20149635,p= 9.161025), metallothionein-1E (gi|83367075,p= 9.761025), taste receptor type 2 member 19 (gi|28882035, p= 4.161024), B- and T-lymphocyte attenuator isoform 1 precursor (gi|145580621,p= 5.461024
), WD-repeat domain-containing protein 83 (gi|153791298,p= 6.561024
), dual specificity protein phosphatase 26 (gi|13128968,p= 7.761024), adenosine receptor A2b (gi|4501951,p= 8.361024). Thick lines indicate residue positions included in the optimalHePCaTalignment to A2a, and thin lines indicate unaligned positions. Rainbow colored cylinders from N- to C-terminus indicate the approximate sequence locations of the seven experimentally determined transmembrane spanning helices of A2a.
Figure 5. Pairwise sequence alignment does not detect significant similarity between human A2a and Taste Receptor Type 2, Member 19, yet a similar structure can be modeled based on theHePCaTmatch. A.FASTApairwise sequence alignment between human adenosine receptor A2a and its known homolog human adenosine receptor A2b.Alignment was extracted from a sequence search of the human proteome. Sequence similarity is 59% over 330 amino acids, with a highly significant E-value of 6.6e-53. Note that the hydropathy similarity between these two proteins is also significant, as given in Figure 4.B.FASTApairwise sequence alignment between human A2a and human taste receptor type 2, member 19.Sequence similarity is 21% over 305 amino acids. Although extensive, the similarity is not significant, with an E-value of 5.1e+3, in contrast to the significant hydropathy similarity displayed in Figure 4. This result suggests that
We attempted to rationalize the best matches to the A2a tail region in terms of sequence, structure, or function. However, in contrast to the transmembrane region matches, biological explanations for these remain unknown. The shortest hit to the tail region was possibly a statistical artifact: this metallothionein is naturally short and contains a high frequency of cysteine residues; such low-complexity sequences are normally filtered out of amino acid sequence searches [62], which was not done in the present study. Some of the proteins in this group are medically important, such as the hematological and neurological expressed-1 like protein, ephrin A4 isoforms, and the B and T-lymphocyte attenuator precursor. Structural information, where available about the matches, could not be confidently transferred to the putatively disordered tail region of A2a, which is thought to be involved in ligand specificity of the GPCR [63]. These tail matches may also result from the local scaling (Equation 3), which could potentially be disabled, illustrating the sensitivity vs. specificity tradeoffs inherent to relative shape matching.
Predicted remote similarity between the pore forming domain of bacterial colicin and Chlamydia
TC0624protein
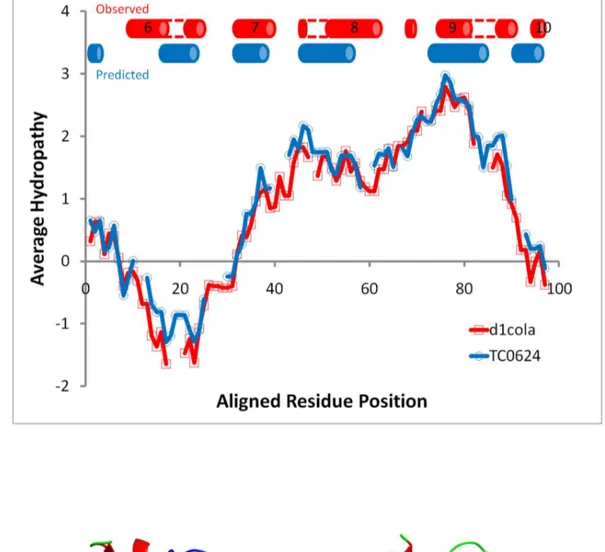
A third example of the utility ofHePCaTconcerns the possible discovery of remote similarity with medical importance. TheC. muridarumproteinTC0624, classified as an ‘‘ORFan’’ due to the absence of significant sequence similarity between any other known proteins [47], nonetheless exhibited a significant HePCaT
hydropathy match to the pore forming domain ofE. colicolicin A (Figure 6A). This match spanned the entire chain length of the ORFan protein and the experimentally-determined minimal length region of functional importance of the pore-forming domain [64]. The validity of the hydropathy similarity between colicin and TC0624 was further demonstrated to be robust with respect to the particular hydrophobicity scale used (Text S1; Figures S1 and S2 in Text S1).
Secondary structure prediction was consistent with the proposed tertiary structural similarity (Figure 6A), and sensitive sequence profile search using hidden Markov models revealed marginal (maximumHHPredP-Value 30% [50]), but repeated, similarity to the sequence of colicin implicated in the hydropathy match (Figure 6B). Thus, a total of four lines of evidence (hydropathy, secondary structure prediction, sensitive sequence similarity, and the regional correspondence between the sequence and structure matches) all converged on similarity betweenTC0624and the pore forming domain of colicin. Modeling [45] ofTC0624also resulted in a low-confidence fold prediction consistent with colicin (data not shown). However, these conclusions would have not been possible without the original statistical significance of the HePCaT
hydropathy match.
Importantly, the hydrophobic region of colicin implicated in this match has long been thought to be functionally crucial for colicin’s lethal ability to travel from a hydrophilic extracellular environ-ment, insert into the hydrophobic membrane interior, and form toxic pores in its host [65].TC0624has independently been placed [66] in a class unique toChlamydiaethat is observed by experiment to also similarly partition into the membrane interior of the chlamydial inclusion [67]. These so-called ‘‘Inc’’ proteins, difficult or impossible to predict using existing computational tools [66], are nonetheless important for chlamydial survival and maturation
within its human or animal hosts. It appears that the extreme hydrophobicity exhibited by theIncproteins [67] facilitates their computational prediction usingHePCaT.
Taken together, the results suggest a novel functional hypothesis for these medically important proteins: the Incs may form membrane-spanning pores that obtain nutrition from the host cytoplasm. This example also suggests that this particular ORFan may actually belong to a known protein family. Experiments are currently in progress to test these hypotheses.
Discussion
Most protein and nucleic acid data contained within the avalanche of next-generation genome sequencing can be expressed as sequentially numeric ‘‘peaks’’ and ‘‘valleys’’. These data include, but are not limited to, gene expression, ribosomal profiling,ChIPSeq,RNASeq, mRNA translation efficiency, thermo-dynamic stability of protein or mRNA, and physico-chemical properties such as hydropathy. A gap exists among software algorithms for analysis of such data, and theHePCaT algorithm described in this work is designed to help fill this gap. To facilitate such analysis and discovery, a webtool that allows execution of the algorithm, visualization of the result, and access to the raw and analyzed data is freely available at http://best.bio.jhu.edu/ HePCaT. (A detailed manuscript describing the use and capabilities of this web portal is in preparation.) Due to patent and license restrictions, information about access to source code is available through The Johns Hopkins University Office of Technology Transfer from the corresponding author.
There are at least three distinguishing features of theHePCaT
algorithm. First, the input is completely arbitrary: if the data can be expressed in numeric form regardless of its source, patterns can potentially be detected. Second, its scoring system is sensitive to both shape and magnitude similarity, allowing some degree of pairwise alignment flexibility. Third, theWparameter emphasizes a horizontal matching of patterns, as contrasted with the vertical matching that commonly occurs with amino acid substitution matrices or profile PSSMs.
In our view, vertical evolutionary conservation of amino acids has been thoroughly explored using tools such as BLAST
[4,5] and FASTA [42], while horizontal conservation of other protein properties has not. Thus, non-local properties of proteins, depending on correlations across residue positions, such as thermodynamic stability, can now be potentially explored with
HePCaT. The case studies presented in Figures 5 and 6 suggest that substantial horizontal similarity can be detected in one pass through a database, minimizing the need for longer iterative searches when the vertical similarity may be weak or statistically impossible to detect.
Importantly these anecdotal examples are not intended to demonstrate the superiority of the HePCaT algorithm, or the information contained in horizontal conservation, over current state-of-the-art methods for remote homology detection that are based on vertical conservation. To the contrary, HePCaT is intended as a complementary tool that would be most usefully applied to cases where vertical conservation is weak or absent.
Furthermore, although the tool formally returns a pairwise positional alignment, it is not clear if such an alignment, could or should be quantitatively compared to existing amino acid sequence alignment tools. TheHePCaTinput is subject to possible indicating the seven structurally aligned transmembrane spanning helices. The RMSD of the 269 DALI-aligned residues is 3.1 A˚ between modeled and experimental structures.
averaging over one window size (e.g.the hydropathy is averaged over 15 positions) and the output is matched using quantized blocks of a second multi-residue window size (e.g. 5 positions). Future work is necessary to determine whether HePCaT can substantially improve upon the accuracy of the best current pairwise alignment methods.
Rigorous evaluation of the statistical significance of a result is an essential piece of scientific data that is often neglected in bioinformatics tools. The significances returned byHePCaTallow prioritization of matches and aid expert interpretation. As with other tools, theHePCaTstatistical significances require calibration specific to the input data and algorithm parameters. Although recalibration for random simulation data not covered by Table 2 parameters is straightforward and has been achieved for other types of numerical data, an alternative estimate of statistical significance is available. Specifically, the non-parametric statistics of theMICscore reported by Reshef,et al.[68] could potentially be used to evaluate a match returned byHePCaT. In this way, the
significances of arbitrary pattern associations reported by Reshef,
et al.could be greatly leveraged by usingHePCaTas a ‘‘front-end’’ for other types of numerical data. Although this idea has not yet been thoroughly studied, we believe that the applicability of the
MICstatistics would be maximized with HePCaT parameters of
GapMax= 0 andW= 1.
Supporting Information
Text S1 Significant HePCaT matches are robust to
different hydrophobicity scales.
(DOC)
Author Contributions
Conceived and designed the experiments: OH JOW VJH. Performed the experiments: OH JOW. Analyzed the data: OH JOW. Contributed reagents/materials/analysis tools: OH JOW. Wrote the paper: OH JOW VJH.
References
1. Soeding J (2005) Protein homology detection by HMM-HMM comparison. Bioinformatics 21: 951–960.
2. Aravind L, Koonin EV (1999) Gleaning non-trivial structural, functional and evolutionary information about proteins by iterative database searches. J Mol Biol 287: 1023–1040.
3. Alva V, Remmert M, Biegert A, Lupas AN, Soding J (2010) A galaxy of folds. Protein Sci 19: 124–130.
4. Altschul SF, Gish W, Miller W, Myers EW, Lipman DJ (1990) Basic local alignment search tool. J Mol Biol 215: 403–410.
5. Altschul SF, Madden TF, Schaffer AA, Zhang J, Zhang Z, et al. (1997) Gapped BLAST and PSI-BLAST: a new generation of database search programs. Nucleic Acids Res 25: 3389–3402.
6. Kinch LN, Grishin NV (2002) Expanding the nitrogen regulatory protein superfamily: Homology detection at below random sequence identity. Proteins 48: 75–84.
7. Schlessinger A, Schaefer C, Vicedo E, Schmidberger M, Punta M, et al. (2011) Protein disorder - a breakthrough invention of evolution? Current Opinion in Structural Biology 21: 412–418.
8. Krishna SS, Grishin NV (2004) Structurally analogous proteins do exist! Structure 12: 1125–1127.
9. Sadreyev RI, Kim BH, Grishin NV (2009) Discrete-continuous duality of protein structure space. Curr Opin Struct Biol 19: 321–328.
10. Skolnick J, Arakaki AK, Lee SY, Brylinski M (2009) The continuity of protein structure space is an intrinsic property of proteins. Proc Natl Acad Sci U S A 106: 15690–15695.
11. Shindyalov IN, Bourne PE (2000) An alternative view of protein fold space. Proteins 38: 247–260.
12. Sander C, Schneider R (1991) Database of homology-derived protein structures and the structural meaning of sequence alignment. Proteins 9: 56–68. 13. Holm L, Sander C (1997) Dali/FSSP classification of protein folds. Nucleic
Acids Res 25: 231–234.
14. Tokuriki N, Tawfik DS (2009) Protein dynamism and evolvability. Science 324: 203–207.
15. Bryan PN, Orban J (2010) Proteins that switch folds. Curr Opin Struct Biol 20: 482–488.
16. Murzin AG (2008) Metamorphic Proteins. Science 320: 1725–1726. 17. Henzler-Wildman K, Kern D (2007) Dynamic personalities of proteins. Nature
450: 964–972.
18. Liberles DA, Teichmann SA, Bahar I, Bastolla U, Bloom J, et al. (2012) The interface of protein structure, protein biophysics, and molecular evolution. Protein Science 21: 769–785.
19. Gu J, Hilser VJ (2008) Predicting the energetics of conformational fluctuations in proteins from sequence: a strategy for profiling the proteome. Structure 16: 1627–1637.
20. dos Reis M, Savva R, Wernisch L (2004) Solving the riddle of codon usage preferences: a test for translational selection. Nucleic Acids Res 32: 5036–5044. 21. Tuller T, Carmi A, Vestsigian KN, S., Dorfan Y, Zaborske J, et al. (2010) An evolutionarily conserved mechanism for controlling the efficiency of protein translation. Cell 14: 344–354.
22. Spencer PS, Siller E, Anderson JF, Barral JM (2012) Silent substitutions predictably alter translation elongation rates and protein folding efficiencies. Journal of Molecular Biology 422: 328–335.
23. Bai Y, Milne JS, Mayne L, Englander SW (1994) Protein stability parameters measured by hydrogen exchange. Proteins 20: 4–14.
24. Liu T, Pantazatos D, Li S, Hamuro Y, Hilser VJ, et al. (2012) Quantitative assessment of protein structural models by comparison of H/D exchange MS data with exchange behavior accurately predicted by DXCOREX. Journal of the American Society for Mass Spectrometry 23: 43–56.
25. Bai Y, Milne JS, Mayne L, Englander SW (1993) Primary structure effects on peptide group hydrogen exchange. Proteins 17: 75–86.
26. Khafizov K, Staritzbichler R, Stamm M, Forrest LR (2010) A study of the evolution of inverted-topology repeats from Leu T-fold transporters using AlignMe. Biochemistry 49: 10702–10713.
27. Clements JD, Martin RE (2002) Identification of novel membrane proteins by searching for patterns in hydropathy profiles. European Journal of Biochemistry 269: 2101–2107.
28. Lolkema JS, Slotboom DJ (1998) Hydropathy profile alignment: a tool to search for structural homologues of membrane proteins. FEMS Microbiology Reviews 22: 305–322.
29. Hill JR, Kelm S, Shi J, Deane CM (2011) Environment specific substitution tables improve membrane protein alignment. Bioinformatics 27: 15–23. 30. Lolkema JS, Slotboom DJ (1998) Estimation of structural similarity of membrane
proteins by hydropathy profile alignment. Molecular Membrane Biology 15: 33–42.
31. Hollien J, Marqusee S (1999) Structural distribution of thermodynamic stability in a thermophilic enzyme. Proceedings of the National Academy of Sciences, USA 96: 13674–13678.
32. Holm L, Sander C (1993) Protein structure comparison by alignment of distance matrices. Journal of Molecular Biology 233: 123–138.
33. Shindyalov IN, Bourne PE (1998) Protein structure alignment by incremental combinatorial extension (CE) of the optimal path. Protein Eng 11: 739–747. 34. Jia Y, Dewey TG, Shindyalov IN, Bourne PE (2004) A new scoring function and
associated statistical significance for structure alignment by CE. J Comp Biol 11: 787–799.
35. Kyte J, Doolittle RF (1982) A simple method for displaying the hydropathic character of a protein. Journal of Molecular Biology 157: 105–132. 36. Robinson AB, Robinson LR (1991) Distribution of glutamine and asparagine
residues and their near neighbors in peptides and proteins. Proceedings of the National Academy of Sciences, USA 88: 8880–8884.
37. Johnson NL, Kotz S, Balakrishnan N (1994) Continuous Univariate Distribu-tions. New York, New York: John Wiley & Sons.
38. Press WH, Teukolsky SA, Vetterling WT, Flannery BP (1992) Numerical recipes in C: the art of scientific computing. New York: Cambridge University Press. 39. Andreeva A, Howorth D, Chandonia JM, Brenner SE, Hubbard TJ, et al. (2008)
Data growth and its impact on the SCOP database: new developments. Nucleic Acids Res 36: D419–425.
40. Chandonia JM, Hon G, Walker NS, Lo Conte L, Koehl P, et al. (2004) The ASTRAL compendium in 2004. Nucleic Acids Res 32: D189–D192. significantHHPred[50] hidden Markov model sequence match. Both matches independently link the sequence and hydrophobicity of the ORFan to the functionally important structural core region of colicin. The extensive structure, sequence, and chemical similarities suggest the medically important hypothesis thatTC0624could also be a pore-forming protein facilitating chlamydia survival.
41. Huang Y, Niu B, Gao Y, Fu L, Li W (2010) CD-HIT suite: a web server for clustering and comparing biological sequences. Bioinformatics 26: 680–682. 42. Pearson WR (2000) Flexible sequence similarity searching with the FASTA3
program package. Methods Mol Biol 132: 185–219.
43. Pruitt KD, Harrow J, Harte RA, Wallin C, Diekhans M, et al. (2009) The consensus coding sequence (CCDS) project: identifying a common protein-coding gene set for the human and mouse genomes. Genome Research 19: 1316–1323.
44. Vroling B, Sanders M, Baakman C, Borrmann A, Verhoeven S, et al. (2010) GPRCDB: information system for G-protein coupled receptors. Nucleic Acids Res 39: D309–D319.
45. Roy A, Kucukural A, Zhang Y (2010) I-TASSER: a unified platform for automated protein structure and function prediction. Nature Protocols 5: 725–738. 46. Holm L, Rosenstroem P (2010) Dali server: conservation mapping in 3D.
Nucleic Acids Research 38: W545–549.
47. Yomtovian I, Teerakulkittipong N, Lee B, Moult J, Unger R (2010) Composiiton bias and the origin of ORFan genes. Bioinformatics 26: 996–999.
48. Buchan DW, Ward SM, Lobley AE, Nugent TC, Bryson K, et al. (2010) Protein annotation and modeling servers at University College London. Nucleic Acids Research 38: W563–W568.
49. Jones DT (1999) Protein secondary structure prediction based on position-specific scoring matrices. Journal of Molecular Biology 292: 195–202. 50. Soeding J, Biegert A, Lupas AN (2005) The HHpred interactive server for
protein homology detection and structure prediction. Nucleic Acids Res 33: W244–W248.
51. Vinothkumar KR, Henderson R (2010) Structures of membrane proteins. Quarterly Reviews of Biophysics 43: 65–158.
52. Neumann S, Fuchs A, Miulkidjanian A, Frishman D (2010) Current status of membrane protein structure classification. Proteins: Structure, Function, and Bioinformatics 78: 1760–1773.
53. Krogh A, Larsson B, von Heijne G, Sonnhammer ELL (2001) Predicting transmembrane protein topology with a hidden Markov model: application to complete genomes. Journal of Molecular Biology 305: 587–590.
54. Kali L, Krogh A, Sonnhammer ELL (2007) Advantages of combined transmembrane topology and signal peptide prediction: the Phobius web server. Nucleic Acids Research 35: W429–W432.
55. Engelman DM, Steitz TA, Goldman A (1986) Identifying nonpolar transbilayer helices in amino acid sequences of membrane proteins. Annual Reviews of Biophysics and Biophysical Chemistry 15: 321–353.
56. Murzin AG, Brenner SE, Hubbard T, Chothia C (1995) SCOP: a structural classification of proteins database for the investigation of sequences and structures. J Mol Biol 247: 536–540.
57. Chothia C, Lesk AM (1986) The relation between the divergence of sequence and structure in proteins. EMBO Journal 5: 823–826.
58. Wong WC, Maurer-Stroh S, Eisenhaber F (2010) More than 1001 problems with protein domain databases: transmembrane regions, signal peptides, and the issue of sequence homology. PLOS Computational Biology 6: e1000867. 59. Topiol S, Sabio M (2009) X-ray structure breakthroughs in the GPCR
transmembrane region. Biochemical Pharmacology 78: 11–20.
60. Tebben AJ, Schnur DM (2011) Beyond rhodopsin: G protein-coupled receptor structure and modeling incorporating the beta2-adrenergic and adenosine A2A crystal structures. Chmoinformatics and computational chemical biology: methods in molecular biology 672: 359–386.
61. Eswar N, Marti-Renom MA, Webb B, Madhusudhan MS, Eramian D, et al. (2006) Comparative Protein Structure Modeling With MODELLER.: John WIley & Sons, Inc.
62. Wootten JC, Federhen S (1993) Statistics of local complexity in amino acid sequences and sequence databases. Computational Chemistry 17: 149–163. 63. Lebon G, Warne T, Edwards PC, Bennett K, Langmead CJ, et al. (2011)
Agonist-bound adenosine A(2A) receptor structures reveal common features of GPCR activation. Nature 474: 521–525.
64. Cascales E, Buchanan SK, Duche D, Kleanthous C, Lloubes R, et al. (2007) Colicin biology. Microiology and molecular biology reviews 71: 158–229. 65. Cramer WA, Heymann JB, Schendel SL, Deriy BN, Cohen FS, et al. (1995)
Structure-function of the channel-forming colicins. Annual Reviews of Biophysics and Biomolecular Structure 24: 611–641.
66. Lutter EI, Martens C, Hackstadt T (2012) Evolution and conservation of predicted inclusion membrane proteins in chlamydiae. Comparative and Functional Genomics 362104: 1–13.
67. Bannantine JP, Griffiths RS, Viratyosin W, Brown WJ, D.D R (2000) A secondary structure motif predictive of protein localization to the chlamydial inclusion membrane. Cellular Microbiology 2: 35–47.
68. Reshef DN, Reshef YA, Fuinucane HK, Grossman SR, McVean G, et al. (2011) Detecting novel associations in large data sets. Science 334: 1518–1524. 69. Kabsch W, Sander C (1983) Dictionary of protein secondary structure: pattern