Prediction of mechanical properties
of Al alloys with change of cooling
rate
Male, born in 1964, Ph. D, Professor. His research interests mainly focus on the numerical simulation of mold illing and solidiication, and optimal gating system design. The irst author Quan-Zhi Dong is one of the master candidates supervised by him.
E-mail: [email protected]
Received: 2012-08-10; Accepted: 2012-09-10 *Ho-Young Hwang
Quan-Zhi Dong 1
, Young-Sim Choi 2
, Jun-Ho Hong 2
and *Ho-Young Hwang 2
(1. Dept. of Virtual Engineering, University of Science and Technology, Incheon 406-840, Korea; 2. e-Design Center, Korea Institute
of Industrial Technology, Incheon 406-840, Korea)
N
owadays, lightweight metals such as aluminum alloys and magnesium alloys are used to reduce the weight of cars, and many other heavy metal products. There has been a lot of research regarding the new alloy development and new casting process development in order to improve the mechanical properties, castability, and casting quality. Meanwhile, a lot of research on the mechanical properties and the behavior of aluminum alloys have been conducted. If the casting conditions or the casting design changes, the existing experimental data is not available; and a new evaluation of the mechanical properties must be made through new experiments. Therefore, further research is needed to accurately predict whether casting defects will occur and how the mechanical properties are changed after casting; and to determine appropriate casting conditions and casting processes for casting products of a variety of sizes and shapes.Many researchers have conducted a large amount of studies
to explain the solidiication phenomenon by making physical
Abstract: The solidiication process signiicantly affects the mechanical properties and there are lots of factors
that affect the solidiication process. Much progress has been made in the research on the effect of solidiication on mechanical properties. Among them, the PF (Phase Field) model and CA (Cellular Automata) model are widely used as simulation methods which can predict nucleation and its growth, and the size and morphology of the grains during solidiication. Although they can give accurate calculation results, it needs too much computational memory and calculation time. So it is dificult to apply the simulation to the real production process.
In this study, a more practical simulation approach which can predict the mechanical properties of real aluminum alloys is proposed, by identifying through experiment the relationship between cooling rate and SDAS (Secondary Dendrite Arm Spacing) and mechanical properties. The experimentally measured values and the values predicted by simulation have relatively small differences and the mechanical properties of a variety of Al alloys are expected to be predicted before casting through use of the simulation.
Key words: mechanical properties; dendrite structure; aluminum alloy; cooling rate; solidiication; casting simulation
CLC numbers: TP391.9/TG146.21 Document code: A Article ID: 1672-6421(2012)04-381-06
and mathematical models. Among them, the PF (Phase Field) model and the CA (Cellular Automata) model are widely used as simulation methods which can predict nucleation and its growth, and the size and morphology of the grains during solidification [1]. Although they can give accurate calculation results, it needs too much computational memory and calculation time; so it has been difficult to apply to the real production process. Therefore, in order to save cost and shorten the product development period, it is necessary to study the prediction of the mechanical properties of castings according to how the casting conditions change by building a database through experimental evaluation.
In this study, we are trying to predict the changes in the mechanical properties with the change of cooling rate of
the alloy through simulation in order to make prediction of
the mechanical properties of the products more practical. In the case of aluminum alloys, the mechanical properties are generally influenced by grain size, inner defects (porosity,
inclusion, and micro-shrinkage), SDAS (Secondary Dendrite Arm Spacing), the shape and distribution of primary crystal
and eutectic structure, and the cooling rate. Among these
factors, SDAS has a great effect on the mechanical properties. The size of SDAS per unit length is inluenced by the cooling
rate, pouring temperature, impurities in the molten metal, roughness of the mold surface, and mold materials. But it is
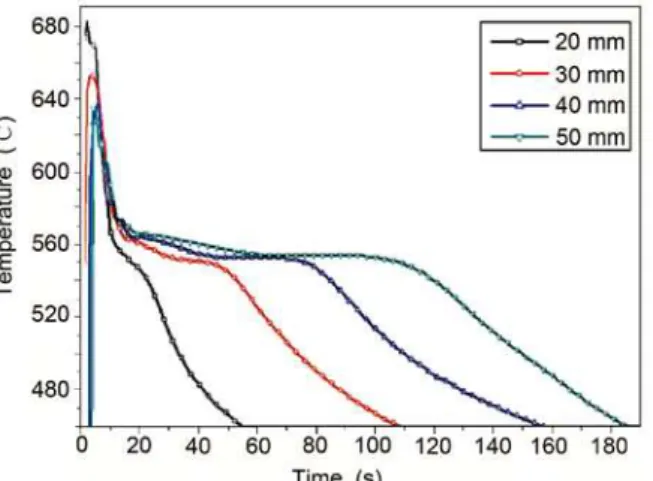
Fig. 2: Cooling curves at different parts of casting for A4032 alloy
Fig. 3: Cooling curves at different parts of casting for A2 alloy
In the present research, casting experiments were conducted
with the Al alloys, A4032 and A2. The SDAS was measured
by observing the grain structure of the alloy, and the exponents (n) of the empirical equation linking SDAS and cooling rate
(CR) were determined.
SDAS = k(CR)n
(1) Finally the mechanical properties (tensile strength, hardness, and elongation) of the cast samples from the casting
experiments were measured and curves were itted to SDAS and cooling rate from the solidiication simulation to obtain the inal
relational expression to provide general data base for the alloy. And then the relationship between mechanical properties and
SDAS by curve itting was determined. By using this procedure,
the prediction of the mechanical properties of Al alloys became possible through simulation of the casting process.
2 Experiments and derived correlation
equations
2.1 Casting experiments
To ind out how the change of mechanical properties depends on cooling rate, a stepped Y-Block permanent mold, as shown
in Fig. 1(a), was made. The thinnest part of the casting was 20
mm and the thickest part was 50 mm. A riser was placed on the top of the thickest part for feeding during solidiication.
To keep the initial temperature of the mold uniform, the
mold was heated in a heat treatment furnace at 200 ℃ for 4 h. After heating, thermo-couples were installed for temperature measurement at the points shown in Fig. 1(b). After that, A4032 or A2 alloy was melted and poured into the mold at 700 ℃ after degassing for 5 min [2]
. To obtain the cooling rate, the
temperature of the center point of each thickness was stored in
the computer every second.
difference of thickness. From the solidiication time-temperature
curve, the cooling rate can be calculated by ΔT/Δt (where, ΔT
is the temperature difference and Δt is the time difference),
but the deinitions and methods vary in the literature [3]. In
this research, the solidification time (tf) from the liquidus
temperature (TL) to the solidus temperature (TS) was used. In other words, the cooling rate of each thickness of the two Al alloys was calculated by using CR = (TL - TS) / tf.
(a) (b)
Fig. 1: Dimensions of mold for casting experiments
A specimen of 20 mm × 20 mm × 20 mm size was taken
from near the thermocouple and grain structure was observed
for measuring SDAS. Figure 4 is the grain structure of the area that is near to the middle of each thickness of the two kinds of
Al alloys [4].
In order to derive the correlation equations between the
cooling rate and SDAS, and between mechanical properties and SDAS; the SDAS was first measured by counting the
number of grain boundaries in a unit length (100 µm). Then
hardness and tensile strength tests on the KS 14A specimen (Fig. 5) made from the casting experiment were conducted.
Tables 1 and 2 show the cooling rate and the SDAS of each thickness of A4032 and A2 alloys.
Tables 3 and 4 show the mechanical properties of each
thickness of A4032 and A2 alloys. Figures 2 and 3 are the solidiication time-temperature graphs
Fig. 4: Grain structures of the two alloys
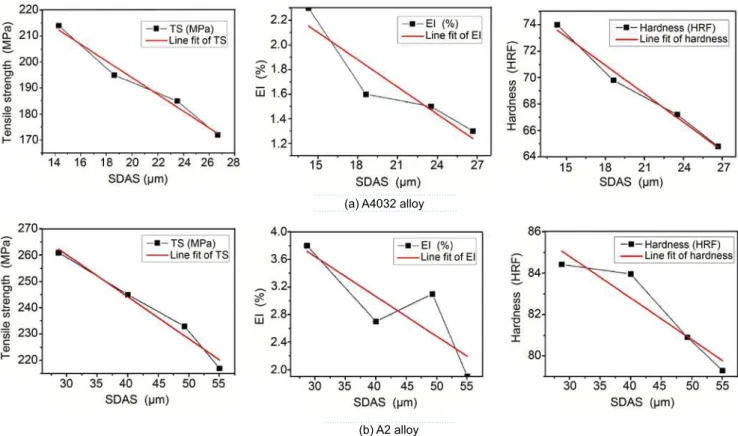
When we draw graphs using the above data, the relationship
between SDAS and cooling rate shows an exponentially decreasing curve; and the relationships between SDAS and the
mechanical properties tend to decrease linearly. Therefore, the
relationship between SDAS and the cooling rate can be curve itted using the expression y = axb and the relationship between
SDAS and mechanical properties can be curve fitted using
the expression y = ax + b. The coeficients of the correlation
equations can be calculated from the fitted curves. Figure 6
shows the relationship between the cooling rate and SDAS;
and Figure 7 shows the relationship between the mechanical
properties and SDAS.
(a) A4032 alloy
(b) A2 alloy
Fig. 5: KS 14A tensile strength test specimen
Fig. 6: Relationship graphs between cooling rate and SDAS Table 1: Cooling rate and SDAS of A4032 alloy
Table 2: Cooling rate and SDAS of A2 alloy
Table 3: Mechanical properties of A4032 alloy
Table 4: Mechanical properties of A2 alloy
Thickness Cooling rate (˚C·s-1) SDAS (µm)
20 mm 2.43 14.28
30 mm 0.88 18.60
40 mm 0.52 23.52
50 mm 0.35 26.67
Thickness Cooling rate (˚C·s-1) SDAS (µm)
20 mm 3.20 28.70
30 mm 1.32 40.00
40 mm 0.83 49.28
50 mm 0.61 55.05
Thickness TS (MPa) El (%) HN (HRF) 20 mm 214 2.3 74.0 30 mm 195 1.6 69.8 40 mm 185 1.5 67.2 50 mm 172 1.3 64.8
Thickness TS (MPa) El (%) HN (HRF) 20 mm 261 3.8 73.74 30 mm 245 2.7 70.14 40 mm 233 3.1 67.49 50 mm 217 1.9 65.74
(a) A4032 alloy
(b) A2 alloy
Fig. 7: Relationship graphs between mechanical properties and SDAS
Fig. 8: Temperature distribution after mold illing
A2:
After curve fitting, the coefficients of the relationship expressions were obtained and the correlation equations for predicting the mechanical properties of the two Al alloys are shown below.
A4032:
3 Simulation and prediction of
mechanical properties
3.1 Flow and solidiication simulation
At first, the flow analysis was carried out under the same conditions as with the casting experiment. The pouring velocity was 1.0 m·s-1 and pouring time was about 4 s. Solidification analysis was carried out using the temperature distribution after
the completion of mold illing [5]. The temperature distribution after mold illing is shown in Fig. 8.
Proceeding with the solidification analysis using the
temperature ield of mold illing, thermocouples were installed
in the same positions as with the casting experiment for storing temperature change during solidification. Figure 9
shows the comparison between the temperature change with (a) A4032 alloy
SDAS = 18.63 (CR) -0.337
TS [MPa] = -3.212 SDAS + 258.21 EL[%] = -0.074 SDAS + 3.21 HN [HRF] = -0.717 SDAS + 83.83
SDAS = 45.3 (CR) -0.398
Fig. 9: Comparison of cooling curves produced by experiment and simulation
Fig. 10: Comparison of mechanical properties produced by simulation and experiment
time of experiment and the simulation at the same position
during solidiication. The (S) in Fig. 9 means simulation and (E)
means experiment.
3.2 Prediction of mechanical properties
The cooling rate can be obtained from the temperature data obtained from the solidification analysis. The mechanical properties can be predicted by substituting the cooling rate obtained from the simulation into the above correlation equations. The mechanical properties obtained are shown in
Tables 5 and 6.
Table 5: Predicted mechanical properties of A4032 alloy
Table 6: Predicted mechanical properties of A2 alloy
Thickness TS (MPa) El (%) HN (HRF) 20 mm 212.97 2.17 73.74 30 mm 196.84 1.80 70.14 40 mm 184.97 1.52 67.49 50 mm 177.13 1.34 65.74
Thickness TS (MPa) El (%) HN (HRF)
20 mm 250.59 3.29 83.60 30 mm 234.60 2.71 81.58 40 mm 221.94 2.25 79.99 50 mm 212.81 1.92 78.83
(b) A2 alloy
Figure 10 shows bar graphs that compare the mechanical properties measured from the experiment and calculated from the simulation. The smallest difference between experiment and simulation in tensile strength was 0.01% and the maximum
difference was 4.98%. The smallest difference in elongation
was 0.37% and the maximum difference was 37.77% that may
have appeared due to the micro-shrinkages and cavities in the
specimen and a temperature difference between experiment and simulation [6, 7]
. The smallest difference in hardness was
0.35% and the maximum difference was 2.91%. If we do
more experiments for the same material at various cooling conditions, it is expected to be more accurate to predict the mechanical properties by casting simulation. Further research about the effect of the heat treatment on the changes in the mechanical properties is also needed.
4 Conclusions
Stepped mold casting experiment and simulation about
Al A4032 and A2 alloys were carried out. The following conclusions were obtained.
(1) The relationships between the cooling rate and SDAS and between the mechanical properties and SDAS are
obtained from changes in the cooling rate, grain structure, and mechanical properties occurring due to the difference in
thickness of casting during solidiication.
(2) The bar graphs comparison shows the mechanical properties measured from the experiment and calculated from
the simulation with an difference of 0.01% to 4.98% in the tensile strength, 0.37% to 37.77% in the elongation and 0.35%
to 2.91% in the hardness.
(3) It will be possible to predict the mechanical properties through simulation before real casting by building correlation equations to forecast the mechanical properties with the cooling rate through experiment on a variety of casting alloys in the same way as in the present study.
References
[1] Kwon H J. Prediction of Mechanical Properties and Microstructure of Hypo-eutectic Al-Si Alloy using Cellular Automata; Based on experimental database. Master’s thesis, Yonsei University, Korea, 2003. (in Korean)
[2] Lee W S and Ye B J. Variation of Fluidity in Al Alloys with the Addition of Si, Mg and Melt Treatments. Journal of the Korea Foundry Society, 1999, 19(4): 310-317. (in Korean).
[3] Cheon B W. The Effect of Metallic Mold Cooling System on the Solidiication Structures and the Mechanical Properties for Al Alloy Castings. Master’s thesis, Dong-A University, Korea, 1995. (in Korean)
[4] Kim J K, Kim KY, and Park H W. Metallurgical microscope histology. Gold Publishing House, Korea, 1999: 369-387.(in Korean).
[5] Yoo S M, Lee D H, Kim J K, et al. Three Dimensional Solidification Analysis in Large Steel Castings by Modified Finite Difference Method. Journal of the Korea Foundry Society, 1991, 11(1): 54-62. (in Korean)
[6] Lee M S, Kim K Y, and Kim S W. Effect of Tilting Speed and Angle on Gas Entrapment in Gravity Diecasting. Journal of the Korea Foundry Society, 1994, 14(4): 353-362. (in Korean) [7] Han Y S. Defect Types of High Pressure Casting and the
Inluence on the Mechanical Properties. Journal of the Korea Foundry Society, 2002, 22(5): 223-230. (in Korean)