Local versus Generalized Phenotypes in Two
Sympatric
Aurelia
Species: Understanding
Jellyfish Ecology Using Genetics and
Morphometrics
Luciano M. Chiaverano1*, Keith W. Bayha2, William M. Graham1
1Department of Marine Science, University of Southern Mississippi, Stennis Space Center, Mississippi,
United States of America,2American Association for the Advancement of Science, Washington, DC, United
States of America
Abstract
For individuals living in environmentally heterogeneous environments, a key component for adaptation and persistence is the extent of phenotypic differentiation in response to local environmental conditions. In order to determine the extent of environmentally induced mor-phological variation in a natural population distributed along environmental gradients, it is necessary to account for potential genetic differences contributing to morphological differ-entiation. In this study, we set out to quantify geographic morphological variation in the moon jellyfishAureliaexposed at the extremes of a latitudinal environmental gradient in the
Gulf of Mexico (GoM). We used morphological data based on 28 characters, and genetic data taken from mitochondrial cytochrome oxidase I (COI) and nuclear internal transcribed
spacer 1 (ITS-1). Molecular analyses revealed the presence of two genetically distinct
spe-cies ofAureliaco-occurring in the GoM:Aureliasp. 9 andAureliac.f. sp. 2, named for its
divergence from (for COI) and similarity to (forITS-1)Aureliasp. 2 (Brazil). Neither species
exhibited significant population genetic structure between the Northern and the Southeast-ern Gulf of Mexico; however, they differed greatly in the degree of geographic morphological variation. The morphology ofAureliasp. 9 exhibited ecophenotypic plasticity and varied
sig-nificantly between locations, while morphology ofAureliac.f. sp. 2 was geographically
invariant (i.e., canalized). The plastic, generalist medusae ofAureliasp. 9 are likely able to
produce environmentally-induced,“optimal”phenotypes that confer high relative fitness in different environments. In contrast, the non-plastic generalist individuals ofAureliac.f. sp. 2
likely produce environmentally-independent phenotypes that provide the highest fitness across environments. These findings suggest the twoAurelialineages co-occurring in the
GoM were likely exposed to different past environmental conditions (i.e., different selective pressures) and evolved different strategies to cope with environmental variation. This study highlights the importance of using genetics and morphometric data to understand jellyfish ecology, evolution and systematics.
a11111
OPEN ACCESS
Citation:Chiaverano LM, Bayha KW, Graham WM (2016) Local versus Generalized Phenotypes in Two SympatricAureliaSpecies: Understanding Jellyfish Ecology Using Genetics and Morphometrics. PLoS ONE 11(6): e0156588. doi:10.1371/journal. pone.0156588
Editor:Donald James Colgan, Australian Museum, AUSTRALIA
Received:November 13, 2015
Accepted:May 17, 2016
Published:June 22, 2016
Copyright:This is an open access article, free of all copyright, and may be freely reproduced, distributed, transmitted, modified, built upon, or otherwise used by anyone for any lawful purpose. The work is made available under theCreative Commons CC0public domain dedication.
Data Availability Statement:All relevant data are within the paper and its Supporting Information files.
Funding:This research was funded by the Mississippi-Alabama Sea Grant Consortium (R/CEH-1) and the National Science Foundation (OCE-9733441) to WMG. The funders had no role in study design, data collection and analysis, decision to publish, or preparation of the manuscript.
Introduction
The degree of phenotypic differentiation in response to local environmental conditions is a crucial component to species adaptation and persistence [1,2]. Individuals in populations dis-tributed along environmental gradients often display local phenotypes as a result of genetic adaptation and/or phenotypic plasticity [3–5], the capacity of a genotype to display a range of phenotypes in response to environmental variation [6]. Without the homogenizing effects of gene flow between selecting environments, natural selection can favor the evolution of locally adapted, genetically distinct ecotypes [7,8]. On the other hand, unrestricted gene flow can over-come phenotypic divergence via natural selection and favor the evolution of phenotypic plas-ticity [4,9]. Moreover, even when gene flow is high, depending on costs and limits of
phenotype and plasticity [10], a geographically unstructured (i.e., environmentally canalized), generalist phenotype may evolve and be expressed throughout a species’range [11,12].
Strategies leading to the expression of local or generalist phenotypes have been studied in several terrestrial and aquatic species [4,8,12,13], but remain unstudied in many marine plank-tonic groups, such as the socio-economically and ecologically important jellyfishes (i.e., medu-sae and ctenophores). These gelatinous animals are receiving special attention due to the capacity of a few species to suddenly increase their population size, often resulting in mass occurrences[14]. When abundant, jellyfish can considerably impact food web dynamics [15– 18] and negatively affect fisheries [19–21], power and desalination plants [22,23], and tourism [24].Recent studies have linked mass occurrences of jellyfish with climatic fluctuations[25,26], overfishing, pollution, and the translocation of species [17,27]; however, the mechanisms behind mass occurrences remain poorly understood in part due to the insufficient knowledge on the ecological strategies jellyfish have evolved to cope with environmental variation [28,29].
One key step towards a better understanding of ecological strategies in jellyfish is to assess environmentally-induced effects on the phenotype of medusae in natural settings, since the phenotype is directly linked to an organism’s performance (e.g., feeding capacity, swimming ability, reproductive output) and fitness [30]. However, the extent of intraspecific, environmen-tally-induced phenotypic variation in jellyfish is difficult to assess mainly due to taxonomic uncertainties within this group, since most traditionally morphological features are not diag-nostic at the species level [31]. Recently, the use of molecular genetics combined with explicit, quantitative, and objective morphological analyses has helped to solve prior taxonomic issues with jellyfish and uncovered cryptic speciation [31–33],as well as phenotypic variation within species [31,34,35]. Nonetheless, the extent of intraspecific phenotypic variation in jellyfish within an ecological context remains almost unexplored.
intraspecific morphological variation between locations to specifically test for the presence of 1) a geographically invariant, generalist phenotype or 2) a geographically structured, local phenotype.
Materials and Methods
Medusae collection
Aureliaspp. medusae (Fig 1) were studied in the Central Northern (CNGoM: Dauphin Island, 30°09’28.6”N; 88°08’22”W) and in the Southeastern Gulf of Mexico (SEGoM: Long Key, 24° 46’51”N; 80°41’12”W;Fig 2).
Individuals were sampled in the CNGoM in September and October 2003 (n = 63) and 2005 (n = 40), and in the SEGoM during September 2006 (n = 41). Medusae were collected from the surface using a dip net, placed in plastic containers with unfiltered seawater, and then trans-ported to the laboratory. This research did not require collection permits.
Fig 1.Aureliamedusae from the Gulf of Mexico (GoM).The specimen on the left represents a medusa of
Aureliasp. 9, while the specimen on the right represents a medusa ofAureliac.f. sp. 2.Aurelialineages in the
GoM were determined by molecular analysis of mitochondrial (COI) and nuclear (ITS-1) DNA. These two particular specimens were collected in Long Key (FL) on September 28, 2006.
doi:10.1371/journal.pone.0156588.g001
Fig 2. MODIS-Aqua image of sea surface temperature in the Gulf of Mexico during Fall.Sampling sites
are represented by asterisks. Dauphin Island, AL (white asterisk) represents the Central Northern GoM, while Long Key, FL (black asterisk) represents the Southeastern GoM. This image is 10-day composite of sea surface temperature (4 km resolution. Level 2) from October 20 to October 30 2003. Isothermal lines were obtained using the“m_countour”function in MatLab. Image was obtained from the Ocean Color data website
(http://oceandata.sci.gsfc.nasa.gov) and can be accessed athttp://doi.org/10.5067/AQUA/MODIS_OC.2014. 0.
Molecular data collection
DNA was extracted from gonad tissue using a modified CTAB method that allows for multiple rounds of concentrated CTAB addition [41]. Mitochondrial cytochrome c oxidase I (COI) and nuclear internal transcribed spacer region 1 (ITS-1) were used to determine species-level varia-tion in this study [42–44]. Polymerase chain reaction (PCR) was used to amplifyCOIusing the primers LCOjf (GGTCAACAAATCATAAAGATATTGGAAC) [44] and HCO2198 (TAAAC TTCAGGGTGACCAAAAAATCA) [45] andITS-1region (including some flanking regions of
18Sand5.8S) was amplified using primers KMBN-8 (ATTACGTCCCTGCCCTTTGTA) and KMBN-84 (TTGCGTTCAAAGATTCGATGA) [46]. Reaction conditions forCOIconsisted of one cycle of 94°C for 180 seconds (s), then 38 cycles of 94°C for 45 s, 49°C for 60 s and 72°C for 75 s, followed by a final step of 72°C for 600 s and storage at 4°C. Reaction conditions forITS-1
consisted of one cycle of 94°C for 180 s, then 38 cycles of 94°C for 45 s, 50°C for 60 s and 72°C for 90 s, followed by a final step of 72°C for 600 s and storage at 4°C. PCR success was evaluat-ing by runnevaluat-ing amplicons out on a 1.5% agarose gel. COIamplicons were directly DNA-sequenced in both directions using the PCR primers, whileITS-1amplicons were first cloned using the TOPO TA Cloning Kit for Sequencing (Invitrogen, Inc.) and then bi-directionally sequenced using primers T3 (ATTAACCCTCACTAAAGGGA) AND T7 (TAATACGACTC ACTATAGGG). Sequences were assembled using Sequencher v.5.4 (Gene Codes Corp.) and then compared to the NCBI Genbank database using BLASTx (COI), which translates the pro-tein coding region and helps identify any coding issues, or BLASTn (ITS1). All published sequences are available in NCBI GenBank under accession numbers KU984335-KU984424.
Molecular data analysis
MitochondrialCOIsequences were aligned using ClustalX v2.0 [47] and translated into amino acid to assess any coding issues. NuclearITS-1DNA sequences were aligned using MAFFT v. 7.0 employing the E-INS-I strategy [48], since it has been demonstrated to be effective for loci containing conserved regions within hypervariable regions [49]. To compare genetic diver-gences amongAurelialineages in this study to those among animals from other studies,COI
sequences were obtained from NCBI Genbank (S1 Table) and included in theCOIdataset. ITS-1was included in this study for two reasons: to further compare genetic divergences among lin-eages to those among otherAureliaspecies and to look for any evidence of hybridization between GOMAurelialineages. However, initial alignments indicated thatITS-1regions for
Aureliasp. 2,Aureliac.f. sp. 2 andAureliasp. 9 are distantly related to most published sequences (e.g. [42] [50]) resulting in a preponderance of poorly aligned hypervariable regions and an unreliable alignment for examining divergence among closely related species. In order to be as conservative as possible, theITS-1data set for this study only included published sequences from the closely related speciesAureliasp. 9 (Gulf of Mexico) andAureliasp. 2 (Bra-zil) [42]. ForITS-1, hypervariable regions of questionable alignment were removed from the MAFFT alignment using GBlocks v. 0.91b [51] under default parameters, except that allowed gap positions were set to half.
(GTR+I+G, with the gamma distribution approximated by four discrete categories) of nucleo-tide evolution was assumed for all analyses because it is not possible to implement the slightly less complicated models used in the ML tree searches using the COI (TRN+I+G) and ITS-1 (K80+G) data sets. For each dataset, two independent MCMC runs were conducted until the standard deviation of split frequencies decreased to less than 0.01: 2,000,000 sampling every 1,000, for the COI and ITS-1 data sets. The number of generations was determined by assess-ment of convergence using the Minimum Estimated Sample Size and Potential Scale Reduction Factor, as implemented in Mr. Bayes. Posterior probabilities were calculated using all trees other than the first 25%, which were discarded as“burnin”. TheCOIphylogenetic tree was rooted using aCOIsequence fromPhacellophora camtschatica(GQ120097), the jellyfish spe-cies most closely related to the genusAurelia[55]. TheITS-1tree was midpoint-rooted, since the addition of distantly relatedAureliaspecies introduced poorly aligned hypervariable regions, altering in-group divergences, but large-scale relationships were generally unchanged for midpoint rooted and outgroup rooted trees (not shown). All trees were constructed using Figtree v. 1.3.1 [56] and redrawn in Adobe Illustrator CS6.
Minimum inter-clade and mean intra-clade sequence divergence values and nucleotide sta-tistics were determined using MEGA v4.0 [57] and Seaview v4.6 [58]. To assess potential genetic population structure, Analysis of Molecular Variance (AMOVA) was performed in Arlequin v.3.5.1.3[59] usingCOIsequences. A statistical parsimony haplotype network was cal-culated in TCS v. 1.21 [60] using the 95 per cent connection limit criterion.
Morphological data collection
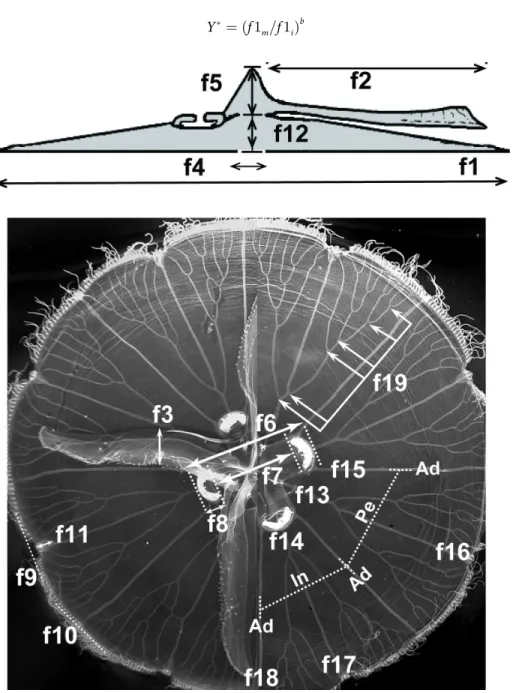
A total of 28 morphological features was recorded for eachAureliamedusa (S2 Table). The term“morphological feature”used here refers to continuous, meristic and categorical (nominal and ordinal scales) traits previously used in morphological studies ofAurelia[31,61]. Features were measured and recorded based on methods described by Dawson [31], with a few modifi-cations. Each medusa was placed with its exumbrella facing downward on a flat, transparent surface illuminated from below and digitally photographed against a 24-color Kodak reference chart and a ruler. In order to minimize handling time of individuals, only three features were recordedin situfrom live animals. We first recorded bell diameter and then total height (bell height + manubrium length) by inserting a calibrated probe through the mouth. Oral arms and manubrium were excised and the calibrated probe was reinserted to measure bell height at the center of the bell (Fig 3). Bell height was then subtracted from total height to estimate manu-brium length. The rest of the morphological features (S2 Table,Fig 3) were recorded from digi-tal photographs using the software ImagePro Plus1v.4.5 (Media Cybernetics, Inc 1993–
Morphological data analysis
Bell diameter. Differences in bell diameter versus age (number of branching points) between locations (CNGoM and SEGoM), and between years (2003 and 2005) within the CNGoM, were tested by ANOVA, and Tukey’s tests were performed for multiple comparisons.
Size correction approach. Since morphological features can depend on the size of the individual rather than species or population level characteristics within a particular location [31,63], all continuous, meristic, and ordinal categorical features were size-adjusted before any analysis using the method of Lleonart [64]. This procedure scales all individuals to the same size (i.e., bell diameter) and adjusts each morphological feature taking into account potential allometric differences among species or within species in different habitats using the formula:
Y¼ ðf
1m=f1iÞ b
ðEq 1Þ
Fig 3. Continuous and meristic morphological features recorded in this study.Cross-sectional (A) and sub-umbrellar (B) views of anAureliamedusa. Categorical features are not shown. Refer toS2 Tablefor
feature descriptions.
whereYis the size-corrected morphological feature in the individual i,Yiis the measured morphological feature in individual i,f1iis the bell diameter of the individuali,f1mis the mean (arithmetic) bell diameter of all individuals in the dataset, andbis the location, within-lineage, slope of the regression betweenlog10(f1i)andlog10(Yi). Correlations were used to determine whether significant relationships existed between bell diameter and size-corrected continuous (Pearson correlations) and ordinal categorical (Spearman correlations) features using the software Statistica v.6 (Statsoft, Inc.). Nominal categorical features exhibiting a signif-icant correlation with size were not included in subsequent analyses.
Multivariate analysis. Three resemblance matrices were obtained using size independent 1) continuous (Euclidean distances), 2) meristic (Bray-Curtis similarity) and 3) categorical (Bray-Curtis similarity) features in order to discern which type of features yielded better mor-phological differentiation. Euclidean distances are sensitive to differences of scale, thus all con-tinuous features were first re-scaled between zero and one by dividing each observed value by the maximum value recorded for that feature. Overall morphological dissimilarity among indi-viduals was assessed by multi-dimensional scaling (MDS) and hierarchical clustering (Cluster) analyses. Morphologically homogeneous clusters were determined by similarity profiles (SIM-PROF) atα= 0.001. Morphological differences among clusters established by SIMPROF were
quantified by means of similarity analysis (ANOSIM), and similarity percentages (SIMPER) were used to determine the relative contribution of features to morphological dissimilarity between clusters. All multivariate analyses were performed in Primer v.6 [65].
Univariate analysis. Differences in size-corrected continuous and meristic features were tested by two-way ANOVAs with“clade”and“location”as fixed factors. Tukey’s tests were used for multiple comparisons. Differences in ordinal categorical features were tested by a one-way approach using non-parametricKruskal-Wallisand multiple pair-wise tests were per-formed. Differences in nominal categorical features were tested through a one-way approach using a multipleχ2test for homogeneity of proportions (Ho= homogeneous frequency of
states) and the correspondingχ2pair-wise comparisons.
Results
Molecular analysis
MitochondrialCOI. DNA from a total of 29Aureliaindividuals (14 from CNGoM, 15 from SEGoM) were PCR-amplified and DNA sequenced, resulting in an aligned data set of 655 bases for sequences generated for this study. Including the 29 publishedAureliasequences, 231 bases of the 655-base dataset were variable, with 219 being parsimony informative. Of the 231variable sites, 42 (18.2%) occurred at first position bases, 2 (0.9%) at second position and 187 (81.0%) at third position. Base frequencies were: A = 23.8%, C = 21.3%, G = 20.4% and T = 34.6%.
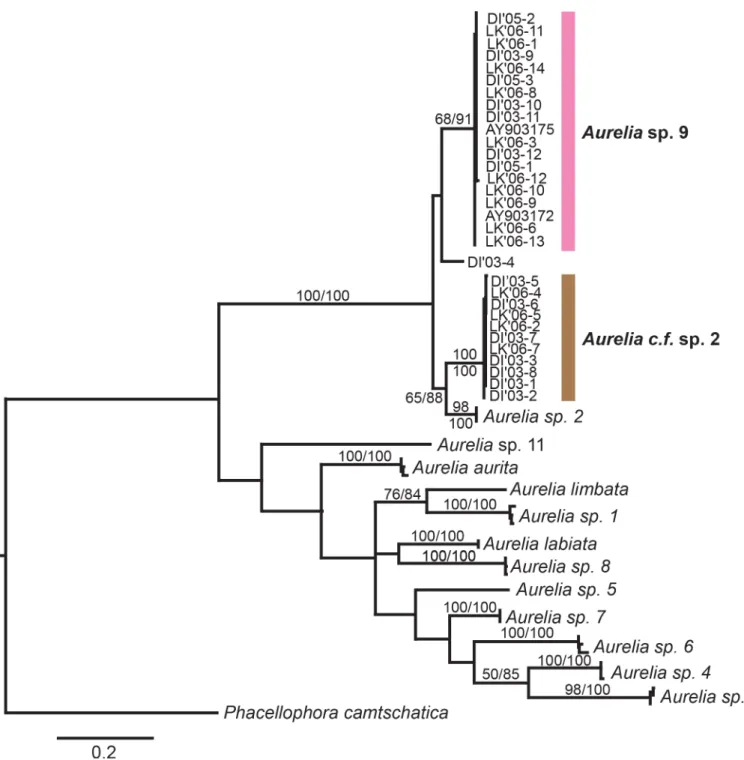
TheCOImaximum likelihood phylogeny indicated that most of theAureliasequences gen-erated for this study fell into two distantly related (minimum: 11.8% divergence; average: 12.7% divergence;S3 Table), well-supported monophyletic groups (Fig 4), with 17 specimens forming a clade withAureliasp. 9 from the Gulf of Mexico [44] and 11 individuals forming a distinct clade most closely related (minimum 11% divergence, average 11.5%;S3 Table) to Aur-eliasp. 2 from Brazil [42] (Fig 4). This clade, referred to here asAureliac.f. sp. 2 (see Discus-sion), is reciprocally monophyletic to bothAureliasp. 2 andAureliasp. 9 (Fig 4). In addition, one individual (DI’03–4) did not group with any species, differing fromAureliasp. 9,Aurelia
Statistical parsimony network analysis ofCOIsequences showed that the most common haplotypes of eachAurelialineages were shared by individuals from both the CNGoM and the SEGoM (S1 Fig). Haplotype diversity forAureliasp. 9 was–0.86 ± 0.14 in the CNGoM and
Fig 4. Global phylogeny ofAureliabased on cytochrome C oxidase subunit 1 (COI).Numbers indicate bootstrap values higher than 50% (maximum likelihood, 1,000 realizations). DI: Dauphin Island, Alabama. LK: Long Key, Florida. Sequences obtained in this study are shaded. The rest of sequences were obtained from GenBank (seeS1 Tablefor details).Aurelia aurita(Turkey, Sweden, Boston-USA), 2)Aurelia labiata(British Columbia-Canada), 3)Aureliasp. 1 (Los Angeles-USA, Australia, Japan), 4)Aureliasp. 2 (Brazil), 5)Aureliasp. 3 (Palau), 6)Aureliasp. 4
(Hawaii-USA, Indonesia, Palau), 7)Aureliasp. 5 (Mljet Lake, Croatia), 8)Aureliasp. 6 (Palau, New Guinea), 9)Aureliasp. 7 (Tasmania, Australia), 10) Aureliasp. 8 (North Adriatic, Croatia), 11)Aureliasp. 9 (Gulf of Mexico, USA; this study), 12)Aurelia limbata(Aureliasp. 10, Japan), 13)Aurelia
0.84 ± 0.10 in the SEGoM. Haplotype diversity forAureliac.f. sp. 2 was 1.0 ± 0.08 in the CNGoM and 1.0 ± 0.18 in the SEGoM. AMOVA detected no significant geographic population sub-division in eitherAurelialineage (S4 Table), with only 6.47% (Aureliasp. 9) and -1.95% (Aureliac.f. sp. 2) of the total intraspecific genetic variation explained by genetic differences between locations.
NuclearITS-1. A total of 61ITS-1clones were sequenced from 31Aureliaspecimens (18 from CNGoM and 13 from SEGoM) and amplified fragments (including flanking 18S and 5.8S sequence) varied in length from 652 (Clade I) to 712 (Clade II) base pairs, with all length varia-tion (e.g. inservaria-tion/delevaria-tions) within theITS-1region. After sequence alignment and the appli-cation of GBlocks to remove regions of questionable alignment, the finalITS-1dataset was 359 base pairs. Of the 359 base pairs, 54 were gapped, 55 were variable, gapped and non-degenerate, with 47 being parsimony informative. Base frequencies were: A = 20.6%, C = 26.8%, G = 29.9%, T = 22.8%.
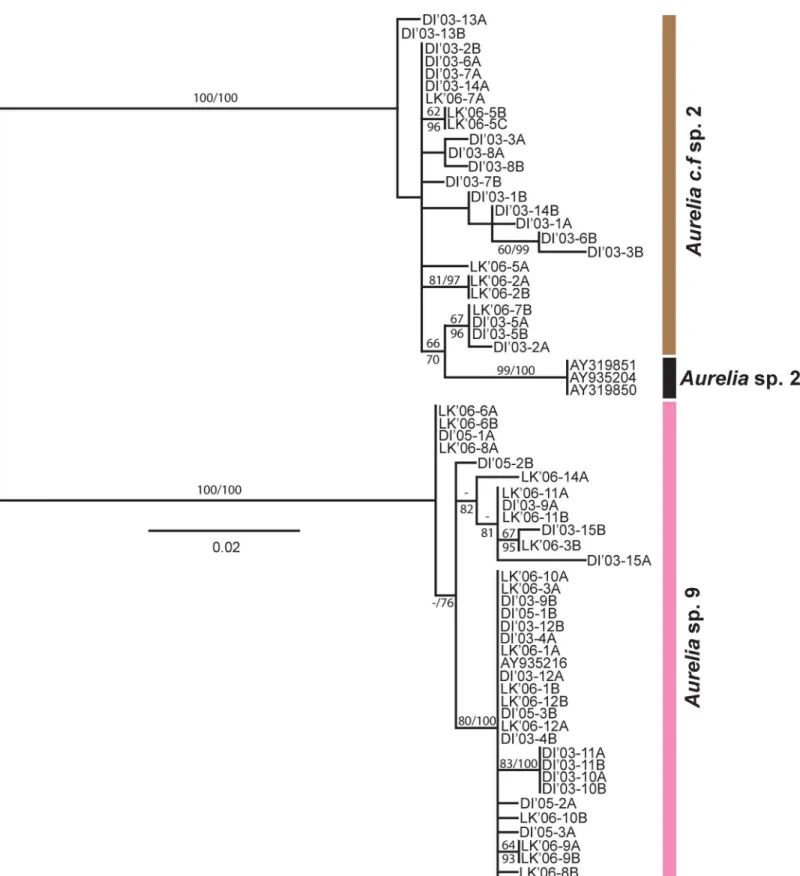
The smaller scaleITS-1phylogeny (Fig 5) was generally similar to that found forCOI, but with lowered clade divergence in some cases. Thirty-six clones from19 individuals formed a clade withAureliasp. 9 [44], while 25 clones from 12 individuals formed a clade similar to Aur-eliasp. 2 from Brazil [42], with a minimum genetic divergence of 9.2% between clades (Fig 6). The animals from the second,Aureliasp. 2-like (Aureliac.f. sp. 2 based onCOI) clade, still dif-fered fromAureliasp. 2 by a minimum sequence divergence of 1.9% (Average: 2.3%), but did not form a separate, well-supported monophyletic group (Fig 5).
Morphological analysis
Bell diameter. Since molecular analyses revealed the presence of two distantly related Aur-eliamonophyletic groups based on bothCOIandITS-1, variation in bell diameter with age was analyzed for each clade separately. Medusae of each clade were split into three groups: I) NGoM (2003), II) NGoM (2005), III) SEGoM (2006). Differences in bell diameter versus age, between locations and years, were then tested with two-way ANOVAs, with“group”and“age”
(number of branching points) as fixed factors. ANOVA detected a significant“group x age”
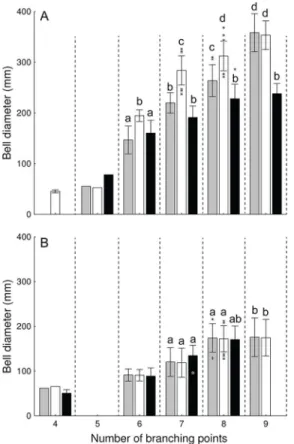
effect on bell diameter ofAureliasp. 9 (F6,60= 49, P<0.001) Medusae ofAureliasp. 9 from the CNGoM collected in 2003 had significantly larger bell diameters at 6, 7, and 8 branching points than their counterparts from the same location collected in 2005 (Tukey’s, P<0.05), but they reached a similar size at 9 branching points (Fig 6A).Aureliasp. 9 medusae from the CNGoM collected in 2003 and 2005 had significantly larger bell diameters at any given number of branching points and at eight and nine branching points, respectively, than their counterparts from the SEGoM (Tukey’s, P<0.05;Fig 6A). In contrast, ANOVA detected only a significant
“age”affect on the bell diameter ofAureliac.f. sp. 2 (F6,49= 49, P<0.01), indicating that bell diameter did not differ between locations, or years, at any given branching point (ANOVA,P> 0.05;Fig 6B).
Continuous features. Hierarchical Cluster Analysis (Cluster) and Multi Dimensional Scaling (MDS) analyses grouped allAureliamedusae into three morphologically homoge-neous, non-overlapping clusters (SIMPROF:π= 0.83, P<0.005;Fig 7), which included all Aur-eliasp. 9 medusae collected from the SEGoM (Cluster 1), allAureliasp. 9 individuals collected from the CNGoM (Cluster 2) and allAureliac.f. sp. 2 specimens collected from both the CNGoM the SEGoM (Cluster 3), respectively (Fig 7). ANOSIM revealed a significant morpho-logical dissimilarity among all clusters (R= 0.86, P<0.0001, all pair-wise comparisons).
Fig 5. Phylogeny ofAureliain the Gulf of Mexico based onITS-1.NoteAureliac.f. sp. 2 (based on mitochondrialCOI) is grouped within theAureliasp. 2 clade. The tree was mid-rooted. Bootstrap values higher than 50% are shown (maximum likelihood, 1,000 realizations). Sequences obtained in this study are DI (Dauphin Island, AL) and LK (Long Key, FL). The other sequences were obtained from GenBank (seeS1 Table).
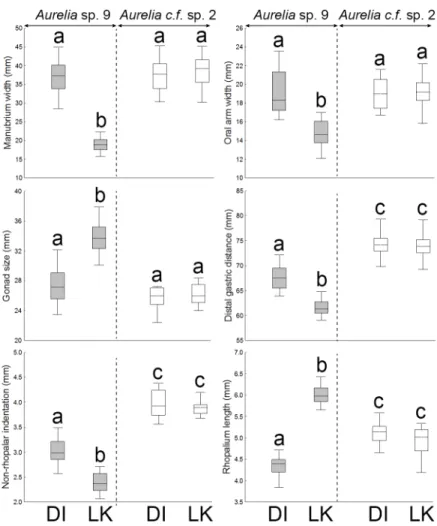
inAureliasp. 9 was due to variation in six features, including manubrium width (30.6%), oral arm width (17.4%), gonad size (13.2%), distal gastric distance (10.3%), non-rhopalar indenta-tion (10.1%), and rhopalium length (8.4%).Aureliasp. 9 medusae from the NGoM had signifi-cantly wider and longer manubria, wider and longer oral arms, longer proximal and distal gastric distances, smaller rhopalia, smaller gonads, thinner umbrellas, and deeper non-rhopalar indentations, than individuals from the SEGoM (Tukey’s, P<0.01;Fig 8).
Six features varied betweenAureliasp. 9 andAureliac.f. sp. 2 independently of location, including manubrium length, oral arm length, distal and proximal gastric distance, depth of non-rhopalar indentations, and bell thickness (Tukey’s, P<0.01;Fig 8). In addition, four fea-tures varied significantly between clades, but were location-dependent. These included manu-brium and oral arm width, length of rhopalium, and gonad size (Tukey’s, P<0.01;Fig 8).
Categorical features. Cluster and MDS analyses grouped individuals in the same three main clusters obtained using continuous features (Fig 9). SIMPROF analysis, however, detected morphological subdivision within Cluster 3 (Aureliac.f. sp. 2, Sub-clusters A and B) and Clus-ter 2 (Aureliasp. 9 from the CNGoM, Sub-clusters C and D;π= 2.1, P<0.002;Fig 9).
ANO-SIM indicated significant morphological dissimilarity among all clusters detected by ANO-SIMPROF (R = 0.89,P<0.001, p<0.001 all pair wise comparisons). A certain degree of geographic sub-division was displayed byAureliac.f. sp. 2 medusae, with the majority (68%) of individuals col-lected from the CNGoM forming sub-cluster A, and most individuals from the SEGoM (87%) being included in sub-cluster B.
Fig 6. Relationship between bell diameter and number of branching points (i.e., age) inAurelia medusae from the Gulf of Mexico.A:Aureliasp. 9. B:Aureliac.f. sp. 2. Grey (2003) and hollow (2005) bars represent medusae collected from the Central Northern Gulf of Mexico (Dauphin Island, AL), while black bars represent individuals collected in the Southeastern Gulf of Mexico (Long Key, FL 2006). Means with different letters are significantly different (Tukey’s, P<0.001). Bars: SD. Asterisks: outliers
Medusae ofAureliasp. 9 exhibited significant geographic variation in five out of nine cate-gorical features recorded (S5 Table); however, SIMPER indicated the geographic variation (90%) was explained by variation in three features, including the degree of oral arm folding (51%), gonad color (24%), and gonad shape (15%).Aureliasp. 9 medusae from the CNGoM had a significantly higher degree of oral arm folding (Post-Kruskal-Wallis, P<0.001), and darker, more predominantly“drop-like”shape (χ2-tests,p<0.001) gonads, than counterparts
in the SEGoM (Fig 10).
Fig 7. Morphological variation inAureliamedusae from the Gulf of Mexico based on continuous (size-corrected)
morphological features.Top: Cluster analysis. Red lines indicated morphologically homogeneous clusters detected by SIMPROF.
Bottom: Multi-dimensional scaling analysis (MDS). Different symbols indicate different monophyleticAureliaclades based onCOI. Circles:Aureliasp. 9. Squares:Aureliac.f. sp. 2. Solid symbols represent individuals with molecular + morphological data, while open symbols are individuals with only morphological data. Cluster 1:Aureliasp. 9 from Long Key (2006). Cluster 2:Aureliasp. 9 from Dauphin Island (2003 and 2005). Cluster 3:Aureliac.f. sp. 2 from Dauphin Island (2003 and 2005) and Long Key (2006). Contours
represent 95% confidence.
doi:10.1371/journal.pone.0156588.g007
Fig 8. Morphological variation in continuous, size-corrected features ofAureliamedusae in the Gulf of Mexico.DI: Dauphin Island (AL), which represents the Central Northern Gulf of Mexico. LK: Long Key (FL), which represents the Southeastern Gulf of Mexico. Features explaining 90% of the total morphological variation (SIMPER) are shown. Different letters above whiskers indicate significant differences among groups detected by post-hoc Tukey’s tests (P<0.0001). Boxes: median, the 25–75% quartiles. Whiskers:
Non-outlier range. Circles: Non-outliers
Only two features ofAureliac.f. sp. 2 varied significantly between locations (S5 Table), and each one explained 50% of the geographic morphological variation in this lineage (SIMPER). Individuals ofAureliac.f. sp. 2 from the CNGoM had thicker mesoglea surrounding the sub-genital pore, and more variation in gonad shape, than individuals from the SEGoM (Fig 10). Variation in all the aforementioned features accounted for at least 90% of the total geographic morphological variation within both clades.
Four categorical morphological features differed betweenAureliasp. 9 andAureliac.f. sp. 2 independently of location, which included color of bell and bell margin, and shape and color of gonad tissue (Pair-wiseχ2-tests, P<0.001 for all features;Fig 10). Three morphological features
varied significantly between clades, but were location-dependent. These included thickness of mesoglea around the sub-genital pore, degree of oral arm folding (Post-Kruskal-Wallis, P< 0.05), and color of gastric tissue (Pair-wiseχ2-tests;p<0.001;Fig 10).
Meristic features. Cluster and MDS analyses using meristic features did not reveal intra-or inter-specific mintra-orphological differentiation (S2 Fig). Instead, individuals were grouped in two morphologically homogeneous main clusters (SIMPROF:π= 0.15, P<0.001) due to
ran-dom variation in the number of interradial originations (90%, SIMPER), independently of clades, location, or year of collection (S2 Fig).
Discussion
The use of molecular and morphological analysis in this study revealed the presence of two molecularly and morphologically distinct species ofAureliaco-occurring in the Gulf of Mexico (GoM):Aureliasp. 9 andAureliac.f. sp. 2. Neither species exhibited significant population sub-division between the Central Northern GoM and the Southeastern GoM, but the degree of geographic morphological differentiation varied greatly between lineages, in spite of their co-occurrence at the extremes of a latitudinal environmental gradient. The morphology ofAurelia
sp. 9 was clearly geographically structured (i.e., local phenotype), while the morphology of Aur-eliac.f. sp. 2 was geographically invariant (i.e., generalist phenotype). The current study repre-sents, to our knowledge, the first case of different ecological strategies in response to
environmental variation in two sympatric, congeneric jellyfish lineages. These findings not only suggest evolution under different environmental conditions (i.e., different selective pres-sures) that led to the implementation of different strategies to cope with environmental hetero-geneity, but also emphasize the importance of using genetics and morphometrics in concert to understand jellyfish ecology, evolution and taxonomy.
Mitochondrial (COI) and nuclear (ITS-1) DNA sequence data indicated that there are two different phylogenetic species co-occurring in the GoM. The minimum percentage sequence divergence inCOIdetected betweenAureliasp. 9 andAureliac.f. sp. 2 (11.8%; Average 12.7%) not only fell within the 10–20% (average) range previously considered diagnostic for delineat-ing species ofAurelia[42,44],Cassiopea[32],Cyanea[66,67], andDrymonema[33], but also was higher than the average congeneric interspecific distance threshold (~11%) previously determined for the Class Scyphozoa [68]. In addition, minimum sequence divergence forITS-1
between the two GoM lineages (9.2%; average 12.7%) was also within range of averageITS-1 Fig 9. Morphological variation inAureliamedusae from the Gulf of Mexico based on categorical morphological features.
Top: Cluster analysis. Red lines indicated morphologically homogeneous clusters detected by SIMPROF. Bottom: Multi-dimensional scaling analysis (MDS). Numbers correspond to the same main clusters detected by SIMPROF using continuous features. Letters indicate sub-clusters within main clusters. Different symbols indicate different monophyleticAureliaclades based on COI. Circles: Aureliasp. 9. Squares:Aurelia c.f. sp. 2. Solid symbols represent individuals with molecular + morphological data, while open
symbols are individuals with only morphological data. Cluster 1:Aureliasp. 9 from Long Key (2006). Cluster 2:Aureliasp. 9 from Dauphin Island (2003 and 2005). Cluster 3:Aureliac.f. sp. 2 from Dauphin Island (2003 and 2005) and Long Key (2006). Contours represent 95% confidence.
sequence divergence among congeneric species ofAurelia[42,50,69] andCyanea[66]. It should be noted thatITS-1divergence values are likely affected by how gapped and unalignable regions are treated and, therefore, published values are likely affected by the fact that these regions were not handled in a consistent manner across past publications (e.g.,[42,50,69]). Although individuals from the GoM (Aureliac.f. sp. 2) and Brazil (Aureliasp. 2) form two dis-tantly related clades based onCOI(minimum divergence 11.0%; average: 11.5%), they did not differ greatly forITS-1(minimum: 1.9%; average: 2.3%). Hence, given these discrepancies and the fact that naming a new species is beyond the scope of this paper, we have taken the conser-vative approach of giving the nameAureliac.f. sp. 2 to this GoM clade, in order to reflect its divergence from (based onCOI) and similarity to (based onITS-1)Aureliasp. 2. However, clarifyingAureliataxonomy in the western Atlantic will require additional research.
Fig 10. Morphological variation in categorical features ofAureliamedusae in the Gulf of Mexico.A-B: Ordinal categorical features. C-D: nominal
categorical features. DI: Dauphin Island (AL), which represents the Central Northern Gulf of Mexico. LK: Long Key (FL), which represents the Southeastern Gulf of Mexico. Features explaining 90% of the total morphological variation (SIMPER) are shown. Different letters above whiskers indicate significant differences among groups detected by post-hoc Kruskal-Wallis tests (P<0.001; A-B) andChi-squaretests (P<0.001; C-D). Gonad shape in panel C are:
U-shape (hollow bars), horseshoe (gray bars) and drop-like (black bars). Boxes: median, the 25–75% quartiles. Whiskers: Non-outlier range.
Genetic data suggests that, despite co-occurring spatially and temporally in the GoM, Aure-liasp. 9 andAureliac.f. sp. 2 have distinct evolutionary histories. Reconstructed phylogeny based onCOIrevealed a well supported sister-species relationship betweenAureliac.f. sp. 2 andAureliasp. 2 from Brazil (~7000 km south of the GoM; [42]), suggesting these two lineages likely share a recent common ancestor that is different from that ofAureliasp. 9. Further sup-port is added by the minor segregation betweenAureliac.f. sp. 2 andAureliasp. 2 based on
ITS-1. Considering 0.5–1.4% of sequence divergence inCOIper million years in several marine invertebrates [70,71,72] including hydrozoan jellyfish [73], divergence betweenAureliasp. 9 andAureliac.f. sp. 2 may have occurred during the Miocene (23–7.1 Myr BP), and the lack of evidence for hybridization fromITS-1data suggests these species have remained reproductively isolated ever since. Estimations of divergence, however, must be taken with caution, because 1) mutation rates can be both location and taxa-specific [73], 2) reliable clock calibrations for scy-phozoans have not been developed yet [74], and 3) potential saturation of mutations at neutral nucleotide positions may result in underestimations of divergence time [42].
The geographically structured morphology displayed by individualsAureliasp. 9 despite a lack of genetic structure is likely due to ecophenotypic plasticity. Several theoretical and empir-ical studies suggest that the homogenizing effects of high gene flow between selective environ-ments (in this case, the CNGoM and the SEGoM) can reduce local, genetic adaptation and favor the evolution phenotypic plasticity [4,9,75], but see [76]. Gene flow can introduce genes adapted to environmental conditions that may differ from local conditions, which can be potentially maladaptive in the new environment. Therefore, phenotypic plasticity allows organisms adapt quickly to an alternate environment [75] and potentially optimize fitness [77] by shifting the phenotype of a population toward a local optimum without any genetic differ-entiation [78]. Thus, given the lack of significant genetic structure between sampled locations found in this study, the geographic morphological variation observed inAureliasp. 9 likely represents a plastic response to differences in local environmental conditions. In addition, models for the evolution of phenotypic plasticity indicate that the consistency of environmen-tal cues, and the capacity of organisms to sense the environment, is of the outmost importance for plasticity to be favored within and across generations [79]. Hence, it is plausible that the ecophenotypic plasticity displayed byAureliasp. 9 is an adaptation as a result of evolution under reliable and consistent environmental variation.
results were observed inAurelia auritafrom Southampton Water, which reached full develop-ment at smaller sizes with increased temperature [81]. In addition, an increase in food supply can slow gonad development inAurelia[82]; thereby, well-fed individuals reached maturity later, and at larger sizes, than food-limited medusae.
The geographic morphological variation displayed by medusae ofAureliasp. 9 may translate to geographic differences in fecundity and reproductive capacity. Previous studies have shown that size is correlated with fecundity and reproductive output in jellyfish [87,88]; thereby, it is likely thatAureliasp. 9 medusae from the CNGoM produce more eggs and planula larvae than individuals in the SEGoM. InAurelia, female medusae are brooders, and their planula larvae are carried on the oral arms[89]. Interestingly,Aureliasp. 9 medusae from CNGoM had relatively wider/longer oral arms than their counterparts from the SEGoM. It is plausible that the larger, potentially more fecund individuals from the CNGoM require a relatively larger surface to carry their planulae, which can be achieved by developing proportionally larger oral arms. In addition, medusae ofAureliasp. 9 from the CNGoM had a significantly higher degree of folding of the oral arms than counterparts from the SEGoM, which increases oral arm surface even further and can potentially allow medusae to maximize their carrying capacity for planula larvae. It is curious that the degree of folding of oral arms was the only morphological feature that showed sexual dimor-phism. Females had more convoluted oral arms than males, a pattern previously observed in otherAureliaspecies [31].However, sexual differences in the degree of folding of the oral arms of
Aureliasp. 9 were only significant in the CNGoM (data not shown). These findings suggest that the reproductive capacity ofAureliasp.9 medusae is plastic. Hence, individuals from the CNGoM likely have a higher reproductive capacity than counterparts in the SEGoM, which may potentially translate into differences in larva recruitment and, subsequently medusa numbers, between these two areas. This hypothesis is supported by a previous study by Rodden et al [80], which shows that abundance ofAureliamedusae in the CNGoM was considerably higher than in the SEGoM.
On the other hand, considering high genetic connectivity between sampling locations in Aure-liac.f. sp. 2, the generalized phenotypes displayed by medusae of this species are likely the result of environmental canalization, the reduced sensitivity (or increased robustness) of phenoypes to environmental change [12]. Individuals ofAureliac.f. sp. 2 exhibited no significant geographic morphological structure despite being exposed to geographic environmental variation. Environ-mental canalization is thought to have evolved as a product of stabilizing selection in environ-ments with relatively low spatio-temporal variability [12]. Under stabilizing selection, a reduced environmental variation increases mean fitness; thereby, the evolution of environmental canali-zation is favored [11,90]. Therefore, the results of this study suggests thatAureliac.f. sp. 2 may have originated in a relatively stable environment that may have favored the evolution of invari-ant phenotypes, likely via genetic assimilation [91], allowingAureliac.f. sp. 2’s genotype can express a non-plastic morphology despite being exposed to environmental change.
Previous studies have shown that canalizing mechanisms can be located at any level of bio-logical hierarchy; thereby, lack of variation may be observed at the morphobio-logical level but not at the level of gene expression or physiology [92]. In addition, canalization implies a trade-off where stability at one level may depend upon variability at another level [93]. Hence, it is plau-sible that morphology ofAureliac.f. sp. 2 is maintained invariant, despite environmental change, at the expense of non-random latitudinal variation in gene expression not detected by the methods used in this study. This phenomenon termed counter-gradient variation [94] has been previously proposed to explain phenotypic similarities amongAureliaspecies distributed along latitudinal environmental gradient [95]. Further research will be needed to elucidate the mechanisms behind the observed pattern.
inAureliaand other scyphozoan medusae, includingCyaneaandDrymonema, have also revealed congruent patterns of genetic and phenotypic divergence [31,33,35], but see [32]. Morphological variation among congeneric species often indicates reproductive isolation and evolution under different ecological conditions [96]. Therefore, based on the results of this study, we hypothesize thatAureliasp. 9 andAureliac.f. sp. 2 have different evolutionary histo-ries, and that these species evolved independently under different selective pressures (i.e, differ-ent environmdiffer-ental conditions) that resulted in differdiffer-ent ecological strategies to cope with environmental variation. A similar mechanism has been proposed by Schroth et al. [50], who suggested that ecological differences observed amongAurelialineages may be the result of divergent selection, with environmental factors playing a deterministic role in diversification. The plastic, generalist strategy exhibited by medusae ofAureliasp. 9 in the GoM may translate in the potential expression of“optimal”, environmentally-dependent phenotypes that confer high relative fitness in different environments, while the non-plastic generalist individuals of
Aureliac.f. sp.2 may produce an environmentally-independent phenotype that gives the high-est mean fitness across environments [10,40]. Assessing the extent and patterns of environ-mentally-induced intra and inter-specific phenotypic differentiation in jellyfish is necessary to comprehend mechanisms of bloom formation and to predict future mass occurrences. Consid-ering the world’s changing ocean conditions (e.g., warming temperatures, eutrophication, acid-ification, etc.), it is essential to determine how this environmental change can induce
phenotypic changes and the potential consequences of those changes on reproduction and fit-ness of jellyfish.
Supporting Information
S1 Fig. Network tree based onCOIforAureliasp. 9 andAureliac.f. sp. 2 in the Gulf of Mexico.
(DOCX)
S2 Fig. Morphological variation inAureliafrom the Gulf of Mexico based on meristic fea-tures.
(DOCX)
S1 Table. List of sequences obtained from Genbank used in this study. (DOCX)
S2 Table. Morphological features recorded perAureliamedusa in this study. (DOCX)
S3 Table. Pairwise genetic divergence amongAureliaspecies based onCOI. (DOCX)
S4 Table. Summary of the AMOVA based on COI forAureliasp.9 andAureliasp.12 in the Gulf of Mexico.
(DOCX)
S5 Table. Variation in individual size-independent morphological features ofAureliafrom the Gulf of Mexico.
(DOCX)
Acknowledgments
generating isothermal lines inFig 2. We appreciate the help of Dauphin Island Sea Lab boat captains, including Rodney Collier, Russell Wilson, Clark Lollar, and Tom Guoba. We would like to thank DISL tech support, especially Kyle Weis, Al Gunter and Laura Linn for their assis-tance in the lab. We thank the personnel of the Keys Marine Lab for their valuable help in the field and laboratory facilities. Most of the genetic data were collected while visiting the lab of Dr. Michael N Dawson (University of California Merced). We also thank Dr. Giorio Aglieri and an anonymous reviewer for their comments and suggestions, which helped to improve our manuscript. This research was funded by the Mississippi-Alabama Sea Grant Consortium (R/ CEH-1) and the National Science Foundation (OCE-9733441).
Author Contributions
Conceived and designed the experiments: LMC KMB WMG. Performed the experiments: LMC KMB. Analyzed the data: LMC KMB. Contributed reagents/materials/analysis tools: WMG. Wrote the paper: LMC KMB WMG.
References
1. Moran NA. The evolutionary maintenance of alternative phenotypes. Am Nat. 1992; 1: 971–989.
2. Donaldson-Matasci M, Lachmann M, Bergstrom C. Phenotypic diversity as an adaptation to environ-mental uncertainty. Evol Ecol Res. 2008; 10: 493–515.
3. Stearns S. The evolutionary significance of phenotypic plasticity. Bioscience. 1989; 39: 436–445.
4. Sultan SE, Spencer HG. Metapopulation structure favors plasticity over local adaptation. Am Nat. 2002; 160: 271–283. doi:10.1086/341015PMID:18707492
5. Torres-Dowdall J, Handelsman CA, Reznick DN, Ghalambor CK. Local adaptation and the evolution of phenotypic plasticity in Trinidadian guppies (Poecilia reticulata). Evolution. 2012; 66: 3432–43. doi:10. 1111/j.1558-5646.2012.01694.xPMID:23106708
6. Whitman D, Agrawal A. What is phenotypic plasticity and why is it important? In: Whitman DW, Ana-nthakrishnan TN, editors. Phenotypic plasticity of insects: mechanisms and consequences. Science Publishers; Enfield, Jersey & Plymouth; 2009. pp 1–63.
7. Pigliucci M. Phenotypic Plasticity: Beyond Nature and Nurture. JHU Press; 2001.
8. Kawecki T, Ebert D. Conceptual issues in local adaptation. Ecol Lett. 2004; 7: 1225–1241.
9. Crispo E. Modifying effects of phenotypic plasticity on interactions among natural selection, adaptation and gene flow. J Evol Biol. 2008; 21: 1460–1469. doi:10.1111/j.1420-9101.2008.01592.xPMID: 18681916
10. Murren C, Auld J, Callahan H. Constraints on the evolution of phenotypic plasticity: limits and costs of phenotype and plasticity. Heredity. 2015; 115: 293–301. doi:10.1038/hdy.2015.8PMID:25690179
11. Siegal M, Bergman A. Waddington’s canalization revisited: developmental stability and evolution. Proc
Natl Acad Sci. 2002; 16: 10528–10532.
12. Flatt T. The evolutionary genetics of canalization. Q Rev Biol. 2005; 80: 287–316. PMID:16250465
13. Alvarado-Serrano D. Localized versus generalist phenotypes in a broadly distributed tropical mammal: how is intraspecific variation distributed across disparate environments? BMC Evol Biol. 2013; 13:1–
16.
14. Dawson MN, Hamner WM. A character-based analysis of the evolution of jellyfish blooms: adaptation and exaptation. Hydrobiologia. 2009; 616: 193–215.
15. Purcell J, Arai M. Interactions of pelagic cnidarians and ctenophores with fish: a review. Hydrobiologia.
2001; 451: 27–44.
16. Stibor H, Tokle N. Feeding and asexual reproduction of the jellyfishSarsia gemmiferain response to
resource enrichment. Oecologia. 2003; 135: 202–208. PMID:12698341
17. Richardson JA, Bakun A, Hays GC, Gibbons MJ. The jellyfish joyride: causes, consequences and man-agement responses to a more gelatinous future. Trends Ecol Evol. 2009; 24: 312–322. doi:10.1016/j.
tree.2009.01.010PMID:19324452
19. Doyle T, Haas H De. Widespread occurrence of the jellyfishPelagia noctilucain Irish coastal and shelf waters. J Plankton Res. 2008; 30: 963–968.
20. Dong Z, Liu D, Keesing JK. Jellyfish blooms in China: Dominant species, causes and consequences. Mar Pollut Bull. 2010; 60: 954–963. doi:10.1016/j.marpolbul.2010.04.022PMID:20553695
21. Delannoy CMJ, Houghton JDR, Fleming NEC, Ferguson HW. Mauve Stingers (Pelagia noctiluca) as
carriers of the bacterial fish pathogenTenacibaculum maritimum. Aquaculture. 2011; 311: 255–257.
22. Purcell J, Uye S, Lo W. Anthropogenic causes of jellyfish blooms and their direct consequences for humans: a review. Mar Ecol Prog Ser. 2007; 350: 153–174.
23. Daryanabard R, Dawson MN. Jellyfish blooms:Crambionella orsini(Scyphozoa: Rhizostomeae) in the Gulf of Oman, Iran, 2002–2003. J Mar Biol Assoc UK. 2008; 88: 477–483.
24. Fenner PJ, Williamson JA, Burnett JW. Clinical aspects of envenomation by marine animals. Toxicon.
1996; 34: 41–101.
25. Chiaverano LM, Holland BS, Crow GL, Blair L, Yanagihara AA. Long-term fluctuations in circalunar
beach aggregations of the box jellyfishAlatina moseriin Hawaii, with links to environmental variability. PLOS ONE 8(10): e77039. doi:10.1371/journal.pone.0077039PMID:24194856
26. Robinson KL, Graham WM. Long-term change in the abundances of northern Gulf of Mexico
scypho-medusaeChrysaorasp. andAureliaspp. with links to climate variability. Limnol Ocean. 2013; 58: 235–
253.
27. Purcell JE. Jellyfish and ctenophore blooms coincide with human proliferations and environmental
per-turbations. Ann Rev Mar Sci. 2012; 4: 209–235. PMID:22457974
28. Lucas CH. Reproduction and life history statregies of the common jellyfish,Aurelia aurita, in relation to its ambient environment. Hydrobiologia. 2001; 451: 229–246.
29. Condon RH, Duarte CM, Pitt KA, Robinson KL, Lucas CH, Sutherland KR, et al. Recurrent jellyfish blooms are a consequence of global oscillations. Proc Natl Acad Sci. 2013; 110: 1000–1005. doi:10. 1073/pnas.1210920110PMID:23277544
30. Arnold S. Morphology, performance and fitness. Am Zool. 1983; 23: 347–361.
31. Dawson MN. Macro-morphological variation among cryptic species of the moon jellyfish,Aurelia
(Cni-daria: Scyphozoa). Mar Biol. 2003; 143: 369–379.
32. Holland BS, Dawson MN, Crow GL, Hofmann DK. Global phylogeography ofCassiopea(Scyphozoa: Rhizostomeae): molecular evidence for cryptic species and multiple invasions in the Hawaiian Islands. Mar Biol. 2004; 145: 1119–1128.
33. Bayha KM, Dawson MN. New Family of Allomorphic Jellyfishes, Drymonematidae (Scyphozoa, Disco-medusae), Emphasizes Evolution in the Functional Morphology and Trophic Ecology of Gelatinous Zooplankton. Biol Bull. 2010; 219: 249–267. PMID:21183445
34. Dawson MN.Cyanea capillatais not a cosmopolitan jellyfish: morphological and molecular evidence for C. annaskala and C. rosea (Scyphozoa: Semaeostomeae: Cyaneidae) in south-eastern Australia. Invertebr Syst. 2005; 19: 361–370.
35. Dawson MN. Morphological variation and systematics in the Scyphozoa:Mastigias(Rhizostomeae, Mastigiidae)—a golden unstandard? Hydrobiologia. 2005; 537: 185–206.
36. Baranova O, Biddle M, Boyer T, Garcia H, Hamilton M, Paver C SD. Seawater Temperature— Climato-logical Mean In Gulf of Mexico Data Atlas. Natl Centers Environ Information. Available:http://gulfatlas. noaa.gov/B2014. 2014.
37. Garcia H. Seawater Nitrates. Gulf Mex Data Atlas Natl Centers Environ Information; Available:http:// gulfatlas.noaa.gov/. 2014
38. Lohrenz S, Fahnenstiel G, Redalje D. Variations in primary production of northern Gulf of Mexico conti-nental shelf waters linked to nutrient inputs from the Mississippi river. Mar Ecol. 1997; 155:45–54.
39. Holt R, Gomulkiewicz R. How does immigration influence local adaptation? A reexamination of a
famil-iar paradigm. Am Nat. 1997; 149: 563–572.
40. Tienderen P Van. Generalists, specialists, and the evolution of phenotypic plasticity in sympatric popu-lations of distinct species. Evolution. 1997; 1: 1372–1380.
41. Ausubel F, Brent R, Kingston R, Moore D, Seidman J, Smith J SK. Current Protocols in Molecular Biol-ogy. Wiley and Sons, New York. Wiley and Sons, New York; 1989.
42. Dawson MN, Jacobs DK. Molecular evidence for cryptic species ofAurelia aurita(Cnidaria: Scypho-zoa). Biol Bull. 2001; 200: 92–96. PMID:11249217
43. Dawson MN. Five new subespecies ofMastigias(Scyphozoa: Rhizostomeae: Mastigiidae) from marine
44. Dawson MN, Gupta AS, England MH. Coupled biophysical global ocean mode and molecular genetic analyses identify multiple introductions of crytogenic species. Proc Natl Acad Sci. 2005; 102: 11968–
11973. PMID:16103373
45. Vrijenhoek R. DNA primers for amplification of mitochondrial cytochrome c oxidase subunit I from diverse metazoan invertebrates. Mol Mar Biol Biotechnol. 1994; 3: 294–9. PMID:7881515
46. Bayha K. The molecular systematics and population genetics of four coastal ctenophores and
scypho-zoan jellyfish of the US Atlantic and Gulf of Mexico. PhD Dissertation, The University of Delaware. 2005.
47. Larkin M, Blackshields G, Brown N. Clustal W and Clustal X version 2.0. Bioinformatics. 2007; 23: 2947–2948. PMID:17846036
48. Katoh K, Standley D. MAFFT multiple sequence alignment software version 7: improvements in
perfor-mance and usability. Mol Biol Evol. 2013; 30:772–80. doi:10.1093/molbev/mst010PMID:23329690
49. Katoh K, Toh H. Recent developments in the MAFFT multiple sequence alignment program. Briefings Bioinformatics. 2008; 9:286–98.
50. Schroth W, Jarms G, Streit B, Schierwater B. Speciation and phylogeography in the cosmopolitan marine moon jelly,Aureliasp. BMC Evol Biol. 2002; 2: 1–10. PMID:11801181
51. Castresana J. Selection of conserved blocks from multiple alignments for their use in phylogenetic anal-ysis. Mol Biol Evol. 2000; 17: 540–52. PMID:10742046
52. Guindon S, Dufayard J-F, Lefort V, Anisimova M, Hordijk W, Gascuel O. New algorithms and methods
to estimate maximum-likelihood phylogenies: assessing the performance of PhyML 3.0. Syst Biol. 59: 307–21. doi:10.1093/sysbio/syq010PMID:20525638
53. Darriba D, Taboada G, Doallo R, Posada D. jModelTest 2: more models, new heuristics and parallel
computing. Nat Methods. 2012; 9: 772.
54. Ronquist F, Teslenko M, van der Mark P, Ayres DL, Darling A, Höhna S, et al. MrBayes 3.2: efficient Bayesian phylogenetic inference and model choice across a large model space. Syst Biol. 2012; 61: 539–42. doi:10.1093/sysbio/sys029PMID:22357727
55. Bayha KM, Dawson MN, Collins AG, Barbeitos MS, Haddock SHD. Evolutionary relationships among scyphozoan jellyfish families based on complete taxon aampling and phylogenetic analyses of 18S and 28S ribosomal DNA. Integr Comp Biol. 2010; 50: 436–455. doi:10.1093/icb/icq074PMID:21558214
56. Rambaut A. FigTree v1. 3.1: Tree figure drawing tool. 2009.
57. Tamura K, Dudley J, Nei M, Kumar S. MEGA4: molecular evolutionary genetics analysis (MEGA) soft-ware version 4.0. Mol Biol Evol. 2007; 24: 1596–1599. PMID:17488738
58. Gouy M, Guindon S, Gascuel O. SeaView version 4: A multiplatform graphical user interface for
sequence alignment and phylogenetic tree building. Mol Biol Evol. 2010; 27: 221–224. doi:10.1093/ molbev/msp259PMID:19854763
59. Excoffier L, Lischer H. Arlequin suite ver 3.5: a new series of programs to perform population genetics
analyses under Linux and Windows. Mol Ecol Resour. 2010; 10: 564–567. doi:10.1111/j.1755-0998. 2010.02847.xPMID:21565059
60. Clement M, Posada D, Crandall K. TCS: a computer program to estimate gene genealogies. Mol Ecol.
2000; 9: 1657–1659. PMID:11050560
61. Greenberg N, Garthwaite RL, Potts DC. Allozyme and morphological evidence for a newly introduced species ofAureliain San Francisco Bay, California. Mar Biol. 1996; 125: 401–410.
62. Miyake H, Iwao K, Kakinuma Y. Life history and environment ofAurelia aurita. South Pacific Study. 1997; 17: 273–285.
63. Bolton TZ, Graham WM. Morphological variation among populations of an invasive jellyfish. Mar Ecol Prog Ser. 2004; 278: 125–139.
64. Lleonart J, Salat J, Torres GJ. Removing allometric effects of body size in morphological analysis. J
Theor Biol. 2000; 205: 85–93. PMID:10860702
65. Clarke K, Gorley R. PRIMER v6 PRIMER-E Ltd. Plymouth, UK. 2001
66. Dawson MN.Cyanea capillatais not a cosmopolitan jellyfish: morphological and molecular evidence for
C.annaskalaandC.rosea(Scyphozoa: Semaeostomeae: Cyaneidae) in south-eastern Australia. Invertebr Syst. 2005; 19: 361–370.
67. Kolbasova GD, Zalevsky AO, Gafurov AR, Gusev PO, Ezhova MA, Zheludkevich AA, et al. A new spe-cies ofCyaneajellyfish sympatric toC.capillatain the White Sea. Polar Biol. 2015; 38: 1439–1451.
68. Huang D, Meier R, Todd PA, Chou LM. Slow mitochondrial COI sequence evolution at the base of the
69. He J, Zheng L, Zhang W, Lin Y. Life cycle reversal inAureliasp.1 (Cnidaria, Scyphozoa). PLOS One. 2015; 10: e0145314. doi:10.1371/journal.pone.0145314PMID:26690755
70. Knowlton N, Weigt L. New dates and new rates for divergence across the Isthmus of Panama. Royal Soc Lon B: Biol Sci. 1998; 265: 2257–2263.
71. Peterson KJ, Lyons JB, Nowak KS, Takacs CM, Wargo MJ, McPeek MA. Estimating metazoan
diver-gence times with a molecular clock. Proc Natl Acad Sci. 2004 101: 6536–6541. PMID:15084738
72. Marko P. Fossil calibration of molecular clocks and the divergence times of geminate species pairs sep-arated by the Isthmus of Panama. Mol Biol Evol. 2002; 19: 2005–2021. PMID:12411609
73. Govindarajan A, Halanych K, Cunningham C. Mitochondrial evolution and phylogeography in the hydrozoanObelia geniculata(Cnidaria). Mar Biol. 2005; 146: 213–22.
74. Stopar K, Ramšak A, Trontelj P, Malej A. Lack of genetic structure in the jellyfishPelagia noctiluca
(Cni-daria: Scyphozoa: Semaeostomeae) across European seas. Mol Phylogenetics Evol 2010; 57: 417–
28.
75. Crispo E, Chapman L. Geographic variation in phenotypic plasticity in response to dissolved oxygen in an African cichlid fish. J Evol Biol. 2010; 23: 2091–103. doi:10.1111/j.1420-9101.2010.02069.xPMID: 20722894
76. Saint‐Laurent R, Legault M, Bernatchez L. Divergent selection maintains adaptive differentiation despite high gene flow between sympatric rainbow smelt ecotypes (Osmerus mordaxMitchill). Mol Ecol. 2003; 12: 315–30. PMID:12535084
77. Lind M, Ingvarsson P, Johansson H. Gene flow and selection on phenotypic plasticity in an island sys-tem ofRana temporaria. Evolution. 2011; 65: 684–697. doi:10.1111/j.1558-5646.2010.01122.xPMID: 20825480
78. Price T. The role of phenotypic plasticity in driving genetic evolution. Proc Royal Soc London B: Biol Sci. 2003; 270: 1433–1440.
79. Scheiner SM, Holt RD. The genetics of phenotypic plasticity. X. Variation versus uncertainty. Ecol Evol.
2012; 2: 751–767. doi:10.1002/ece3.217PMID:22837824
80. Roden C, Lohoefner RR, Rogers CM, Mullin K, Hoggard BW. Aspects of the ecology of the moon jelly-fish,Aurelia aurita, in the northern Gulf of Mexico. Northeast Gulf Sci. 1990; 11: 63–67.
81. Lucas CH, Lawes S. Sexual reproduction of the scyphomedusaAurelia auritain relation to temperature and variable food supply. Mar Biol. 1998; 131: 629–638.
82. Ishii H, Båmstedt U. Food regulation of growth and maturation in a natural population ofAurelia aurita. J Plankton Res. 1998; 20: 805–816.
83. Atkinson D. Temperature and organism size—a biological law for ectotherms? Adv Ecol Res. 1994;
25: 1–58.
84. Kingsolver JG, Huey RB. Size, temperature, and fitness: three rules. Evol Ecol Res. 2008; 10: 251–
268.
85. Stearns SC. The Evolution of Life Histories. Oxford Univ Press Oxford. 1992;
86. Roff DA. The Evolution of Life Histories. Theory and Analysis. Chapman Hall, New York. 2002; 87. Lucas CH. Population dynamics ofAurelia aurita(Scyphozoa) from an isolated brackish lake, with
par-ticular reference to sexual reproduction. J Plankton Res. 1996; 18: 987–1007.
88. Saucedo L. Fecundidad de la medusaStomolophus meleagris(Rhizostomeae: Stomolophidae) en el Golfo de California. Revista de Biología Tropical. 2012; 60: 1721–1729.
89. Ishii H, Takagi A. Development time of planulae larvae on the oral arms of the scyphomedusaAurelia aurita. J Plankton Res. 2003; 25: 1447–1450.
90. Le Rouzic A, Álvarez-Castro JM, Hansen TF. The Evolution of canalization and evolvability in stable and fluctuating environments. Evol Biol. 2013; 40: 317–340.
91. Crispo E. The Baldwin effect and genetic assimilation: revisiting two mechanisms of evolutionary change mediated by phenotypic plasticity. Evolution 2007; 61: 2469–2479. PMID:17714500
92. Gibson G, Wagner G. Canalization in evolutionary genetics: a stabilizing theory? BioEssays. 2000; 22:
372–380. PMID:10723034
93. Debat V, David P. Mapping phenotypes: canalization, plasticity and developmental stability. Trends
Ecol Evol. 2001; 16: 555–561.
94. Conover DO, Schultz ET. Phenotypic similarity and the evolutionary significance of countergradient variation. Trends Ecol Evol. 1995; 10: 248–252. doi:10.1016/S0169-5347(00)89081-3PMID:
95. Dawson MN, Martin DL. Geographic variation and ecological adaptation inAurelia aurita(Scyphozoa, Semaestomeae): some implications from molecular phylogenetics. Hydrobiologia. 2001; 451: 259–
273.