Gene Selection for Tumor Classification
Using Microarray Gene Expression Data
K. Yendrapalli, R. Basnet, S. Mukkamala, A. H. Sung Department of Computer Science
New Mexico Institute of Mining and Technology Socorro, New Mexico 87801, U.S.A. krish|ram|srinivas|[email protected]
Abstract – In this paper we perform a t-test for significant gene expression analysis in different dimensions based on molecular profiles from microarray data, and compare several computational intelligent techniques for classification accuracy on Leukemia, Lymphoma and Prostate cancer datasets of broad institute and Colon cancer dataset from Princeton gene expression project.
This paper also describes results concerning the robustness and generalization capabilities of kernel methods in classifying. We use traditional support vector machines (SVM), biased support vector machine (BSVM) and leave-one-out model selection for support vector machines (looms) for model selection. We also evaluate the impact of kernel type and parameter values on the accuracy of a support vector machine (SVM) performing tumor classification. Through a variety of comparative experiments, it is found that SVM performs the best for detecting Leukemia and Lymphoma, BSVM performs the best for Colon and Prostate cancers.
We show that classification accuracy varies with the kernel type and the parameter values; thus, with appropriately chosen parameter values, tumors can be classified by kernel machines with higher accuracy and lower false alarms. Our results demonstrate the potential of using learning machines in diagnosis of the malignancy of a tumor.
Index Terms
—
Gene selection, Tumor classification,Kernel machines, Support vector machines
I. INTRODUCTION
hough most cells in our bodies contain the same genes, not all of the genes are used in each cell. Some genes are turned on, or “expressed” when needed. Many genes are used to specify features unique to each type of cell. Microarray technology looks at many genes at once and determines which are expressed in a particular cell type. Using DNA microarray analysis thousands of individual genes can be spotted on a single square inch slide. DNA targets are arrayed onto glass slides (or membranes) and explored with fluorescent or radioactively labeled probes [1]. Obtaining genome-wide expression data from cancerous tissues gives insight into the gene expression variation of various tumor types, thus providing clues for cancer classification of individual samples. One of the key challenges of microarray studies is to derive biological insights from the unprecedented quantities of data on gene
expression patterns. Partitioning genes into closely related groups has become an element of practically all analyses of microarray data [2]. But identification of genes faces with many challenges. The main challenge is the overwhelming number of genes compared to the smaller number of available training samples. In machine learning terminology, these data sets have high dimension and small sample size. And many of these genes are irrelevant to the distinction of samples. These irrelevant genes have negative effect on the accuracies of the classifier. Another challenge is that DNA array data contain technical and biological noise. Thus, it is critical to identify a subset of informative genes from a large data that will give higher classification accuracy.
Many methods have been proposed in the past to reduce the dimensionality of gene expression data [3]. Several machine learning techniques have been successfully applied to cancer classification using microarray data [4]. One of the early methods is a hierarchical algorithm developed by Eisen et al. [5]. Other popular algorithms, such as neural networks, K-Nearest Neighbor (KNN), support vector machines, kernel based classifiers, genetic algorithms and Self-Organizing Maps (SOM) are widely applied for tumor classification [3, 6].
Although several groups have extensively considered model selection in SVMs, optimal parameters are usually domain specific. In this paper, we present a methodology to evaluate the impact of model selection (kernel types and parameter values) on the performance of different SVM implementations to classify tumors.
The problem of multiclass classification, especially for systems like SVMs, doesn’t present an easy solution. It is generally simpler to construct classifier theory and algorithms for two mutually-exclusive classes than for N mutually-mutually-exclusive classes. In this paper, we use BSVM that constructs N-class SVMs [7,8]. Most existing approaches for model selection use the leave-one-out (loo) related estimators which are considered computationally expensive. In this paper, we use Leave-one-out model selection for support vector machines (looms) that uses advance numerical methods which lead to
efficient calculation of loo rates of different models [9].
II. GENE EXPRESSION DATA SELECTION For a given classifier and a training set, the optimality of a gene identification algorithm can be ensured by an exhaustive search over all possible gene subsets. For a data set with n genes, there are 2n gene subsets. Due to the high dimension of microarrays data, it is impractical to search whole space exhaustively. In our experiments, we choose the significant data based on Student’s t-test.
Student’s t-test deals with the problems associated with inference based on “small” samples. The unpaired t method tests the null hypothesis that the population means related to two independent, random samples from an approximately normal distribution are equal [11].
Under the assumption of equal underlying population means, if t < 0, “P(T <= t) one-tail” gives the probability that a value of the t-Statistic would be observed that is more negative than t. If t >=0, “P(T <= t) one-tail” gives the probability that a value of the t-Statistic would be observed that is more positive than t. “t Critical one-tail” gives the cutoff value so that the probability of observing a value of the t-Statistic greater than or equal to “t Critical one-tail” is Alpha.
“P(T <= t) two-tail” gives the probability that a value of the t-Statistic would be observed that is larger in absolute value than t. “P Critical two-tail” gives the cutoff value so that the probability of an observed t-Statistic larger in absolute value than “P Critical two-tail” is Alpha.
1 2 2 2 1 2 1 2 X X d s s n n − = +
(1)
(
) (
)
2 2 2 1 2 1 2 2 2 2 21 1 2 2
1 2 / / 1 1 s s n n df
s n s n
n n + = + − − ⎡ ⎤ ⎢ ⎥
⎣ ⎦
(2)
III. DATA USED for EXPERIMENTS
Leukemia, Lymphoma and Prostate cancer data sets are obtained from broad institute [12]. Colon cancer data set is obtained from Princeton gene expression project [13]. Significant gene data obtained from t-test is used for measuring the performance of the classifiers. Fifty percent of the data is used for training and the rest is used for testing. Leukemia data set has (37 training samples and 38 testing samples). Lymphoma data set has (40 training samples and 39 testing samples). Prostate data set has (52 training samples and 52 testing samples). Colon data set has (32 training samples and 32 testing samples).
Data sets used in our experiments.
¾ Leukemia data set comes from a study of gene expression in two types of acute Leukemia: 48 acute lymphoblastic Leukemia (ALL) samples and 25 acute myeloblastic Leukemia (AML) samples. It was studied in [14].
¾ Lymphoma data set consists of 58 diffuse large B-cell lymphoma (DLBCL) samples and 19 follicular lymphoma (FL) samples. It was studied in [15]. The data file, lymphoma_8_lbc_fscc2_rn.res, and the class label file, lymphoma_8_lbc_fscc2.cls are used in our experiments for identifying DLBCL and FL. ¾ Prostate data set in [16] contains 52 prostate
tumor samples and 50 non-tumor prostate samples.
¾ The Colon data set in [17] consists of 40 tumor and 22 normal colon tissues.
Fig.1. Significant features for leukemia
Fig.2. Significant features for colon
Fig.3. Significant features for lymphoma
IV. MODEL SELECTION (SVMs)
In any predictive learning, such as classification, both a model and a parameter estimation method should be selected in order to achieve a high level of performance. Recent approaches allow a wide class of models of varying complexity to be chosen. Then the task of learning amounts to selecting the sought-after model of optimal complexity and estimating parameters from training data [8,9].
Within the SVMs approach, usually parameters to be chosen are (i) the penalty term C which determines the trade-off between the complexity of the decision function and the number of training examples misclassified; (ii) the mapping function Φ; and (iii) the kernel function such that
) ( ) ( ) ,
( i j i j
K x x =Φx ⋅Φx . In the case of RBF kernel, the
width, which implicitly defines the high dimensional feature space, is the other parameter to be selected.
We performed a grid search using 5-fold cross validation for each of the faults in our data set. We achieved the search of parameters C and γ in a coarse scale. Model selection results obtained through grid search using LIBSVM is given in figures 5-8.
Fig.5. SVM model for leukemia
Fig.6. SVM model for colon
Fig.7. SVM model for lymphoma
Fig.8. SVM model for prostate
Within the SVMs approach, usually parameters to be chosen are (i) the penalty term C which determines the trade-off between the complexity of the decision function and the number of training examples misclassified; (ii) the mapping function Φ; and (iii) the kernel function such that
) ( ) ( ) ,
( i j i j
K x x =Φx ⋅Φx . In the case of RBF kernel, the
width, which implicitly defines the high dimensional feature space, is the other parameter to be selected [10].
We performed a grid search using 10-fold cross validation for each of the five faults in our data set. First, we achieved the search of parameters C and γ in a coarse scale and then we carried through a fine tuning into the five detection faults proper space. Model selection results obtained through grid search are given in figures 5 to 8 Leukemia, Colon, Lymphoma, and Prostate data sets, respectively.
Fig.9. Looms model for leukemia
Fig.10. Looms model for colon
Fig.11. Looms model for lymphoma
Fig.12. Looms model for prostate
Models generated for tumor data using leave-one-out model for support vector machines (looms) are given in figures 9 to 12.
VI. ROC CURVES
The Receiver Operating Characteristic (ROC) curves are generated by considering the rate at which true positives accumulate versus the rate at which false positives accumulate with each one corresponding,
respectively, to the vertical axis and the horizontal axis in Figures 13 to 16.
The point (0,1) is the perfect classifier, since it classifies all positive cases and negative cases correctly. Thus an ideal system will initiate by identifying all the positive examples and so the curve will rise to (0,1) immediately, having a zero rate of false positives, and then continue along to (1,1).
Fig.13. Classification accuracy for leukemia
Fig.14 Classification accuracy for colon
Fig.15. Classification accuracy for lymphoma
Detection rates and false alarms are evaluated for tumor datasets described in section 3 and the obtained results are used to form the ROC curves. Figures 13 to 16 show the ROC curves of the classification models by malignancy categories as well as on all normal samples. In each of these ROC plots, the x-axis is the false alarm rate, calculated as the percentage of normal considered as tumor; the y-axis is the classification rate, calculated as the percentage of tumors. A data point in the upper left corner corresponds to optimal high performance, i.e, high classification rate with low false alarm rate. Interestingly 100% classification accuracy is achieved on leukemia dataset.
VII. CLASSIFIER PERFORMANCE
We applied SVMs, BSVMs, and LOOMs to Leukemia (6,27,53), Lymphoma (7,28,55), Colon (7,15,27,54) and Prostate (6,26,52) cancer data sets, for detecting malignancy of a tumor with different data dimensionalities given in the parenthesis. Classification accuracies are summarized in table 1.
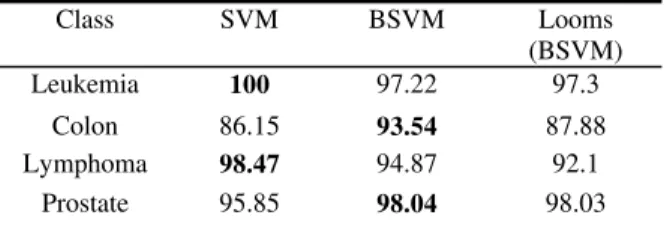
Table 1. Classification accuracies (%) of different kernel methods
Class SVM BSVM Looms
(BSVM)
Leukemia 100 97.22 97.3
Colon 86.15 93.54 87.88
Lymphoma 98.47 94.87 92.1
Prostate 95.85 98.04 98.03
VIII. SUMMARY & FUTURE WORK Although the performance of the three methods used is comparable in all datasets, we found that SVMs performs the best on Leukemia, Lymphoma; and BSVMs performs the best on Colon and Prostate.
The classifiers used in this paper showed comparable or better performance in some cases when compared to the ones reported [artificial neural networks, and clustering, etc] in the literature using the same datasets. Our results demonstrate the potential of using learning machines in diagnosis of malignancy of a tumor. As a future work we plan to use large datasets of patients. As more inputs are added, feature selection will have to follow a more stringent scrutiny.
REFERENCES
[1] P. Brown, D. Botstein, “Exploring the New World of the Genome with DNA Microarrays”, Nature Genetics Supplement, Vol. 21, pp. 33-37, 1999.
[2] J. Quackenbush, “Computational Analysis of Microarray Data”, Nature Rev. Genteics, Vol. 2, pp. 418-427, 2001.
[3] S. Dudoit, J. Fridlyand, T. Speed, “Comparison of Discrimination Methods for the Classification of Tumors Using Gene Expression Data”, J. Am. Statistical Assoc., Vol. 97, pp. 77-87, 2002.
[4] C. Peterson, M. Ringner, “Analysis Tumor Gene Expression Profiles”, Artificial Intelligence in Medicine, Vol. 28, no. 1, pp. 59-74, 2003.
[5] M. Eisen, P. Spellman, P. Brown, D. Botstein, “Cluster Analysis and Display of Genome-Wide Expression Patterns”, Proc. Nat’l Acad. Sci. USA, Vol. 95, pp. 14863-14868, 1998. [6] P. Tamyo et al. “Interpreting Patterns of Gene
Expression with Self-Organizing Maps: Methods and Application to Hematopoietic Differentiation”, Proc. Nat’l Acad. Sci. USA, Vol. 96, pp. 2907-2912, 1999.
[7] Cherkassy, V: Model complexity control and statistical learning theory. Journal of natural computing 1: (2002) 109–133
[8] V. Cherkassy, “Model complexity control and statistical learning theory”, Journal of natural computing 1: (2002) 109–133.
[9] N. Cristianini, J. S. Taylor, “Support Vector Machines and Other Kernel-based Learning Algorithms”, Cambridge, UK: Cambridge University Press, 2000.
[10] C. C. Chang, C. J. Lin, “LIBSVM: a library for support vector machines”, Department of Computer Science and Information Engineering, National Taiwan University, 2001. [11] P. Armitage, G. Berry, Statistical Methods in
Medical Research, Blackwell 1994.
[12] http://www.broad.mit.edu/
[13] http://microarray.princetion.edu/oncology
[14] T. Golub et al., “Molecular Classification of Cancer: Class Discovery and Class Prediction by Gene Expression”, Science, Vol. 286, pp. 531-537, 1999.
[15] M. Shipp et al., “Diffuse Large B-Cell Lymphoma Outcome Prediction by Gene Expression Profiling and Supervised Machine Learning”,
[16] D. Singh et al., “Gene Expression Correlates of Clinical Prostate Cancer Behavior”, Cancer Cell, Vol. 1, no. 2, pp. 227-235, 2002.
[17] U. Alon et al., “Broad Patterns of Gene Expression Revealed by Clustering Analysis of