BGD
7, 4801–4855, 2010Upscaling ecosystem C fluxes for the Iberian Peninsula
N. Carvalhais et al.
Title Page
Abstract Introduction
Conclusions References
Tables Figures
◭ ◮
◭ ◮
Back Close
Full Screen / Esc
Printer-friendly Version Interactive Discussion
Discussion
P
a
per
|
Dis
cussion
P
a
per
|
Discussion
P
a
per
|
Discussio
n
P
a
per
|
Biogeosciences Discuss., 7, 4801–4855, 2010 www.biogeosciences-discuss.net/7/4801/2010/ doi:10.5194/bgd-7-4801-2010
© Author(s) 2010. CC Attribution 3.0 License.
Biogeosciences Discussions
This discussion paper is/has been under review for the journal Biogeosciences (BG). Please refer to the corresponding final paper in BG if available.
Deciphering the components of regional
net ecosystem fluxes following
a bottom-up approach for the
Iberian Peninsula
N. Carvalhais1,2, M. Reichstein2, G. J. Collatz3, M. D. Mahecha2, M. Migliavacca4, C. S. Neigh3,5, E. Tomelleri2, A. A. Benali1, D. Papale6, and J. Seixas1
1
Departamento de Ci ˆencias e Engenharia do Ambiente, DCEA, Faculdade de Ci ˆencias e Tecnologia, FCT, Universidade Nova de Lisboa, 2829-516 Caparica, Portugal
2
Max-Planck-Institut f ¨ur Biogeochemie, P.O. Box 10 01 64, 07701 Jena, Germany 3
NASA Goddard Space Flight Center, Greenbelt, Code 614.4, Greenbelt, MD 20771, USA 4
Remote Sensing of Environmental Dynamics Laboratory, DISAT, University of Milano-Bicocca, Milano, Italy
5
BGD
7, 4801–4855, 2010Upscaling ecosystem C fluxes for the Iberian Peninsula
N. Carvalhais et al.
Title Page
Abstract Introduction
Conclusions References
Tables Figures
◭ ◮
◭ ◮
Back Close
Full Screen / Esc
Printer-friendly Version Interactive Discussion
Discussion
P
a
per
|
Dis
cussion
P
a
per
|
Discussion
P
a
per
|
Discussio
n
P
a
per
|
6
Dipartimento di Scienze dell’Ambiente Forestale e delle sue Risorse, DISAFRI, Universit ´a degli Studi della Tuscia, Via Camillo de Lellis, snc – 01100, Viterbo, Italy
Received: 8 March 2010 – Accepted: 28 May 2010 – Published: 22 June 2010 Correspondence to: N. Carvalhais ([email protected])
BGD
7, 4801–4855, 2010Upscaling ecosystem C fluxes for the Iberian Peninsula
N. Carvalhais et al.
Title Page
Abstract Introduction
Conclusions References
Tables Figures
◭ ◮
◭ ◮
Back Close
Full Screen / Esc
Printer-friendly Version Interactive Discussion
Discussion
P
a
per
|
Dis
cussion
P
a
per
|
Discussion
P
a
per
|
Discussio
n
P
a
per
|
Abstract
Quantification of ecosystem carbon pools is a fundamental requirement for estimating carbon fluxes and for addressing the dynamics and responses of the terrestrial car-bon cycle to environmental drivers. The initial estimates of carcar-bon pools in terrestrial carbon cycle models often rely on the ecosystem steady state assumption, leading to
5
initial equilibrium conditions. In this study, we investigate how trends and inter-annual variability of net ecosystem fluxes are affected by initial non-steady state conditions. Further, we examine how modeled ecosystem responses induced exclusively by the model drivers can be separated from the initial conditions. For this, the Carnegie-Ames-Stanford Approach (CASA) model is optimized at set of European eddy
covari-10
ance sites, which support the parameterization of regional simulations of ecosystem fluxes for the Iberian Peninsula, between 1982 and 2006.
The presented analysis stands on a credible model performance for a set of sites, that well represent the plant functional types and selected descriptors of climate and phenology present in the Iberian region – except for a limited northwestern area. The
15
effects of initial conditions on inter-annual variability and on trends, results mostly from the recovery of pools to equilibrium conditions; which control most of the inter-annual variability (IAV) and both the magnitude and sign of most of the trends. However, by removing the time series of pure model recovery from the time series of the overall fluxes, we are able to retrieve estimates of inter-annual variability and trends in net
20
ecosystem fluxes that are quasi-independent from the initial conditions. This approach reduced the sensitivity of the net fluxes to initial conditions from 47% and 174% to−3% and 7%, for strong initial sink and source conditions, respectively.
With the aim to identify and improve understanding of the component fluxes that drive the observed trends, the net ecosystem production (NEP) trends are decomposed into
25
BGD
7, 4801–4855, 2010Upscaling ecosystem C fluxes for the Iberian Peninsula
N. Carvalhais et al.
Title Page
Abstract Introduction
Conclusions References
Tables Figures
◭ ◮
◭ ◮
Back Close
Full Screen / Esc
Printer-friendly Version Interactive Discussion
Discussion
P
a
per
|
Dis
cussion
P
a
per
|
Discussion
P
a
per
|
Discussio
n
P
a
per
|
Analogously, ∼83% of the negative trends in NEP are also associated with negative trends in NPP. The spatial patterns of NPP trends are mainly explained by the trends in fAPAR (r=0.79) and are only marginally explained by trends in temperature and water stress scalars (r=0.10 andr=0.25, respectively). Further, we observe the significant role of substrate availability (r=0.25) and temperature (r=0.23) in explaining the spatial
5
patterns of trends in RH. These results highlight the role of primary production in driving ecosystem fluxes.
Overall, our study illustrates an approach for removing the confounding effects of initial conditions and emphasizes the need to decompose the ecosystem fluxes into its components and drivers for more mechanistic interpretations of modeling results.
10
We expect that our results are not only specific for the CASA model since it incorpo-rates concepts of ecosystem functioning and modeling assumptions common to bio-geochemical models. A direct implication of these results is the ability of this approach to detect climate and phenology induced trends regardless of the initial conditions.
1 Introduction 15
The quantification of terrestrial net ecosystem fluxes is of significant importance to the understanding of the global carbon cycle (e.g., Heimann and Reichstein, 2008) and has been the subject of active research (e.g., Ciais et al., 2000; Piao et al., 2009b). In this regard, model-data synthesis approaches have focused on the improvement of ecosystem flux estimates through model structure development (e.g., Richardson et al.,
20
2006), estimation of parameters (e.g., Knorr and Kattge, 2005) and initial conditions (e.g., Braswell et al., 2005; Carvalhais et al., 2008), adjustments in state variables (e.g., Jones et al., 2004) and sensitivity to forcing variables (e.g., Abramowitz et al., 2008). The wide assessment of uncertainties in the different modeling components can further be integrated in bottom-up approaches and should be a robust indicator of
25
BGD
7, 4801–4855, 2010Upscaling ecosystem C fluxes for the Iberian Peninsula
N. Carvalhais et al.
Title Page
Abstract Introduction
Conclusions References
Tables Figures
◭ ◮
◭ ◮
Back Close
Full Screen / Esc
Printer-friendly Version Interactive Discussion
Discussion
P
a
per
|
Dis
cussion
P
a
per
|
Discussion
P
a
per
|
Discussio
n
P
a
per
|
of different models in ensemble approaches establishes the boundaries of prognostic scenarios for future climate conditions (e.g., Sitch et al., 2008).
In process-based biogeochemical modeling the estimation of carbon fluxes is de-pendent on the magnitude of prior ecosystem carbon pools. The initial estimates of ecosystem pools are usually prescribed by long initialization routines that drive models
5
to equilibrium between C uptake and efflux from the ecosystem (e.g., Morales et al., 2005; Thornton et al., 2002). These routines, also called spin-up runs, rely on con-secutive model iterations for periods varying from hundreds to thousands of years of simulations with average climate datasets (Thornton and Rosenbloom, 2005). More sophisticated approaches include additional transient runs in which model drivers
em-10
body the trajectories of land cover change, climate and atmospheric CO2 concentra-tions since the beginning of the industrial revolution until present (Hurtt et al., 2002; McGuire et al., 2001; Zaehle et al., 2007) or incorporate post disturbance recovery dy-namics (Masek and Collatz, 2006). But, ecosystem carbon pools are rarely initialized at non-steady state conditions for regional or larger scale simulations. In general, data
15
availability is sparse and there is reluctance to constrain models with datasets that are not harmonized with the spatial resolution of models or to match conceptual carbon pools of models with in situ measurements (e.g. regarding soil carbon pools, Trum-bore, 2006). For bottom-up approaches, site level evaluations help develop confidence in model structure and model parameters. However, the dependence of ecosystem
20
pools on site history of past climate, management and disturbance regimes hampers our ability to regionalize the initial conditions of carbon pools. Consequently there is a certain degree of arbitrariness in the initial estimates of ecosystem carbon pools which contributes to additional uncertainties to net ecosystem fluxes estimates.
The response of net ecosystem production (NEP) to climate variability is a result of
25
BGD
7, 4801–4855, 2010Upscaling ecosystem C fluxes for the Iberian Peninsula
N. Carvalhais et al.
Title Page
Abstract Introduction
Conclusions References
Tables Figures
◭ ◮
◭ ◮
Back Close
Full Screen / Esc
Printer-friendly Version Interactive Discussion
Discussion
P
a
per
|
Dis
cussion
P
a
per
|
Discussion
P
a
per
|
Discussio
n
P
a
per
|
directly associated with changes in temperature or water availability conditions follow-ing mechanistic reasonfollow-ing (e.g., Haxeltine and Prentice, 1996). Analogously, changes in temperature (Rey and Jarvis, 2006) and soil moisture (Orchard and Cook, 1983) have been shown to drive changes in heterotrophic respiration (RH) patterns. Un-derstanding how these component fluxes respond to climate conditions provides the
5
mechanistic understanding of NEP variability.
Here, we follow a bottom-up approach to investigate the role of initial conditions on temporal trends and inter-annual variability in net ecosystem fluxes during a time span of 25 years for the Iberian Peninsula (IP). Ecosystem fluxes are estimated using the Carnegie Ames Stanford Approach (CASA) biogeochemical model (Potter et al.,
10
1993). NPP is estimated independently from vegetation pools (Monteith, 1972) and the effect of initial conditions on the ecosystem fluxes can be explored solely through the soil carbon pools (Carvalhais et al., 2008). The modeled time series of ecosys-tem fluxes are consequently a function of the assumptions about the initial conditions and the climate and phenology drivers. Here, we examine how modeled ecosystem
15
responses exclusively induced by the model drivers can be independent from the ini-tial conditions. We follow a mechanistic approach to remove the dynamics of recovery from non-equilibrium to explore the differences in driver induced trends for different initial conditions. Further, we decompose NEP into NPP and RH fluxes to evaluate the sensitivity of regional ecosystem fluxes to the model drivers. The optimized
mod-20
eled fluxes are then upscaled according to the plant functional type and phenology and climate regimes to the entire Iberian Peninsula.
2 Materials and methods
2.1 Eddy flux sites and data
The European network of eddy-covariance measurements sites from the
Carboeu-25
BGD
7, 4801–4855, 2010Upscaling ecosystem C fluxes for the Iberian Peninsula
N. Carvalhais et al.
Title Page
Abstract Introduction
Conclusions References
Tables Figures
◭ ◮
◭ ◮
Back Close
Full Screen / Esc
Printer-friendly Version Interactive Discussion
Discussion
P
a
per
|
Dis
cussion
P
a
per
|
Discussion
P
a
per
|
Discussio
n
P
a
per
|
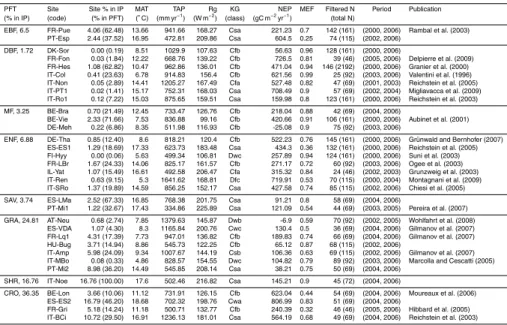
carboeurope.org) and has been supporting broad research on processes of mass and energy transfer at the ecosystem level (Aubinet et al., 2000) throughout different veg-etation types (Ciais et al., 2009; Luyssaert et al., 2009). Here, we rely on a selection of 33 sites that includes a significant diversity of ecosystems representing a signifi-cant range of climate regimes and net ecosystem flux magnitudes (Table 1). These
5
sites were selected based on: 1) the possibility to represent ecosystems present in the Iberian Peninsula, but that are not necessarily located in this region; 2) a minimum data availability of bi-weekly flux integrals with more than 80% of the half-hourly original data or after gap-filling with high confidence Reichstein et al. (Category A in 2005). In situ measurements of climate variables and MODIS remotely sensed normalized difference
10
vegetation index (NDVI, Huete et al., 2002) were used to drive site level simulations in the inverse model optimization.
2.2 The CASA model
CASA is a process-based biogeochemical model that estimates net ecosystem pro-duction (NEP) fluxes as the difference between NPP and RH(Field et al., 1995; Potter
15
et al., 1993). The estimates of NPP follow the radiation use efficiency approach of Monteith (1972):
NPP=fAPAR·PAR·ε, (1)
where fAPAR is the fraction of photosynthetically active radiation absorbed by vege-tation; PAR is the amount of photosynthetically active radiation; andεis the light use
20
efficiency, which is calculated by down-regulating maximum light use efficiency (ε∗ ) via the effect of temperature and water availability stress factors (TεandWε, respectively):
ε=ε∗
·Tε·Wε. (2)
For consistency in the bottom-up approach between site level and regional simula-tions we estimated fAPAR from NDVI according to Los et al. (2000) and leaf area index
25
BGD
7, 4801–4855, 2010Upscaling ecosystem C fluxes for the Iberian Peninsula
N. Carvalhais et al.
Title Page
Abstract Introduction
Conclusions References
Tables Figures
◭ ◮
◭ ◮
Back Close
Full Screen / Esc
Printer-friendly Version Interactive Discussion
Discussion
P
a
per
|
Dis
cussion
P
a
per
|
Discussion
P
a
per
|
Discussio
n
P
a
per
|
partitioned between the different vegetation pools according to the dynamic allocation scheme of Friedlingstein et al. (1999). Carbon is then transferred from living vege-tation pools to soil level pools through leaf litter fall, root and wood mortality (Potter et al., 1993; Randerson et al., 1996). The cycling of carbon between the different soil C pools follows a simplified version of the CENTURY model (Parton et al., 1987). RH
5
is estimated as the integral of decomposition from the different soil C pools:
RH=
P
X
i=1
Ci·ki·Ws·Ts·(1−Mε), (3)
where each pooli is characterized by a different turnover rate ki that is regulated by the effect of temperature (Ts) and water availability conditions (Ws) (Potter et al., 1993). The carbon content of each pool (Ci) results from the integrated transfers between
10
the different pools, which is further regulated by the carbon assimilation efficiency of microbes (Mε). In general, the robustness of the CASA model has been corroborated
by its wide application in studies that range from ecosystem to global scales (e.g., Carvalhais et al., 2008; Randerson et al., 2002) and that focus on different ecological and biogeochemical issues (e.g., Potter et al., 2001; van der Werf et al., 2003).
15
2.3 Inverse model parameter optimization
The optimized parameters in the CASA model are responsible for governing the re-sponses of NPP and RH to environmental conditions (temperature and water avail-ability) and maximum energy mass conversion rates (maximum light use efficiency, Monteith, 1972; Potter et al., 1993). In addition, a parameter is introduced that
ad-20
justs the initial conditions of microbial and more recalcitrant C pools after the spin-up routines –η– and regulates the ecosystem’s initial distance to equilibrium (Carvalhais et al., 2008). This relaxation of the steady state assumption gives a structural flexi-bility to the model that was shown to reduce parameter uncertainties and biases from wrong structural model assumptions (Carvalhais et al., 2008). Additional
disequilib-25
BGD
7, 4801–4855, 2010Upscaling ecosystem C fluxes for the Iberian Peninsula
N. Carvalhais et al.
Title Page
Abstract Introduction
Conclusions References
Tables Figures
◭ ◮
◭ ◮
Back Close
Full Screen / Esc
Printer-friendly Version Interactive Discussion
Discussion
P
a
per
|
Dis
cussion
P
a
per
|
Discussion
P
a
per
|
Discussio
n
P
a
per
|
gross primary production and autotrophic respiration (RA) and indirectly heterotrophic respiration fluxes (through transfer of carbon from vegetation to soil reservoirs) (e.g., Nabuurs et al., 2004). CASA relies on the implicit calculations of autotrophic respira-tion as a fixed fracrespira-tion of NPP, and estimates of NPP rely on inputs of fAPAR (Potter et al., 1993), which minimizes the impacts of nonequilibrium conditions of vegetation
5
on NPP. These implicit treatments of RA do not degrade the CASA model’s ability to simulate net ecosystem fluxes (Carvalhais et al., 2010). The model performance is also not different between an exclusive consideration of nonequilibrium conditions in soil versus soil and vegetation carbon pools, revealing thatηcould compensate for the indirect effects of nonequilibrium conditions in RH(Carvalhais et al., 2010). Given the
10
amenability of both representations and the straightforward treatment ofη in the cur-rent exercise we opted to solely consider nonequilibrium in soil level carbon pools. The parameter optimization method consisted on the minimization of the sum of residual squares between eddy-covariance measurements and model estimates of biweekly NEP fluxes using the Levenberg–Marquardt algorithm (Draper and Smith, 1981).
15
2.4 Upscaling of model parameters
The upscaling of model parameters aims at attributing parameter vectors optimized at site level, on a per-pixel basis, to the whole Iberian Peninsula. The conceptual idea here is that, within an ecosystem type or plant functional type (PFT), each pixel p
in the map would be treated according its similarity with eddy covariance site j, and
20
parameterized accordingly. The assignment of a parameter vector to a given pixelp
is supported by a nearest neighborhood classification of the climatic and phenological conditions: to a given pixelp, the parameter vectorS corresponding to sitej (Sj) is
applied when the climate and phenological characteristics ofpare closer toj’s than to any other site’s from the same PFT. So,Sp=Sj whend
∗
p,j=argminj=1,...,N(dp,j) finds the
25
minimum distances between climate and phenological characteristics between a pixel
BGD
7, 4801–4855, 2010Upscaling ecosystem C fluxes for the Iberian Peninsula
N. Carvalhais et al.
Title Page
Abstract Introduction
Conclusions References
Tables Figures
◭ ◮
◭ ◮
Back Close
Full Screen / Esc
Printer-friendly Version Interactive Discussion
Discussion
P
a
per
|
Dis
cussion
P
a
per
|
Discussion
P
a
per
|
Discussio
n
P
a
per
|
precipitation and solar radiation for the period 1960 to1990; and mean NDVI between 1982 and 2005. NS is the Nash–Sutcliffe coefficient:
NS(Vp,Vj)=1−
PN
i=1(Vp,i−Vj,i)
2
PN
i=1(Vp,i−Vp)2
, (4)
which quantifies the relative association between two vectors relative to the associa-tion between the reference vector and its mean (the nominal situaassocia-tion) (Janssen and
5
Heuberger, 1995; Nash and Sutcliffe, 1970), where N is the length of the vectorsVp
andVp(N=96) andi the column index of these vectors. In addition to providing a
mea-sure of association, the NS also meamea-sures the agreement between two vectors (prox-imity to the 1 : 1 line). Consequently, the climatic-phenological distance measure (from here on identified as CPd) reflects both the proximity in the magnitude and
seasonal-10
ity of climate and phenology drivers between site level observations and the regional datasets for the IP. The results associate one site of each PFT per pixel which means that if a given PFT is present in that pixel the respective parameter vector corresponds to the site where the climate and phenological characteristics are closer to the pixel’s.
2.5 Data for spatial runs 15
Due to the diagnostic nature of CASA, the temporal extent of the model runs for the Iberian Peninsula was bounded by the longest remotely sensed NDVI record avail-able: the Global Inventory Modelling and Mapping Studies (GIMMS) NDVI (Tucker et al., 2005). The option of using the biweekly MODIS NDVI products (2 by 2 win-dow of 250 m×250 m pixels) for site level evaluation of the model and the GIMMS NDVI
20
datasets (8 km×8 km pixels) for the regional runs was based on two assumptions: 1) the eddy-covariance footprint depends on the local conditions (Gockede et al., 2008) and height of the tower (Barcza et al., 2009) but generally is not larger than 1 km2, making the 8 km by 8 km areas too large for representation of the eddy-covariance data; and 2) the MODIS and GIMMS NDVI products are comparable (Tucker et al.,
BGD
7, 4801–4855, 2010Upscaling ecosystem C fluxes for the Iberian Peninsula
N. Carvalhais et al.
Title Page
Abstract Introduction
Conclusions References
Tables Figures
◭ ◮
◭ ◮
Back Close
Full Screen / Esc
Printer-friendly Version Interactive Discussion
Discussion
P
a
per
|
Dis
cussion
P
a
per
|
Discussion
P
a
per
|
Discussio
n
P
a
per
|
2005). Monthly climate datasets – air temperature, precipitation and solar radiation – at 10’ spatial resolution since 1901 until 2000 are available from the Climate Re-search Unit of the University of East Anglia (Mitchell et al., 2004). The climate datasets were extended until 2006 using pixel level empirical relationships with coarser climate datasets. For temperature and solar radiation we made use of 0.25 degrees datasets
5
from the Global Land Data Assimilation System (Rodell et al., 2004). Precipitation was extended using 0.5 degrees datasets from the University of Delaware (Matsuura and Willmott, 2007). Every dataset was spatially interpolated to the GIMMS NDVI 8 km by 8 km grid following Zhao et al. (2005). We used linear interpolation to downscale from monthly to biweekly periods. The soil properties – texture fractions and soil depth –
10
were obtained from the Soil Map of the European Communities (The Commission of the European Communities Directorate General for Agriculture, Coordination of Agri-cultural Research, 1985). The proportion of each PFT within every 8 km by 8 km pixel is defined by the CORINE land cover map (Bossard et al., 2000). The fraction of forest PFTs is defined by the tree cover value of the MODIS vegetation continuous fields at
15
1 km (Hansen et al., 2003) bounded by the class intervals defined in each CORINE class.
2.6 Regional model runs for a range of initial conditions
The CASA model estimates of ecosystem fluxes for the Iberian Peninsula are per-formed on a PFT basis: the parameter vector used per pixel per PFT originates from
20
the upscaling exercise above. The ecosystem fluxes per pixel p (e.g. NEPp) are esti-mated by integrating all the individual PFT estimates (e.g. NEPp,PFT) weighted by the fraction of each PFT inside that pixel p fPFTp):
NEPp=
n
X
PFT=1
fPFTp·NEPp,PFT. (5)
for each PFT the model is always spun up with a mean yearly dataset until steady state
25
BGD
7, 4801–4855, 2010Upscaling ecosystem C fluxes for the Iberian Peninsula
N. Carvalhais et al.
Title Page
Abstract Introduction
Conclusions References
Tables Figures
◭ ◮
◭ ◮
Back Close
Full Screen / Esc
Printer-friendly Version Interactive Discussion
Discussion
P
a
per
|
Dis
cussion
P
a
per
|
Discussion
P
a
per
|
Discussio
n
P
a
per
|
microbial soil carbon pools. The prescription of different distances to equilibrium is obtained by multiplying these pools by the scalarηafter the spin-up and then running the model forward. We create a range of initial conditions, from significant sinks (η≪1) to sources (η≫1) by changing theη values between 0.01 and 2 (in 0.1 increments). The ensemble of runs obtained allows evaluating the impacts of different distances to
5
equilibrium in the inter-annual variability and temporal trends in net ecosystem fluxes.
2.7 Decoupling the drivers effects on ecosystem fluxes from the initial conditions
It is recognized that the steady state estimates of the soil carbon pools are a function of the model parameterization and environmental drivers prescribed for the spin-up
10
(Andr ´en and K ¨atterer, 1997). Hence, for the same model parameterization and drivers, any prescribed distance of the soil C pools to equilibrium (η) yields a dynamic re-covery response towards equilibrium with the simulation drivers. The rere-covery from a prescribed η can yield conditions different from the steady state as a response to the simulation’s climate and/or phenology time series. It is essential to distinguish or
15
isolate the effects of the drivers from the recovery dynamics on the ecosystem fluxes. Here, we opted for removing the recovery dynamics by performing parallel model runs with constant drivers. In these runs the climate and phenology drivers were identical to the spin-up runs datasets: the mean year of the complete 25 year time series. Further, we prescribed the exact same parameterization andηscalars used in the regular
for-20
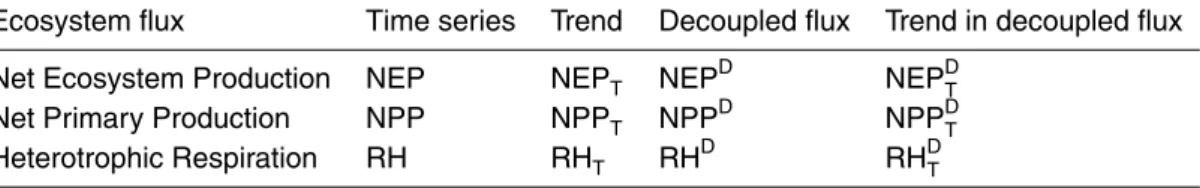
ward model runs. To obtain a climate-phenology, not recovery, driven NEP time series (NEPD, Table 2) we subtracted the fluxes estimated with the constant drivers (NEPK, Table 2) from the NEP time series:
NEPD=NEP−NEPK. (6)
With this procedure we can remove the variance and trajectories of NEP resulting
25
BGD
7, 4801–4855, 2010Upscaling ecosystem C fluxes for the Iberian Peninsula
N. Carvalhais et al.
Title Page
Abstract Introduction
Conclusions References
Tables Figures
◭ ◮
◭ ◮
Back Close
Full Screen / Esc
Printer-friendly Version Interactive Discussion
Discussion
P
a
per
|
Dis
cussion
P
a
per
|
Discussion
P
a
per
|
Discussio
n
P
a
per
|
2.8 Sensitivity analysis of net ecosystem fluxes to equilibrium assumptions
The sensitivity of the regional decadal fluxes to the initial conditions is assessed by evaluating the changes in inter-annual variability (IAV) and the trends in ecosystem fluxes computed assuming different distances to equilibrium. The reference scenario is always the time series of ecosystem fluxes estimated in equilibrium (η=1, for which
5
NEP is defined as NEPeq). Inter-annual variability is defined as the variance of the an-nual ecosystem flux integrals over all the years in the analyzed period: 1982 to 2006. The seasonal cycle is removed from the time series for the estimation of temporal trends on the ecosystem fluxes. The seasonal cycle is estimated on a pixel-by-pixel basis using a local variant of Singular System Analysis, as originally introduced by
10
Yiou et al. (2000). This method allows for detection of a highly phase and amplitude modulated seasonal cycle. Based on the deseasonalized time series, the magnitude of the trends is calculated by the Sen slope (Sen, 1968), which is considered a ro-bust estimator of the magnitude of a monotonic trend (Yue et al., 2002). The signif-icance of these trends in the ecosystem fluxes time series is evaluated through the
15
Mann–Kendall test (Kendall and Griffin, 1975; Mann, 1945). The Mann–Kendall test is a non-parametric rank based method that has been widely used to detect the pres-ence of monotonic trends in environmental variables (e.g., Burn et al., 2004; Hamed and Rao, 1998; Kahya and Kalayci, 2004), given its robustness to outliers and because no assumption on data distribution are required.
20
2.9 Decomposition of ecosystem fluxes
The observation of positive or negative trends in NEP can be due to different pro-cesses, since NEP is a balance between net C assimilation (NPP) and emission (RH). Consequently, a positive trend can be due to increases in NPP and/or decreases in RH, or can be caused by equal signed trends in NPP and RHbut where the magnitude
25
BGD
7, 4801–4855, 2010Upscaling ecosystem C fluxes for the Iberian Peninsula
N. Carvalhais et al.
Title Page
Abstract Introduction
Conclusions References
Tables Figures
◭ ◮
◭ ◮
Back Close
Full Screen / Esc
Printer-friendly Version Interactive Discussion
Discussion
P
a
per
|
Dis
cussion
P
a
per
|
Discussion
P
a
per
|
Discussio
n
P
a
per
|
into NPP and RH trends by evaluating the latter independently and mapping them in a scatter plot against each other (Fig. 1).
Further, the decomposition of NPP and RHtrends into their main drivers may clarify the mechanisms behind significant trends in both fluxes. The drivers for modeled NPP are remotely sensed NDVI and climate variables, although ultimately their influences
5
are expressed in terms of fAPAR and temperature and water availability stress factors trends:TεandWε, respectively. Although the relationships between observed variables
and the NPP scalars are non-linear, the scalars themselves all share the same dimen-sional characteristics – represent fractional properties ranging between 0 and 1 – and yield identical effects on NPP: a 0.1 increase in any of the temperature or water scalars
10
or in fAPAR equally yield a 10% increase in NPP (considering the same maximum light use efficiency and solar radiation conditions).
For RH, the changes in climate drivers may produce trends in the temperature (Ts) and water (Ws) stress scalars but RH is also influenced by substrate availability. The vegetation pools are the main sources of carbon for RH through the transfer of live
15
biomass to detritus via litter fall, wood and root mortality. The carbon transferred to the soil litter pools then cycles through different soil pools mediated by microbial de-composition releasing C through RH. The changes in substrate can be due to changes in inputs from the vegetation pools or due to changes in rates of consumption of the substrate. The latter produces a negative feedback on RHin response to
environmen-20
tal conditions: favorable conditions for RHincrease decomposition reducing substrate availability, and vice versa. The connection between these factors hampers distin-guishing between trends in soil C availability and environmental conditions. Hence we choose to focus on the carbon available for decomposition from the vegetation, which equals the sum of the vegetation pools magnitude weighted by their respective turnover
25
BGD
7, 4801–4855, 2010Upscaling ecosystem C fluxes for the Iberian Peninsula
N. Carvalhais et al.
Title Page
Abstract Introduction
Conclusions References
Tables Figures
◭ ◮
◭ ◮
Back Close
Full Screen / Esc
Printer-friendly Version Interactive Discussion
Discussion
P
a
per
|
Dis
cussion
P
a
per
|
Discussion
P
a
per
|
Discussio
n
P
a
per
|
the pools’ mean; hence the result is a relative trend, in fractional units, consistent with the units of the environmental scalars.
3 Results
3.1 Model optimization at site level
Throughout eddy covariance sites the parameter optimization yields statistically
signifi-5
cant correlations between observations and model simulations (α<0.0001). The model efficiency (MEF) at site level reflects an overall good agreement between simulations and observations (MEF closer to 1, Table 1) and the median of all site level MEF results is 0.79. Overall, the MEF of DBF, MF and SHR is significantly higher than the MEF of the other PFTs (1-way ANOVA, α<0.0005). Although the mean model performance
10
is higher in temperate fully humid climates, the difference is not statistically significant from the other climatic regimes (1-way ANOVA,α>0.25).
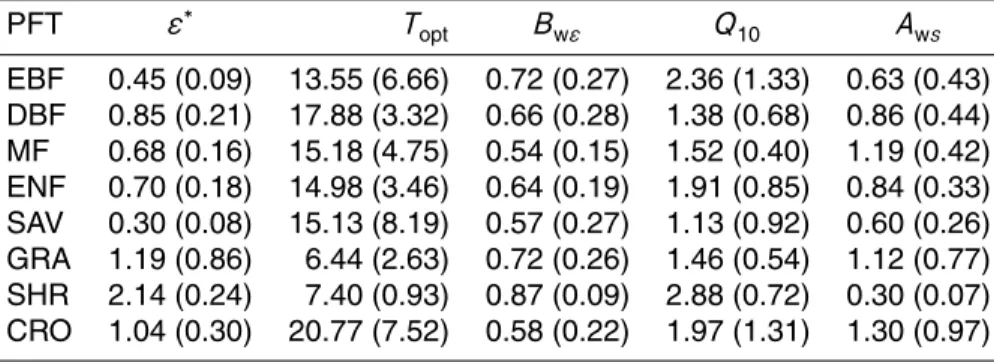
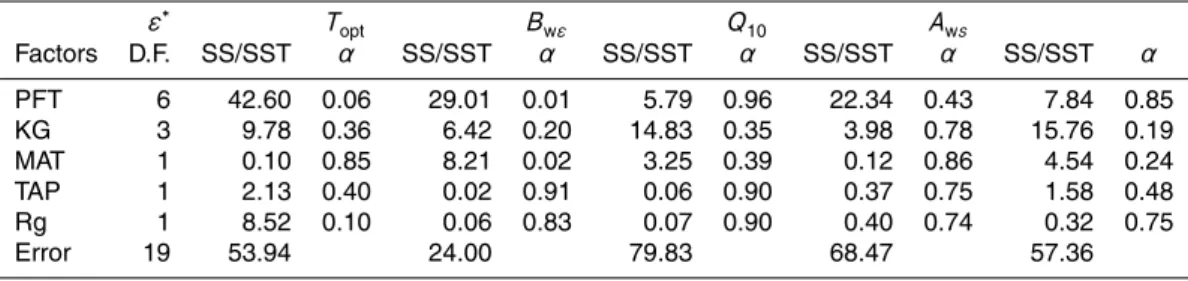
The optimized parameters differ among PFTs (Table 3) but the variance explained by this factor is modest compared to the sum of squared errors and the differences be-tween groups are hardly significant (Table 4). The one exception that shows significant
15
differences with PFT is the optimum temperature for NPP (Topt). In this case, estimated
Topt for the grasslands are significant lower than the observed values for other PFTs (α<0.0001). The removal of grassland sites from the analysis yields non significant differences among groups. Although the optimized parameters show no significant dif-ferences among the different climate regimes, this factor often contributes an important
20
part of the explained variability (Table 4).
BGD
7, 4801–4855, 2010Upscaling ecosystem C fluxes for the Iberian Peninsula
N. Carvalhais et al.
Title Page
Abstract Introduction
Conclusions References
Tables Figures
◭ ◮
◭ ◮
Back Close
Full Screen / Esc
Printer-friendly Version Interactive Discussion
Discussion
P
a
per
|
Dis
cussion
P
a
per
|
Discussion
P
a
per
|
Discussio
n
P
a
per
|
3.2 Upscaling parameter vectors for the IP
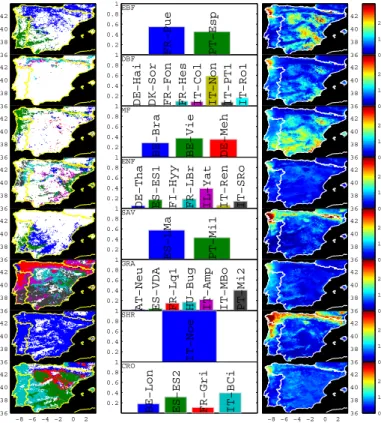
The map of the distances in climatological and phenological space (CPd) between individual pixels and the eddy covariance sites shows that in general the IP domain is well represented by the group of eddy covariance sites used in this analysis (Fig. 2).
For the entire Iberia, 94% of the pixels show a weighted CPd between pixel’s and
5
site characteristics below 1 – the nominal situation – meaning that, on average, the association between the chosen site for a given pixel is better than just considering the average of the target pixel (Schaefli and Gupta, 2007). The median distance (CPd) is 0.56, indicating a significant association between the drivers from the eddy covariance sites and from the regionalized datasets.
10
The NW region shows systematic higher CPd to the eddy covariance sites charac-teristics (Fig. 3) and emphasizes the low local representativeness for all PFTs in the region. Mixed forest, crops and grasslands each contribute about 20% of the total land cover in this region; hence, substantial improvements in the region’s representative-ness would be achieved by including in our analysis eddy covariance sites monitoring
15
such PFTs with more similar phenology and climate characteristics.
3.3 Changes in Inter-Annual Variability (IAV)
Inter-annual variability in NEP is higher for the farthest non-equilibrium initial conditions (observed at very low and high ηprescriptions, Fig. 4a). The modeling results show regional increases of 47% and 174% in IAV for the lowest and highestη, respectively,
20
considering the average fluxes for the whole domain of the IP (Fig. 4b, inset plot line a). The changes in IAV show significant increases in spatial variability with distance to equilibrium (Fig. 4a). These are driven by the changes in the IAV of RH, which are strongly dominated by the recovery of the carbon pools (Fig. 5a).
The removal of C pools recovery from the prescribedη(Eq. 6) significantly reduces
25
BGD
7, 4801–4855, 2010Upscaling ecosystem C fluxes for the Iberian Peninsula
N. Carvalhais et al.
Title Page
Abstract Introduction
Conclusions References
Tables Figures
◭ ◮
◭ ◮
Back Close
Full Screen / Esc
Printer-friendly Version Interactive Discussion
Discussion
P
a
per
|
Dis
cussion
P
a
per
|
Discussion
P
a
per
|
Discussio
n
P
a
per
|
previous results, with regional changes of −3% and 7% for ηof 0.01 and 2, respec-tively. Nevertheless, the spatial variability of IAV changes still increases with distance to equilibrium (Fig. 4b). The changes that still exist between the ratio of IAV of NEPD and the IAV of NEPeq for different η values are driven by changes in the IAV of RDH, which respond proportionally to the varying magnitude of soil carbon pools for different
5
η(Fig. 5b). A highηincreases the carbon pools which increase the magnitude of the IAV in RDHand its role in the IAV of NEPD. Conversely, lowηvalues reduce the role of RDH in the IAV of NEPD, and increase the role of the IAV in NPPD in the IAV of NEPD. Consequently, the effects on the IAV of NEPD are stronger for larger carbon sources (η≫1) and sinks (η≪1) (Fig. 4b), but these do not follow the RD
Hpatterns.
10
Overall, the results show that regionally both approaches reveal significant diff er-ences between each other (Fig. 4b, inset plot), which originate exclusively from the recovery of carbon pools from the prescribed initial disequilibrium conditions. The sim-ilarity between the IAV of the different NEPD suggests quasi-independence from the initial conditions. The slight changes observed in the IAV of NEPDstem not from the
15
recovery from the initial conditions but from the carbon pools sizes.
3.4 Temporal trends for the IP
The evaluation of trends in NEP shows that the spatial distribution of its magnitudes (Sen slope) is strongly influenced by the prescribed initial distance to equilibrium (Fig. 6a), as expected. On the other hand, the distribution of NEPDtrend magnitudes
20
appears to be η invariant (Fig. 6b) and suggests independence from the pools’ ini-tial conditions. The spaini-tial distribution of the significant trends in NEP in equilibrium (NEPeq, Fig. 6c) differs only slightly from the map of mean NEP
D
trends (Fig. 6d). The Mann–Kendall test yields non significant trends in NEP for 55% of the IP, while about 64% of the IP shows non significant trends for NEPD. The area difference of
nega-25
tive trends in the IP between NEPeq and NEP D
BGD
7, 4801–4855, 2010Upscaling ecosystem C fluxes for the Iberian Peninsula
N. Carvalhais et al.
Title Page
Abstract Introduction
Conclusions References
Tables Figures
◭ ◮
◭ ◮
Back Close
Full Screen / Esc
Printer-friendly Version Interactive Discussion
Discussion
P
a
per
|
Dis
cussion
P
a
per
|
Discussion
P
a
per
|
Discussio
n
P
a
per
|
almost 90% of the time on the type of trend (negative, positive or non significant) and the spatial NS between NEPeq and NEP
D
is 0.99. Consequently, these differences are considered minor. These results show significant trends in NEPD driven exclusively by climate and phenology. A direct implication of these results is the ability of the ap-proach to detect climate and phenology induced trends that are independent of the
5
initial carbon pools.
3.5 Determinants of temporal trends in the IP
Comparing the NEPDtrends (NEPDT) with trends in NPPD(NPPDT) and in (RHDT) (Fig. 7) allows us to identify the reasons behind the temporal behaviour of net ecosystem fluxes. The results reveal that ∼97% of the positive trends in NEPD are mostly
lo-10
cated in west, northwest and northern regions with positive trends in NPPD and in RDH, but the NPPDT slopes are higher that the slopes in RHDT (Fig. 8; Table 6). These correspond to∼73% of the total significant NEPD trends in the IP. Negative trends in NEPDare mainly located in southern central regions and can be divided into: positive trends in RDHand negative trends in NPPD (covering∼53% of the IP); negative or
pos-15
itive trends simultaneously in both fluxes, where the magnitude of the slope of RHDT is higher than the slope of NPPD (covering ∼30% and ∼17%, respectively). These re-sults are only slightly different from the trends resulting from the time series of NEPeq (Table 6). Overall, the trends in the IP for RDHand NPPDare predominantly positive.
The NPPD trends are a result of the trends in stress scalars on light use efficiency
20
driven by temperature and water availability (Tε and Wε,T εT and W εT, respectively) and with trends in fAPAR (fAPART). The trends observed in NPP
D
(NPPDT) are mainly driven by trends in fAPAR (Fig. 9). The spatial partial correlation between the trends in fAPAR and NPPDT is significantly higher than between TεT and NPP
D
T, 0.79 com-pared to 0.10, respectively (Table 7). The magnitude of theWεtrends was found to be
25
BGD
7, 4801–4855, 2010Upscaling ecosystem C fluxes for the Iberian Peninsula
N. Carvalhais et al.
Title Page
Abstract Introduction
Conclusions References
Tables Figures
◭ ◮
◭ ◮
Back Close
Full Screen / Esc
Printer-friendly Version Interactive Discussion
Discussion
P
a
per
|
Dis
cussion
P
a
per
|
Discussion
P
a
per
|
Discussio
n
P
a
per
|
correlation between W εT and NPP D
T is 0.25: significantly higher than the one found forT εT. Overall, these results suggest a significant role of fAPAR time series in the productivity trends for the Iberian region.
Following the analogous procedure, the trends in RDHare compared to the trends ob-served in the scalars that translate the effect of temperature and soil moisture in RH(Ts
5
andWs, respectively) and in the vegetation C pools available for RH(substrate availabil-ity). In the Iberian region the substrate availability has a stronger effect thanTson the trends in RDH(Fig. 11). The same holds true when comparing substrate availability with the effect of soil moisture (Fig. 12). However, the spatial partial correlation between trends in RDH and its drivers’ are not very different between substrate availability (0.25)
10
and temperature (0.23), and are lower for the water stress scalars (0.11). These corre-lations change significantly when considering only negative trends in the NEP, where the substrate availability explains 86% of the spatial variability, emphasizing the role of substrate availability in the RDHtrends (Table 7).
4 Discussion 15
4.1 CASA model optimization
Globally, the site level optimization supports significant confidence in CASA’s perfor-mance. In general, the optimized parameters (Table 3) are within published results (e.g., K ¨atterer et al., 1998; Kirschbaum, 1995; Ruimy et al., 1994) although two diff er-ent situations are worth mer-entioning: i) the lowTopt values found for grasslands; and ii)
20
the high uncertainties in croplandsε∗
and Topt. The low Toptvalues found for grasses are border line or pass the 10◦
to 25◦
C range for C3 and 30◦ to 40◦
C for C4 plants, al-though some C3 species are quite active at 5◦C (Breymeyer et al., 1980). Most of these sites are C3, with the exception of PT-Mi2 which is a C3/C4 mix. Overall, the Topt of these grasslands is comparable to the mean annual temperature observed at site level,
BGD
7, 4801–4855, 2010Upscaling ecosystem C fluxes for the Iberian Peninsula
N. Carvalhais et al.
Title Page
Abstract Introduction
Conclusions References
Tables Figures
◭ ◮
◭ ◮
Back Close
Full Screen / Esc
Printer-friendly Version Interactive Discussion
Discussion
P
a
per
|
Dis
cussion
P
a
per
|
Discussion
P
a
per
|
Discussio
n
P
a
per
|
which suggests coherence between observed climate and the optimized values. The higher uncertainties in cropland parameters suggest the need to improve/adapt model dynamics in agricultural systems, including the prescription of different root to shoot ra-tios according to crop type (e.g., Bondeau et al., 2007) and explicit harvest events, with above ground biomass removals (e.g., Hicke and Lobell, 2004; Lobell et al., 2006), as
5
well as different management regimes considering crop rotation, fertilization, irrigation and tillage practices. These dynamics were not included in the current model imple-mentation. Nevertheless, the significant model performance in croplands suggests that the phenology time series acquired from remote sensing captures most of the variabil-ity of the NPP. Further, in site level optimizations, the lack of harvest removal of C from
10
the leaf pools that then feeds the soil pools can be approximated by reductions inη. For the purpose of this study, the absence of such dynamics in model simulations is unlikely to change our results.
4.2 Upscaling parameter vectors for the IP
The results reveal systematic lower representativeness in the Northwestern IP region
15
which is generally identified as a high productivity area in regional and global studies (e.g., Jung et al., 2008). Representativeness in this region is low for all PFTs (Fig. 3), which reveals that the under-representation is related to the phenological and climate variables used in the classification. Improved representativeness in this region will re-quire more flux measurements from mixed forests, crops or grassland sites with similar
20
bioclimatic characteristics. Further, only one observational site was available repre-senting shrub lands for the entire IP.
The current approach identifies the limitations in the sample of eddy covariance sites for representing the regional ecosystems in the IP. Similar approaches would be useful in assisting network design or for selection of possible site locations in future network
25
BGD
7, 4801–4855, 2010Upscaling ecosystem C fluxes for the Iberian Peninsula
N. Carvalhais et al.
Title Page
Abstract Introduction
Conclusions References
Tables Figures
◭ ◮
◭ ◮
Back Close
Full Screen / Esc
Printer-friendly Version Interactive Discussion
Discussion
P
a
per
|
Dis
cussion
P
a
per
|
Discussion
P
a
per
|
Discussio
n
P
a
per
|
results lend support to the conceptual approach taken here to upscale the CASA model parameters. However, there is still a significant fraction of unexplained variability in the parameters and our bottom-up approach does not address issues related to the vari-ability of parameters within the same PFT or climate regime. Increasing the number of sites and including other factors in the analysis – such as disturbance or management
5
regimes – are two important issues to consider towards more comprehensive upscal-ing and modelupscal-ing exercises. In this regard we recognize the importance of prescribupscal-ing management (e.g., Bondeau et al., 2007) or disturbance (e.g., van der Werf et al., 2003) regimes, as well as the effects of nutrients dynamics (e.g., Zaehle et al., 2010).
4.3 Dynamics of ecosystem fluxes induced by climate and phenology 10
The effects of different initial conditions on the IAV and temporal trends in NEP were higher for the highest departures from equilibrium, as expected. Since the spin-up routines were performed with an average climate and phenology dataset, the modeled recovery from the initial perturbations (η) is expected to lead to similar ecosystem states (carbon pools). The farthest positive departures from equilibrium (NEP≫0 since
15
η≪1) create an initial sink condition that is then attenuated and consequently leads to the steepest negative slopes of NEP trends. In these cases, carbon is accumulated in the soil pools with time, enhancing RH through increases in substrate availability, and therefore decrementing NEP in time. Oppositely, the farthest negative departures from equilibrium (NEP≪0 sinceη≫1) force an initial carbon source by increasing the
20
soil pools. The increase in substrate availability boosts RH in the beginning of the simulation which is reduced in time, generating a positive trend in NEP. Consequently, the highest changes in the IAV of NEP are observed when extreme departures from steady state are prescribed.
The extraction of the carbon pools dynamics (NEPK) from the NEP time series allows
25
BGD
7, 4801–4855, 2010Upscaling ecosystem C fluxes for the Iberian Peninsula
N. Carvalhais et al.
Title Page
Abstract Introduction
Conclusions References
Tables Figures
◭ ◮
◭ ◮
Back Close
Full Screen / Esc
Printer-friendly Version Interactive Discussion
Discussion
P
a
per
|
Dis
cussion
P
a
per
|
Discussion
P
a
per
|
Discussio
n
P
a
per
|
of the carbon pools dynamics in the estimation of ecosystem fluxes. These results show that simulated net ecosystem fluxes can strongly diverge depending on initial conditions assumptions. Additionally, the trends in the NEPDtime series show a strong insensitivity toηrevealing independence from the initial estimates of C pools (Fig. 6b). The results exhibit the potential of NEPDto isolate and diagnose climate and phenology
5
driven trends in ecosystem fluxes. By identifying significant and consistent trends in NEPDwe’re able to map regions of robust trends in the Iberian region.
The differences between the spatial distribution of trends in NEPD and NEPeq are minor and reveal that here the climate and phenology driven dynamics are quasi-independent from the initial steady state conditions (Fig. 6c,d). Using a mean yearly
10
dataset of drivers during the period 1982–2006 ensures the adjustment of carbon pools to the mean of the drivers of the run. The adjustments follow first order dynamics that are intrinsic to the model structure (CASA’s and many other biogeochemical models). This means that we can isolate the effects of unknown initial conditions by removing NEPK from NEP. The result is the retrieval of a time series of NEPD that is
quasi-15
independent from the initial conditions of carbon pools. In the current experiments these independent trends are analogous to the trends in NEPeq because the dataset that drives NEPK is equal to the spin-up dataset. Consequently, as an alternative to spinning up the models until equilibrium this approach has advantages for exploring the effects of drivers on net ecosystem fluxes independently of the initial conditions of
20
pools.
We should add that ultimately the overall absolute NEP trends are not independent from the initial conditions. Although removing carbon pools dynamics from the ecosys-tem fluxes may allow independence from equilibrium assumptions, such a procedure does not solve the initial state problem and our ability to quantify temporal trends is
25
BGD
7, 4801–4855, 2010Upscaling ecosystem C fluxes for the Iberian Peninsula
N. Carvalhais et al.
Title Page
Abstract Introduction
Conclusions References
Tables Figures
◭ ◮
◭ ◮
Back Close
Full Screen / Esc
Printer-friendly Version Interactive Discussion
Discussion
P
a
per
|
Dis
cussion
P
a
per
|
Discussion
P
a
per
|
Discussio
n
P
a
per
|
– especially agriculture and fire – for the estimation of net biome production (Chapin et al., 2006). In addition, the extension of the current exercise to living pools in non equilibrium conditions can be aided by prospective remotely sensed estimations of above ground biomass.
4.4 Decomposition of ecosystem fluxes 5
The comparison between NEPD trends and the trends in its component fluxes, NPPD and RDH, discloses the dynamics behind the positive and negative trends in NEPD. For most of the Iberian region the positive trends in NEPD are associated with positive trends in NPPDand in RDH, although the slope magnitudes are higher for NPPD. These results are consistent with recent modeling studies (Piao et al., 2009a) and with eddy
10
covariance based studies that advocate the significant role of gross primary production in driving NEP (e.g., Baldocchi, 2008; Reichstein et al., 2007). The positive trends in NPPD are more strongly linked to positive trends in fAPAR than to the climate effects on light use efficiency. Since fAPAR estimates are based on the NDVI datasets, the modeled positive NPP trends are mostly driven by phenological data rather then climate
15
data. The fAPAR time series are estimated from NDVI (following Los et al., 2000), hence the trend results demonstrate the role of NDVI time series in driving the trends in NPP (cf. Jung et al., 2008).
The close association between climate and vegetation implies that the NDVI signal itself contains the effects of climate regimes and patterns in the phenological
character-20
istics of the vegetation (e.g., Myneni et al., 1997). In the CASA model the temperature stress scalars are conceptually associated to adjustments in autotrophic respiration costs while the water stress on canopy productivity can be ascribed to reductions in stomatal conductance (Potter et al., 1993). However, the plants’ response mecha-nisms to environmental stress can yield impacts on APAR,εor both. In this regard,
25
BGD
7, 4801–4855, 2010Upscaling ecosystem C fluxes for the Iberian Peninsula
N. Carvalhais et al.
Title Page
Abstract Introduction
Conclusions References
Tables Figures
◭ ◮
◭ ◮
Back Close
Full Screen / Esc
Printer-friendly Version Interactive Discussion
Discussion
P
a
per
|
Dis
cussion
P
a
per
|
Discussion
P
a
per
|
Discussio
n
P
a
per
|
(e.g., Goerner et al., 2009; Grace et al., 2007).. It is then implicit in the model structure that the environmental effects onεand on fAPAR are complimentary for the estimation of NPP and act at different time scales. Hence, here, only the effects of temperature and water availability on light used efficiency can be decomposed from the primary productivity signal.
5
The main mechanism behind positive trends in the net ecosystem fluxes originates from increases in primary production (mostly driven by fAPAR) that consequently in-crease the vegetation carbon pools and the substrate availability for heterotrophic res-piration. Here, the impact of substrate availability is in general significantly higher than the effects of temperature or soil moisture on the trends in RDH.
10
In areas of negative NEPDtrends the partial correlation between the spatial patterns of trends in RDHand substrate availability is significantly higher (Table 7). In these cases (NEPDT<0) the increments in substrate availability are not attributable to increases in NPP, since most of the trends in fAPAR (89%) as well as in NPPD(83%) are negative. Here, when RHDT>0, the positive trends in substrate availability (75%) are mainly
as-15
sociated to positive trends in the root pools (88%). These positive trends in the root pools are contrary to the trends observed in NPPD. This apparent contrary behaviour results from increases in the carbon allocated to the below ground vegetation pools caused by negative trends in the water stress scalars of ε∗
(88%), increasing water stress. The investment in the root pools is associated with the increasing trends in
20
water stresses and is consistent with the dynamic allocation scheme by Friedlingstein et al. (1999). Due to the higher turnover rates of the fine root pools – compared to the wood pools – the changes in the allocation strategies increase the availability of carbon for decomposition. These observations highlight that the contribution of climate for long term changes in heterotrophic respiration cannot be dissociated from the availability of
25
BGD
7, 4801–4855, 2010Upscaling ecosystem C fluxes for the Iberian Peninsula
N. Carvalhais et al.
Title Page
Abstract Introduction
Conclusions References
Tables Figures
◭ ◮
◭ ◮
Back Close
Full Screen / Esc
Printer-friendly Version Interactive Discussion
Discussion
P
a
per
|
Dis
cussion
P
a
per
|
Discussion
P
a
per
|
Discussio
n
P
a
per
|
5 Conclusions
Our bottom-up approach allowed us to investigate the influences of the initial con-ditions in modeling regional net ecosystem fluxes. Overall, the site level optimiza-tion results showed significant confidence in model performance. Addioptimiza-tionally, the set of sites selected are, in general, significantly representative of the Iberian Peninsula.
5
Our approach also highlights locations of systematic poorer representation ability: the northwestern region, suggesting a strong need to expand monitoring in this area. Con-sequently, the CASA model reveals itself as a robust diagnostic approach to estimate NEP fluxes and the methodology to upscale parameter vectors allows the identifica-tion of less represented regions. The presented bottom-up approach emphasizes the
10
relevance of analogous methods for the design of ecosystem monitoring networks. The influence of the initial conditions on NEP trends and inter-annual variability is sig-nificant, as expected. However, we present a method to distinguish between the model intrinsic dynamics following initialization routines and the flux variability only induced by the driver data. Consequently, we are able to investigate the inter-annual variability and
15
trends in fluxes quasi-independently from the initial conditions. The relevance of such approach emerges from the fact that most of the time the initial conditions of regional or global simulations are unknown.
The results for the Iberian Peninsula show that the trends in the net ecosystem fluxes are strongly linked to trends in primary production. The positive trends in the net
20
ecosystem fluxes are observed in western and northern regions with positive trends in both primary production and heterotrophic respiration fluxes. Here, the magnitudes of the trends are higher for the primary production fluxes. These are generally driven by positive trends in fAPAR, that drive positive trends in NPPD, vegetation pools and consequently in the substrate availability for decomposition at the soil level. Further, in
25
BGD
7, 4801–4855, 2010Upscaling ecosystem C fluxes for the Iberian Peninsula
N. Carvalhais et al.
Title Page
Abstract Introduction
Conclusions References
Tables Figures
◭ ◮
◭ ◮
Back Close
Full Screen / Esc
Printer-friendly Version Interactive Discussion
Discussion
P
a
per
|
Dis
cussion
P
a
per
|
Discussion
P
a
per
|
Discussio
n
P
a
per
|
result from changes in carbon allocation strategies that are driven by positive trends in water stress. Overall, these modeling results suggest a strong link between the compo-nent processes of net ecosystem fluxes. Further, the significant role of fAPAR in NPPD trends and of substrate availability in RDHtrends emphasizes that the underlying mech-anisms of trends in net ecosystem fluxes are strongly – but not necessarily linearly –
5
associated with primary production and allocation.
Overall, our results show that isolating the time series of ecosystem fluxes from the initial conditions allows the identification of the effects of driver data on flux trends, which suggest significant advantages for the estimation of the sensitivity of ecosystem fluxes to climate drivers. The alleviation of the initialization uncertainty is significantly
10
relevant to long term modeling studies of net ecosystem fluxes.
Acknowledgements. We would like to thank Nicolas Delpierre, Ivan Janssens and Leonardo Montagnani for useful comments on the manuscript and Jim Tucker, Ed Pak and Jorge Pinzon for the GIMMS NDVI datasets, as well as to all the teams working at the eddy-covariance sites for setting available the site level datasets. The temperature and solar radiation data from the 15
Global Land Data Assimilation System used in this study were acquired as part of the mission of NASA’s Earth Science Division and archived and distributed by the Goddard Earth Sciences (GES) Data and Information Services Center (DISC). We thank the European Environmental Agency (Copenhagen) for setting available online the CORINE land cover. Research leading to flux data and scientific insight was supported by the CarboEurope-Integrated Project 20
GOCE-CT-2003-505572. This work was supported by the Portuguese Foundation for Science and Technology (FCT) under the MODNET project (contract no. PTDC/AGR-CFL/69733/2006) and by the CARBO-Extreme project (FP7-ENV-2008-1-226701). NC acknowledges the support given by the Portuguese Foundation for Science and Technology (FCT), the European Union under Operational Program ”Science and Innovation” (POCI 2010), PhD grant ref. 25
SFRH/BD/6517/2001. NC, MDM and MR are grateful to the Max-Planck-Society for supporting the Max-Planck Research Group for Biogeochemical Model-Data Integration.
BGD
7, 4801–4855, 2010Upscaling ecosystem C fluxes for the Iberian Peninsula
N. Carvalhais et al.
Title Page
Abstract Introduction
Conclusions References
Tables Figures
◭ ◮
◭ ◮
Back Close
Full Screen / Esc
Printer-friendly Version Interactive Discussion
Discussion
P
a
per
|
Dis
cussion
P
a
per
|
Discussion
P
a
per
|
Discussio
n
P
a
per
|
References
Abramowitz, G., Leuning, R., Clark, M., and Pitman, A.: Evaluating the performance of land surface models, J. Climate, 21, 5468–5481, 2008. 4804
Andr ´en, O. and K ¨atterer, T.: ICBM: The introductory carbon balance model for exploration of soil carbon balances, Ecol. Appl., 7, 1226–1236, 1997. 4812
5
Aubinet, M., Grelle, A., Ibrom, A., Rannik, U., Moncrieff, J., Foken, T., Kowalski, A. S., Mar-tin, P. H., Berbigier, P., Bernhofer, C., Clement, R., Elbers, J., Granier, A., Gr ¨unwald, T., Morgenstern, K., Pilegaard, K., Rebmann, C., Snijders, W., Valentini, R., and Vesala, T.: Estimates of the annual net carbon and water exchange of forests: the EUROFLUX method-ology, Adv. Ecol. Res., 30, 113–175, 2000. 4807
10
Aubinet, M., Chermanne, B., Vandenhaute, M., Longdoz, B., Yernaux, M., and Laitat, E.: Long term carbon dioxide exchange above a mixed forest in the Belgian Ardennes, Agr. Forest Meteorol., 108, 293–315, 2001. 4837
Baldocchi, D.: Turner Review No. 15. “Breathing” of the terrestrial biosphere: lessons learned from a global network of carbon dioxide flux measurement systems, Aust. J. Bot., 56, 1–26, 15
2008. 4823
Barcza, Z., Kern, A., Haszpra, L., and Kljun, N.: Spatial representativeness of tall tower eddy covariance measurements using remote sensing and footprint analysis, Agr. Forest Meteo-rol., 149, 795–807, 2009. 4810
Bondeau, A., Smith, P. C., Zaehle, S., Schaphoff, S., Lucht, W., Cramer, W., and Gerten, D.: 20
Modelling the role of agriculture for the 20th century global terrestrial carbon balance, Global Change Biol., 13, 679–706, 2007. 4820, 4821
Bossard, M., Feranec, J., Otahel, J., and Agency, E. E.: Corine land cover technical guide-addendum 2000, Technical report no. 40, 2000. 4811
Braswell, B. H., Sacks, W. J., Linder, E., and Schimel, D. S.: Estimating diurnal to annual 25
ecosystem parameters by synthesis of a carbon flux model with eddy covariance net ecosys-tem exchange observations, Global Change Biol., 11, 335–355, 2005. 4804
Breymeyer, A. I., Dyne, G. M. V., and Programme, I. B.: Grasslands, Systems Analysis, and Man, Cambridge University Press, 1980. 4819
Burn, D. H., Cunderlik, J. M., and Pietroniro, A.: Hydrological trends and variability in the Liard 30