* Corresponding author
E-mail: [email protected] (H. Tebassi) © 2017 Growing Science Ltd. All rights reserved. doi: 10.5267/j.ijiec.2016.12.003
International Journal of Industrial Engineering Computations 8 (2017) 347–362
Contents lists available at GrowingScience
International Journal of Industrial Engineering Computations
homepage: www.GrowingScience.com/ijiec
Quality-productivity decision making when turning of Inconel 718 aerospace alloy:
A response surface methodology approach
Hamid Tebassia*, Mohamed Athmane Yallesea, Salim Belhadia, Francois Girardinb and Tarek
Mabroukic
aMechanics and Structures Research Laboratory (LMS), May 8th 1945 University, P.O. Box 401, Guelma 24000, Algeria
bLaboratoire Vibrations Acoustique, INSA-Lyon, 25 bis avenue Jean Capelle, F-69621 Villeurbanne Cedex, France
cUniversité de Tunis El Manar, Ecole Nationale d'Ingénieurs de Tunis (ENIT), 1002, Tunis, Tunisie
C H R O N I C L E A B S T R A C T
Article history: Received October 2 2016 Received in Revised Format October 28 2016
Accepted December 2 2016 Available online
December 2 2016
Inconel 718 is among difficult to machine materials because of its abrasiveness and high strength even at high temperature. This alloy is mainly used in aircraft and aerospace industries. Therefore, it is very important to reveal and evaluate cutting tools behavior during machining of this kind of alloy. The experimental study presented in this research work has been carried out in order to elucidate surface roughness and productivity mathematical models during turning of Inconel 718 superalloy (35 HRC) with SiC Whisker ceramic tool at various cutting parameters (depth of cut, feed rate, cutting speed and radius nose). A small central composite design (SCCD) including 16 basics runs replicated three times (48 runs), was adopted and graphically evaluated using Fraction of design space (FDS) graph, completed by a statistical analysis of variance (ANOVA). Mathematical models for surface roughness and productivity were developed and normality was improved using the Box-Cox transformation. Results show that surface roughness
criterion Ra was mainly influenced by cutting speed, radius nose and feed rate, and that the depth
of cut had major effect on productivity. Finally, ranges of optimized cutting conditions were proposed for serial industrial production. Industrial benefit was illustrated in terms of high surface quality accompanied with high productivity. Indeed, results show that the use of optimal
cutting condition had an industrial benefit to 46.9 % as an improvement in surface quality Ra
and 160.54 % in productivity MRR.
© 2017 Growing Science Ltd. All rights reserved Keywords:
Surface roughness Productivity
Response surface methodology Box-Cox technique
Analysis of variance Response optimization
1. Introduction
et al., 2006). These properties are commonly the strength maintained during machining, the highly abrasive carbide particles contained in the microstructure and the poor thermal conductivity (Sharman et al., 2001; Li et al., 2002), which leads to elevate the cutting temperature up to 1200 °C at the rake face (Kitagawa et al., 1997). Consequently, the requirements for any cutting tool material used for machining these alloys should include: good wear resistance, high hot hardness, high strength and toughness, good thermal shock properties and adequate chemical stability at high temperature (Ezugwu et al., 1999); such as ceramic tools recommended for machining of these alloys compared with coated carbide at high cutting speed (Darwish, 2000; Nalbant et al., 2007; Gatto & Iuliano, 1997).
Nevertheless, notch wear VN and flank wear VB of the SiC whiskers and the Si3N4 ceramics, become very large at high speed and/or high feed rate (Narutaki et al., 1993). This large wear at high cutting speed is caused by diffusion between Si in the insert and Inconel 718 (El-Wardany et al., 1996). In addition, tool wear can also be caused by an abrasive rather than by a thermally process, by considering its poor thermal conductivity, which leads to elevate the temperature at the rake face (Kitagawa et al., 1997).The minimum flank wear was observed when using the SNGN tools at low cutting speeds or the RNGN tools at high cutting speeds (Altin et al., 2007). In addition, cutting forces and different types of tool wear were reduced by increasing the feed rate when turning of Inconel 718 with ceramic tool (El-Wardany et al., 1996), this parameter is considered as the most relevant cutting parameter affecting ceramic tool stresses (Kose et al., 2008; Nalbant et al., 2007; Ezugwu & Tang, 1995; Gatto & Iuliano, 1997; Altin et al., 2007).
However, Zhuang et al. (2014) concluded that the tool failure having another form. Certainly, the main failure modes of ceramic cutting tools during machining of Inconel 718 are notch wear and flank wear. This damage may be caused by the hardened layer beneath the workpiece surface. Considering mechanical properties of workpiece, specific shearing energy which is a strong function of feed rate; was the largest at the lowest cutting speed (125 m/min) and reduces subsequently when the cutting speeds increases up to 300 m/min (Pawade et al., 2009). Regarding surface quality and productivity, Yadav et al. (2015) and Tebassi et al. (2016b) obtained that the most influencing factor on MRR is depth of cut, whereas spindle speed and depth of cut are the most influencing factors on flank wear. In the same way, at low feed rate; the tendency for built-up edge formation, is also higher than at a higher feed, due to an increase in the size of the plastic deformation area at the interface of the tool and workpiece (Zhou et al., 2012).
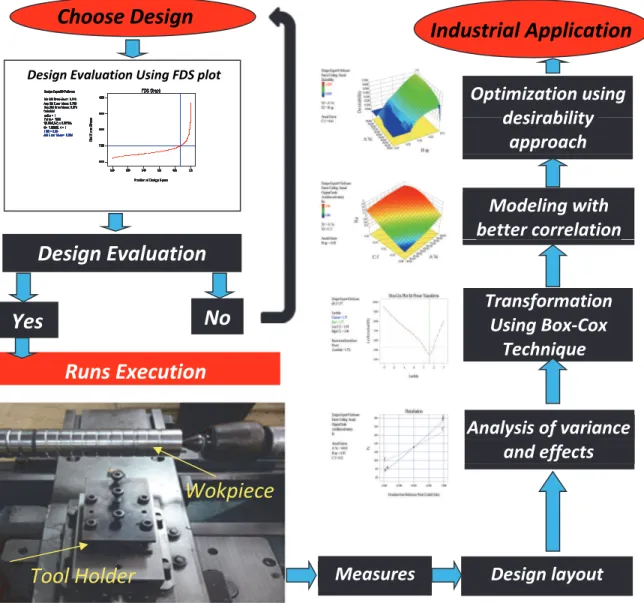
Regarding this cited problematic, the main objective of the present work is to investigate the influence of different machining parameters on surface finish and productivity when turning of Inconel 718 super-alloy using the SiC Whisker ceramic tool. Consequently, the current study develops cutting strategies using a combination of the optimal parameters in the goal of part functional requirements while keeping high level of economical and industrial competition. Response surface methodology design approach, has been adopted for the experimental planning during turning of Inconel alloy. The results were analyzed in order to determine the optimal machining parameters settings and achieve optimal surface roughness and productivity. ANOVA was performed to investigate the more influencing parameters on the multiple performance characteristics. Mathematical models have been developed based on the full quadratic model which is generally used in RSM problems (Choudhury & El-Baradie, 1999), it can be written as follow:
(1)
or negative power, as well as the log, power, square…. etc. The Box-Cox power transformation on observations Yi (i =1, 2… n), is given by Box & Cox (1964) as:
Y
Y
. . Y
(2)
where lamda is the power transformation parameter and n is the sample size. Multi-objective optimization procedure is allowed for minimizing the roughness Ra combined with maximal productivity
MRR, using desirability approach.
2. Experimental procedure
2.1 Material and measurement
The aim of the current experimental work is to investigate the effect of cutting parameters on surface roughness and productivity with developing a correlation between them. In order to reach this objective, cutting speed (Vc), feed rate (f), depth of cut (ap) and nose radius (r) are chosen as process parameters. The workpiece material used in this study was Inconel 718 having hardness of 35 HRC and the chemical composition of: 0.08%C; 0.35%Mn; 0.35%Sn; 0.015%P; 0.015%S; 55%Ni+Co; 21%Cr; 12.29%Fe; 3.3%Mo; 1.15%Ti; 0.15%Cu; 0.8%Al; 5.5% (Cb+Ta). The workpiece geometry is a cylindrical bar specimen having 70 mm for diameter , 350 mm for length and cutting length of 20 mm. Straight turning operations have been achieved using a 6.6 kW spindle power of the lathe (TOS TRENCIN model SN40C) under dry conditions. The experimental setup is shown in Fig.1. Cutting inserts were SiC whisker ceramic with the standard designation (ISO) of SNGN 120408, 120412 and 120416, commercialized by Sandvik under CC670 (Sandvik, 2009). The tool holder used in this experimental study has the standard designation of CSBNR2525M12 with the following angles: χr = 45°, α = 6°, = -6° and λ = -6°. Surface roughness measurements have been obtained directly on the machine without disassembling the workpiece; using a roughness meter (Surftest 201 Mitutoyo). Material removal rate
MRR is calculated using Eq. (3) (Sandvik, 2009; Guo et al., 2012).
MRR =1000×Vc× ap, (3)
where MRR is in (mm3/min), Vc, ap, f and r are respectively the cutting speed in (m/min), depth of cut in (mm), feed rate in (mm/rev) and nose radius in (mm).
2.2 Experimental design
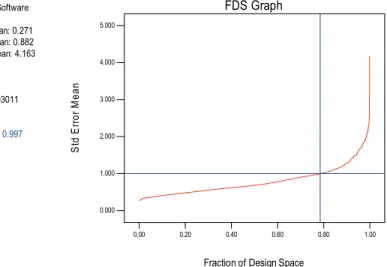
showing the relationship between the “volume” of the design space (area of interest) and the amount of prediction error (Anderson-Cook et al., 2009; Khuri, 2009; Borkowski, 2009). The curve indicates what fraction (percentage) of the design space has a given prediction error or lower. In general, a lower and flatter FDS curve is better. Lower is more important than flatter. A lower curve translates to a higher Fraction of Design Space - more of the design has useful precision. Indeed, Fig. 2 shows that 78% of design space having a mean standard error inferior or equal than 0.997.
Fig. 1. Set-up and design of experiments
Table 1
Assignment for the levels to the factors
Level Vc (m/min) f (mm/rev) ap (mm) r (mm)
-1 100 0.08 0.1 0.8
0 150 0.12 0.2 1.2
1 200 0.16 0.3 1.6
Wokpiece
Tool
Holder
Measures
Design
layout
Analysis
of
variance
and
effects
Modeling
with
better
correlation
Optimization
using
desirability
approach
Transformation
Cox
‐
Using
Box
Technique
Industrial
Application
Runs
Execution
Design Evaluation Using FDS plot
Design
Evaluation
Yes
No
The RSM applied in this work is considered as a procedure to identify a relationship between independent input process parameters and output data (process response).This procedure includes commonly six steps (Tebassi et al., 2016b; Gaitonde et al., 2009; Davim et al., 2008):
(1) define the independent input variables and the desired output responses, (2) adopt an experimental design, (3) perform regression analysis with the quadratic model of RSM, (4) perform a statistical analysis of variance (ANOVA) of the independent input variables in order to find parameters which affect the most significantly response, (5) determine the situation of the RSM model and decide whether this model needs screening variables or not and finally (6) optimize, conduct confirmation experiment with verifying the predicted output parameters.
Fig. 2. Fraction of design space plot for Small CCD with 48 runs
3. Results and discussion
The design of experiment was developed for assessing the influence of the cutting speed Vc, feed rate f, depth of cut ap and nose radius r on surface roughness Ra and productivity MRR. The statistical treatment of the data was made in three phases. The first phase includes the use of ANOVA, with the aim of studying the effect of factors and their interactions. The second phase consists of the choice of the best model transforms law to obtain the highest correlation between the parameters using Box-Cox Plot for Power Transforms (Osborne, 2010; Sakia, 1992). Afterwards, in the final phase, the results have to be optimized.
3.1 Statistical analysis
A variance analysis of the surface roughness and productivity was performed with the objective of analyzing the influence of cutting speed, feed rate, depth of cut and nose radius of cutting tool on the obtained outputs. This analysis was out for a 5% significance level, i.e., for a 95% confidence level.
3.1.1 Surface roughness
It can be shown in Table 2, that the surface roughness Ra was obtained in the range of (0.32–1.64) µm and the material removal rate MRR was obtained, in the range of (800 –7200) mm3/min.
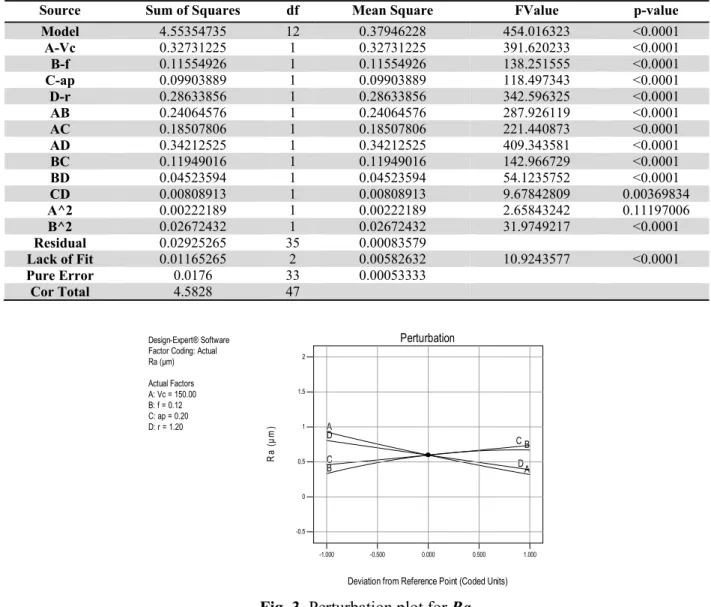
According to Table 3, that shows ANOVA for Ra, it can be observed that the significant terms on roughness Ra were Vc, ap, f and r, the products Vc*ap, Vc*f, ap*f, f*r, ap*r and Vc*r and the square f2.
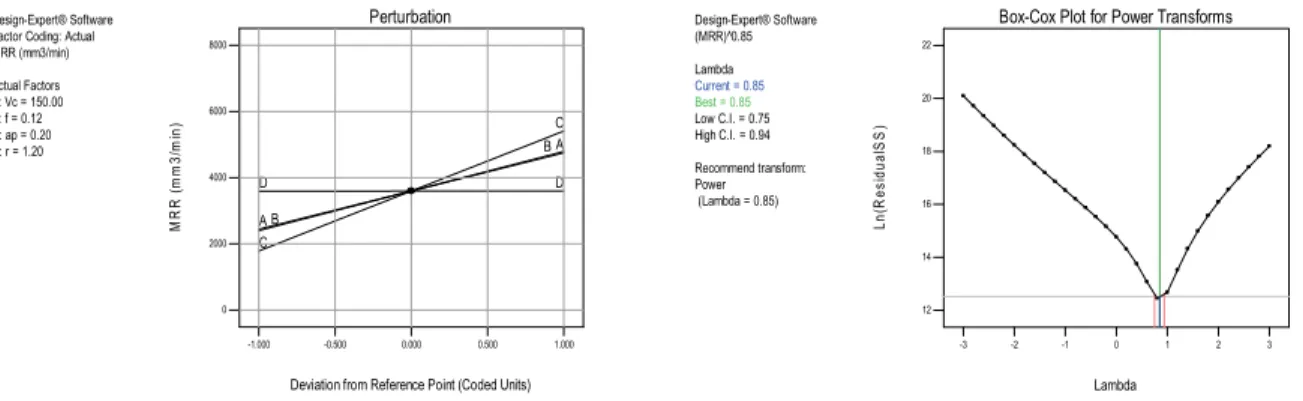
The perturbation plot in Fig. 3 helps to compare the effect of all the factors at a particular point in the design space.
Design-Expert® Software
Min Std Error Mean: 0.271 Avg Std Error Mean: 0.882 Max Std Error Mean: 4.163 Cuboidal
radius = 1 Points = 1000 t(0.05/2,35) = 2.03011 d = 2.0236, s = 1
FDS = 0.78 Std Error Mean = 0.997
0.00 0.20 0.40 0.60 0.80 1.00
0.000 1.000 2.000 3.000 4.000 5.000
FDS Graph
Fraction of Design Space
S
td
E
rro
r M
e
a
A steep slope for Vc and r or curvature in a factors ap and f, shows that the response is sensitive to those factors. Indeed, from this figure, it can be seen that the most significant factors on the parameters Ra
was the cutting speed Vc, feed rate f and radius nose r.
Table 2
Experimental results for surface roughness and productivity
Run N° Vc (m/min) f (mm/rev) ap (mm) r (mm) Ra (µm) MRR (mm3/min)
1 200 0.12 0.2 1.6 0.41 4800
2 100 0.12 0.2 1.6 0.4 2400
3 100 0.08 0.3 1.6 0.4 2400
4 100 0.16 0.1 1.6 0.68 1600
5 150 0.12 0.3 0.8 0.87 5400
6 100 0.08 0.1 0.8 0.54 800
7 150 0.16 0.3 1.2 0.56 7200
8 150 0.08 0.2 1.2 0.33 2400
9 150 0.12 0.2 1.6 0.35 3600
10 200 0.12 0.1 1.2 0.41 2400
11 150 0.12 0.1 1.2 0.45 1800
12 100 0.08 0.3 1.6 0.4 2400
13 200 0.16 0.1 1.6 0.72 3200
14 200 0.08 0.3 1.6 0.4 4800
15 200 0.08 0.1 0.8 0.38 1600
16 100 0.16 0.2 0.8 1.6 3200
17 200 0.12 0.2 1.6 0.42 4800
18 150 0.16 0.3 1.2 0.57 7200
19 200 0.12 0.1 1.2 0.43 2400
20 100 0.16 0.2 0.8 1.64 3200
21 100 0.08 0.3 1.6 0.35 2400
22 100 0.08 0.3 1.6 0.35 2400
23 150 0.12 0.2 1.6 0.36 3600
24 150 0.08 0.2 1.2 0.32 2400
25 150 0.12 0.3 0.8 0.87 5400
26 200 0.08 0.3 1.6 0.46 4800
27 150 0.12 0.1 1.2 0.46 1800
28 200 0.08 0.1 0.8 0.37 1600
29 100 0.12 0.2 1.6 0.43 2400
30 100 0.16 0.1 1.6 0.69 1600
31 100 0.08 0.1 0.8 0.54 800
32 200 0.16 0.1 1.6 0.73 3200
33 100 0.08 0.3 1.6 0.36 2400
34 150 0.12 0.1 1.2 0.54 1800
35 100 0.08 0.3 1.6 0.36 2400
36 200 0.16 0.1 1.6 0.75 3200
37 200 0.08 0.1 0.8 0.41 1600
38 200 0.12 0.2 1.6 0.45 4800
39 100 0.16 0.1 1.6 0.66 1600
40 150 0.16 0.3 1.2 0.59 7200
41 150 0.08 0.2 1.2 0.35 2400
42 200 0.12 0.1 1.2 0.43 2400
43 100 0.16 0.2 0.8 1.61 3200
44 200 0.08 0.3 1.6 0.48 4800
45 150 0.12 0.3 0.8 0.87 5400
46 100 0.08 0.1 0.8 0.54 800
47 100 0.12 0.2 1.6 0.45 2400
Depth of cut has been found with the lowest contribution. In addition, it is clearly observed that the feed rate strongly affects the surface roughness parameter Ra. This input parameter has an increasing effect that should be expected. It is well known that the theoretical geometrical surface roughness is primarily a function of the feed rate for a given nose radius and varies with the square of the feed rate value.
This is in good agreement with the established following equation (Davim et al., 2008; Schultheiss et al., 2014).
.
(4)
where f is the feed rate in (mm/rev) and r is the nose radius of the tool in (mm).
Table 3
Analysis of variance for Ra
Source Sum of Squares df Mean Square FValue p-value
Model 4.55354735 12 0.37946228 454.016323 ˂0.0001
A-Vc 0.32731225 1 0.32731225 391.620233 ˂0.0001
B-f 0.11554926 1 0.11554926 138.251555 ˂0.0001
C-ap 0.09903889 1 0.09903889 118.497343 ˂0.0001
D-r 0.28633856 1 0.28633856 342.596325 ˂0.0001
AB 0.24064576 1 0.24064576 287.926119 ˂0.0001
AC 0.18507806 1 0.18507806 221.440873 ˂0.0001
AD 0.34212525 1 0.34212525 409.343581 ˂0.0001
BC 0.11949016 1 0.11949016 142.966729 ˂0.0001
BD 0.04523594 1 0.04523594 54.1235752 ˂0.0001
CD 0.00808913 1 0.00808913 9.67842809 0.00369834
A^2 0.00222189 1 0.00222189 2.65843242 0.11197006
B^2 0.02672432 1 0.02672432 31.9749217 ˂0.0001
Residual 0.02925265 35 0.00083579
Lack of Fit 0.01165265 2 0.00582632 10.9243577 ˂0.0001
Pure Error 0.0176 33 0.00053333
Cor Total 4.5828 47
Fig. 3. Perturbation plot for Ra
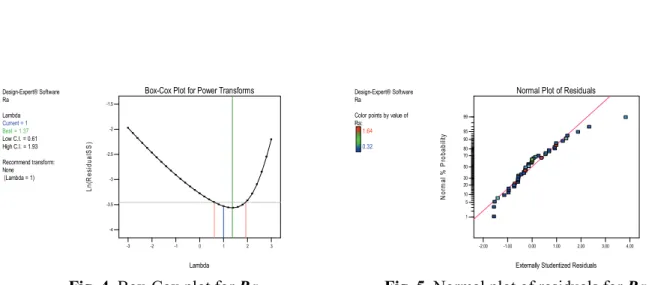
The Fig. 4 shows the Box-Cox plot for Ra. This plot provides a guideline for selecting the correct power law transformation (Osborne, 2010; Sakia, 1992).
A recommended transformation is listed, based on the best lambda value, which is found at the minimum point of the curve generated by the natural log of the sum of squares of the residuals. From this figure,
Design-Expert® Software Factor Coding: Actual Ra (µm)
Actual Factors A: Vc = 150.00 B: f = 0.12 C: ap = 0.20 D: r = 1.20
-1.000 -0.500 0.000 0.500 1.000
-0.5 0 0.5 1 1.5 2
A
A B
B C
C D
D Perturbation
Deviation from Reference Point (Coded Units)
Ra
(
µ
m
we can see that the current lambda value for the chosen law transformation is equal to 1 and its recommended value is equal to 1. For this, the chosen law transformation is shown in Eq. (5).
Ra = Ra a ∑ a X ∑ a X (5)
Fig. 4. Box-Cox plot for Ra Fig. 5. Normal plot of residuals for Ra
The normal plot of residuals for the surface roughness Ra was plotted in Fig. 5. The data follows the straight line (Sahoo & Mishra, 2014), closely. This indicates that the transformation of the response provides a good analysis, and the model proposed in Eq. (5) is adequate.
3.1.2 Productivity
The Table 4 shows ANOVA corresponding to the material removal rate MRR. This table shows that the effects of cutting speed Vc, depth of cut ap, feed rate f and the products Vc ×ap, Vc×f and ap×f are all significant.
Table 4
Analysis of variance for MRR
Source Sum of Squares df Mean Square FValue p-value
Model 7.863E+006 6 1.310E+006 3289.54 < 0.0001
A-Vc 2.018E+006 1 2.018E+006 5064.79 < 0.0001
B-f 2.225E+006 1 2.225E+006 5585.19 < 0.0001
C-ap 5.807E+006 1 5.807E+006 14576.89 < 0.0001
AB 69827.27 1 69827.27 175.28 < 0.0001
AC 1.863E+005 1 1.863E+005 467.54 < 0.0001
BC 3.656E+005 1 3.656E+005 917.80 < 0.0001
Residual 16333.58 41 398.38
Lack of Fit 16333.58 8 2041.70
Pure Error 0.000 33 0.000
Cor Total 7.879E+006 47
The perturbation plot in Fig. 6 shows a steep slope for depth of cut ap compared with feed rate f and cutting speed Vc. Consequently, the response is sensitive to these factors and the highest contribution comes with the depth of cut followed by feed rate and cutting speed. Fig. 7 shows the Box-Cox plot for
MRR. Consequently, the chosen lambda value for the law transformation for MRR is to 0.85 as shown in Eq. (6).
. a a X a X a X X (6)
Design-Expert® Software Ra
Lambda
Current = 1
Best = 1.37
Low C.I. = 0.61 High C.I. = 1.93 Recommend transform: None (Lambda = 1)
Lambda
Ln
(R
es
id
u
al
S
S
)
Box-Cox Plot for Power Transforms
-4 -3.5 -3 -2.5 -2 -1.5
-3 -2 -1 0 1 2 3
Design-Expert® Software Ra
Color points by value of Ra:
1.64
0.32
Externally Studentized Residuals
N
o
rm
a
l %
P
rob
ab
ili
ty
Normal Plot of Residuals
-2.00 -1.00 0.00 1.00 2.00 3.00 4.00
Fig. 6. Perturbation plot for MRR Fig. 7. Normal plot of residuals for MRR
The normal plot of residuals for the productivity MRR was plotted in Fig. 8. The data follows the straight line (Sahoo & Mishra, 2014), closely. This indicates that the response transformation provides a better analysis, and the model proposed in Eq. (6), is adequate.
Fig. 8. Normal plot of residuals for MRR
3.2 Mathematical models
The initial analysis of the responses obtained from RSM includes all parameters and their interactions. The relationship between the factors and the process response were modeled by full quadratic model (Choudhury & El-Baradie, 1999).
Based on Eq. (5) and Eq. (6), the roughness Ra and material removal rate MRR models in term of actual factors are given below in Eq. (7) and Eq. (8), respectively.
μ +0.33385‐1.275E‐3+36.510×f+14.271×ap–4.802×r–0.138Vc×f ‐ 0.053
Vc×ap–0.016Vc×r–59.128f×ap+12.213f×r +1.885ap×r+1.030E‐5Vc2–59.566f2
R-Squared = 0.9936; Adj R-Squared = 0.9914; Pred R-Squared = 0.9885; Adeq Precision = 85.298.
(7) Design-Expert® Software
Factor Coding: Actual MRR (mm3/min) Actual Factors A: Vc = 150.00 B: f = 0.12 C: ap = 0.20 D: r = 1.20
-1.000 -0.500 0.000 0.500 1.000 0 2000 4000 6000 8000 A A B B C C D D Perturbation
Deviation from Reference Point (Coded Units)
MR R ( mm3 /mi n ) Design-Expert® Software (MRR)^0.85 Lambda
Current = 0.85
Best = 0.85
Low C.I. = 0.75 High C.I. = 0.94 Recommend transform: Power (Lambda = 0.85)
Lambda L n (R esi d ua lS S )
Box-Cox Plot for Power Transforms
12 14 16 18 20 22
-3 -2 -1 0 1 2 3
Design-Expert® Software (MRR)^0.85
Color points by value of (MRR)^0.85:
1899.908
293.512
Externally Studentized Residuals
N or m a l % P rob abi lit y
Normal Plot of Residuals
According to the Eq. (7), the “Pred Squared” of 0.9885 is in reasonable agreement with the “Adj. R-Squared” of 0.9914; i.e. the difference is less than 0.2 “Adeq Precision” measures the signal to noise ratio. A ratio greater than 4 is desirable. The current ratio of 85.298 indicates an adequate signal. Consequently, this model can be used to navigate the design space.
. – . – . – . . ∗
. ∗ . ∗
.
R-Squared = 0.9979; Adj R-Squared = 0.9976; Pred R-Squared = 0.9970; Adeq Precision = 208.932.
(8)
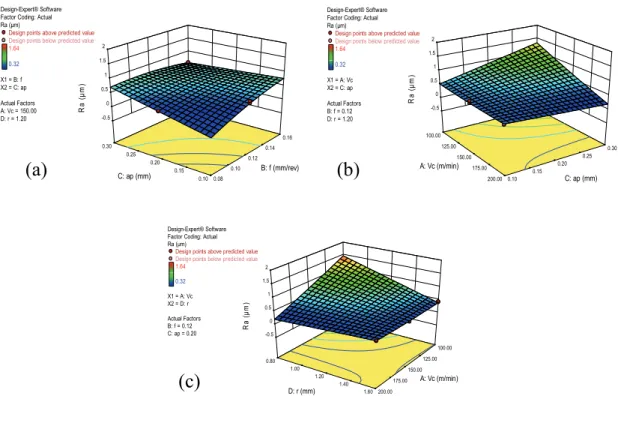
However, from the Eq. (8), the “Pred Squared” of 0.9970 is in reasonable agreement with the “Adj R-Squared” of 0.9976; i.e. the difference is less than 0.2. "Adeq Precision" measures the signal to noise ratio. A ratio greater than 4 is desirable. The current value of 208.932 indicates an adequate signal. Consequently, this model can be used to navigate the design space. Based on the model shown in Eq. (7) and from Fig. 9 (a), (b) and (c), that show 3D surface plot for Ra, it can be seen that for low feed rate, the surface roughness is highly sensitive to depth of cut (Fig. 9 (a)). An increase in the latter sharply degrades the surface finish. At highest values of feed rate, depth of cut has a contradictory effect, using middle values of cutting speed and radius nose. Nevertheless, this variation becomes smallest with highest values of cutting speed; using middle value of feed rate and radius nose (Fig. 9 (b)). In addition, it revealed that a combination of middle cutting speed along with lower feed rate, high radius nose and middle value of depth of cut is necessary for obtaining better surface finish. The highest value of surface roughness can be shown, when lower values of cutting speed and radius nose are used (Fig. 9 (c)).
Fig. 9. 3D surface plot for Ra
Design-Expert® Software Factor Coding: Actual Ra (µm)
Design points above predicted value
Design points below predicted value
1.64
0.32
X1 = B: f X2 = C: ap Actual Factors A: Vc = 150.00 D: r = 1.20
0.10 0.15 0.20 0.25 0.30 0.08 0.10 0.12 0.14 0.16 -0.5 0 0.5 1 1.5 2 Ra ( µ m )
B: f (mm/rev) C: ap (mm)
Design-Expert® Software Factor Coding: Actual Ra (µm)
Design points above predicted value
Design points below predicted value
1.64
0.32
X1 = A: Vc X2 = C: ap Actual Factors B: f = 0.12 D: r = 1.20
0.10 0.15 0.20 0.25 0.30 100.00 125.00 150.00 175.00 200.00 -0.5 0 0.5 1 1.5 2 Ra ( µ m )
A: Vc (m/min)
C: ap (mm)
Design-Expert® Software Factor Coding: Actual Ra (µm)
Design points above predicted value
Design points below predicted value
1.64
0.32
X1 = A: Vc X2 = D: r Actual Factors B: f = 0.12 C: ap = 0.20
0.80 1.00 1.20 1.40 1.60 100.00 125.00 150.00 175.00 200.00 -0.5 0 0.5 1 1.5 2 Ra ( µ m)
A: Vc (m/min) D: r (mm)
(a)
(b)
Fig. 10. 3D surface plot for MRR
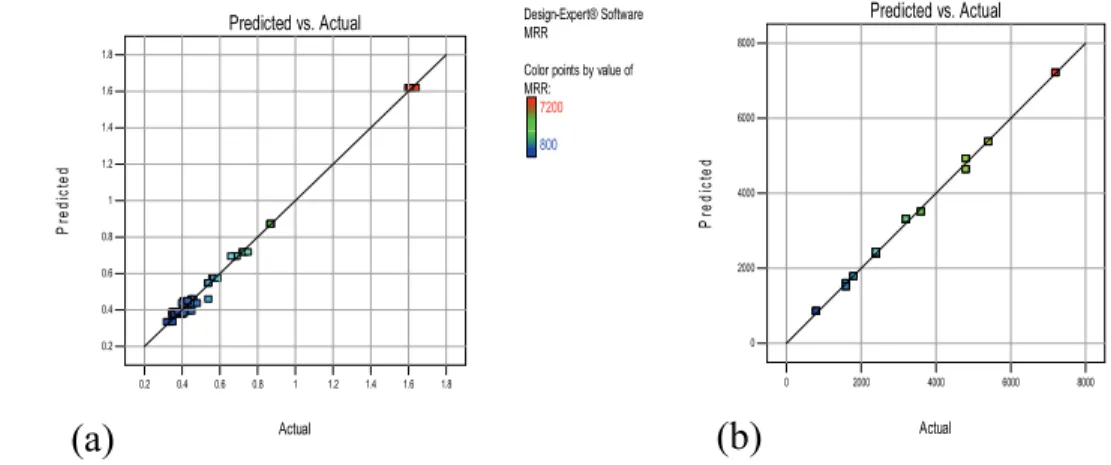
Concerning the material removal rate MRR and based on the Eq. (8), it can be observed from Fig. 10 (a), (b) and (c), that the highest MRR can be resulted with the combination of the highest Vc, higher ap and higher f. In addition, the lowest MRR value can be observed at lower values of Vc, ap and f. Depth of cut maintains the highest effect on productivity. The comparison between actual and predicted response for Ra and MRR is illustrated in Fig. 11(a) and (b) respectively. The results of comparison were proven to predict the surface roughness and material removal rate close to those readings recorded experimentally with a 95% confidence interval. According to those figures, it can be seen that points split is evenly by the 45 degree line. This reflects the good agreement between experimental values illustrated in Table 2 and predicted values obtained with models shown in Eq. (7) and Eq. (8).
Fig. 11. Comparison between predicted and experimental results (a) for Ra and (b) forMRR Design-Expert® Software
Factor Coding: Actual Original Scale MRR (mm3/min)
Design points above predicted value
7200 800
X1 = A: Vc X2 = B: f Actual Factors C: ap = 0.20 D: r = 1.20
0.08 0.10 0.12 0.14 0.16 100.00 125.00 150.00 175.00 200.00 0 2000 4000 6000 8000 M RR ( m m 3 /m in )
A: Vc (m/min) B: f (mm/rev)
Design-Expert® Software Factor Coding: Actual Original Scale MRR (mm3/min)
Design points above predicted value
Design points below predicted value 7200
800
X1 = A: Vc X2 = C: ap Actual Factors B: f = 0.12 D: r = 1.20
0.10 0.15 0.20 0.25 0.30 100.00 125.00 150.00 175.00 200.00 0 2000 4000 6000 8000 MR R ( m m3 /m in )
A: Vc (m/min) C: ap (mm)
Design-Expert® Software Factor Coding: Actual Original Scale MRR (mm3/min)
Design points above predicted value
Design points below predicted value
7200
800
X1 = B: f X2 = C: ap Actual Factors A: Vc = 150.00 D: r = 1.20
0.10 0.15 0.20 0.25 0.30 0.08 0.10 0.12 0.14 0.16 0 2000 4000 6000 8000 M RR ( m m 3 /m in )
B: f (mm/rev) C: ap (mm)
Design-Expert® Software Ra
Color points by value of Ra: 1.64 0.32 Actual P redi ct ed
Predicted vs. Actual
0.2 0.4 0.6 0.8 1 1.2 1.4 1.6 1.8
0.2 0.4 0.6 0.8 1 1.2 1.4 1.6 1.8
Design-Expert® Software MRR Color points by value of MRR: 7200 800 Actual Pr e d ic te d
Predicted vs. Actual
0 2000 4000 6000 8000
0 2000 4000 6000 8000
(a)
(b)
(c)
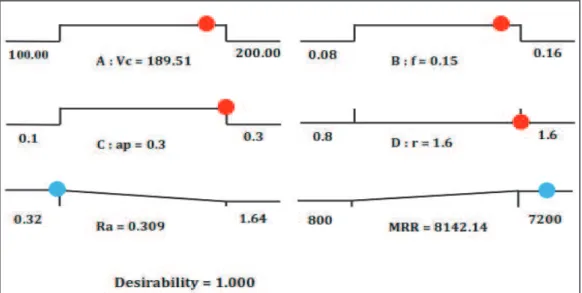
One of the main goals for the experiment is to investigate optimal values of cutting parameters. In order to obtain the desired value of the machined surface roughness Ra of the industrial product, which presents an agreement with higher productivity; using importance degrees for each output parameter (Table 5), the fixed value of 1.6 mm for tool nose radius r is given as an industrial constraint.
Joint optimization must satisfy the requirements for all the responses in the set. Optimization achievement is measured by the composite desirability which is the weighted geometric main of the individual desirability’s for the responses on a range from zero to one. Value of 1.0 represents the ideal case and zero indicates that one or more responses are outside acceptable limits (Sahoo & Mishra, 2014; Myers, 2016).
Table 5
Goals and parameter ranges for optimization of cutting conditions
Name Goal Lower
Limit
Upper
Limit Lower Weight Upper Weight Importance
A : Vc Is in range 100 200 1 1 3
B : f Is in range 0.08 0.16 1 1 3
C : ap Is in range 0.1 0.3 1 1 3
D : r Is equal to 1.6 0.8 1.6 1 1 3
Ra : Maximise 0.32 1.64 1 1 3
MRR : Maximise 800 7200 1 1 3
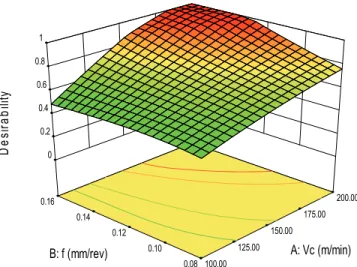
The optimum cutting parameters obtained with the importance degrees of 3 for Ra and MRR are chosen in term of highest desirability value (Fig. 12) to be cutting speed of 189.51 m/min, feed rate of 0.15 mm/rev and cutting depth of 0.3 mm using tool nose radius of 1.6 mm. The predicted responses are Ra = 0.30 µm and 8142.14 mm3/min for MRR with desirability value of 1.00 as shown in Fig. 13; which presents solution ramps of multi-objective optimization (Tebassi et al., 2016b).
Fig. 12. 3D surface plot for desirability
Design-Expert® Software Factor Coding: Actual Desirability
1
0
X1 = A: Vc X2 = B: f
Actual Factors C: ap = 0.30 D: r = 1.60
0.08 0.10 0.12 0.14 0.16
100.00 125.00
150.00 175.00
200.00 0
0.2 0.4 0.6 0.8
1
D
e
s
ir
a
b
ili
ty
Fig. 13. Solution ramps of multi-objective optimization
3.4 Industrial benefit
In order to summarize the industrial importance of this presented research, the benefits in surface quality and in productivity are illustrated. Indeed, Fig. 14 (a) and (b) show medium value, optimal value and the obtained benefit for Ra and MRR, respectively. From Fig. 14 (a) it can be seen that the medium value for Ra is equal to 0.565 µm and 0.30 µm for its optimal value. Consequently, from this approach, the benefit in surface roughness is equal to 46.9 %. For the productivity, it can be observed in the Fig. 14 (b) that the medium value for MRR was 3125 mm3/min and the optimal value was 8142.14 mm3/min. Consequently, the benefit obtained from this approach in productivity was 160.54 %.
Fig. 14. (a) Improvement in surface quality and (b) industrial benefit in productivity
4. Conclusions
The current investigation was based on RSM using fraction of design space (FDS) plot for design evaluation and Box-Cox plots for developing mathematical models and improving their normality. The desirability approach was followed for the optimizing surface roughness and productivity based on cutting parameters (cutting speed, feed rate, depth of cut and nose radius). The important findings can be summarized as follows:
Benifit Medium value Optimal value 46.9 %
0.565 µm
0.30 µm
Benifit Medium
value
Optimal value 160.54 %
3125 mm3/min
8142.14 mm3/min
(b) Productivity
1. Based on the fraction of design space plot, 78 % of the current designs maintained a standard error mean inferior or equal to 0.997 representing the best effectiveness of design;
2. The Box-Cox transformation improved significantly the normality and provided a good correlation for models. Indeed, the R2 for the surface roughness model was equal to 0.9936 and for the
productivity model was equal to 0.9979;
3. The signal to noise ratios (Adeq Precision) of about 85.298 for surface roughness model and 208.932
for productivity model have indicated an adequate signal. Consequently, these models can be used to navigate the design space;
4. Cutting speed, feed rate and nose radius have the greatest influences on surface roughness; 5. Depth of cut has the greatest influence on the productivity;
6. It has been found for the tested material that the optimal combination of cutting parameters for the obtained roughness Ra (0.30 µm) and the productivity (8142.14 mm3/min) was 189.51 m/min for
Vc, 0.3 mm for ap,0.15 mm/rev for fand 1.6 mm for r.
7. Using optimal cutting conditions, the benefit in productivity registered was about 160.54 % accompanied with an improvement in surface quality of 46.9 %
Regarding the current investigation, the multi-objective optimization methodology proposed can be considered as a powerful approach based on graphical tool for design evaluation (FDS plot) and a design improved modeling step for the best correlation. It can offer to scientific researchers and industrial metalworking a helpful for choice, comparing designs, improvement normality of models used to navigate the design space, and multi-objective optimization procedure for various combinations of input (Workpiece hardness, tool material, tool geometry …) and output (surface finish, productivity, surface integrity …) parameters of machining process.
Acknowledgements
This work was achieved in the laboratories LMS (University of Guelma Algeria) in collaboration with Acoustic Vibration Laboratory (INSA-Lyon, France). The authors would like to thank the Algerian Ministry of Higher Education and Scientific Research (MESRS) and the Delegated Ministry for Scientific Research (MDRS) for granting financial support for CNEPRU Research Project, CODE: A11N01UN240120140013 (University 08 May 1945, Guelma).
References
Altin, A., Nalbant, M., & Taskesen, A. (2007). The effects of cutting speed on tool wear and tool life
when machining Inconel 718 with ceramic tools. Materials & design, 28(9), 2518-2522.
Anderson-Cook, C. M., Borror, C. M., & Montgomery, D. C. (2009). Response surface design evaluation
and comparison. Journal of Statistical Planning and Inference, 139(2), 629-641.
Borkowski, J. J. (2009). Discussion of “Response surface design evaluation and comparison” by
Christine Anderson-Cook, Connie Borror, and Douglas Montgomery. Journal of Statistical Planning
and Inference, 139(2), 650-652.
Box, G. E., & Cox, D. R. (1964). An analysis of transformations. Journal of the Royal Statistical Society.
Series B (Methodological), 26(2), 211-252.
Choudhury, I. A., & El-Baradie, M. A. (1999). Machinability assessment of inconel 718 by factorial
design of experiment coupled with response surface methodology. Journal of Materials Processing
Technology, 95(1), 30-39.
Anderson-Cook, C. M., Borror, C. M., & Montgomery, D. C. (2009). Response surface design evaluation
and comparison. Journal of Statistical Planning and Inference, 139(2), 629-641.
Darwish, S. M. (2000). The impact of the tool material and the cutting parameters on surface roughness
Davim, J. P., Gaitonde, V. N., & Karnik, S. R. (2008). Investigations into the effect of cutting conditions
on surface roughness in turning of free machining steel by ANN models. Journal of materials
processing technology, 205(1), 16-23.
El-Wardany, T. I., Mohammed, E., & Elbestawi, M. A. (1996). Cutting temperature of ceramic tools in high speed machining of difficult-to-cut materials. International Journal of Machine Tools and Manufacture, 36(5), 611-634.
Ezugwu, E. O., Wang, Z. M., & Machado, A. R. (1999). The machinability of nickel-based alloys: a review. Journal of Materials Processing Technology,86(1), 1-16.
Ezugwu, E. O., & Tang, S. H. (1995). Surface abuse when machining cast iron (G-17) and nickel-base superalloy (Inconel 718) with ceramic tools. Journal of Materials Processing Technology, 55(2), 63-69.
Gaitonde, V. N., Karnik, S. R., Figueira, L., & Davim, J. P. (2009). Machinability investigations in hard turning of AISI D2 cold work tool steel with conventional and wiper ceramic inserts. International Journal of Refractory Metals and Hard Materials, 27(4), 754-763.
Gatto, A., & Iuliano, L. (1997). Advanced coated ceramic tools for machining superalloys. International Journal of Machine Tools and Manufacture, 37(5), 591-605.
Guo, Y., Loenders, J., Duflou, J., & Lauwers, B. (2012). Optimization of energy consumption and surface quality in finish turning. Procedia CIRP, 1, 512-517.
Jones, B. (2009). Discussion of “Response surface design evaluation and comparison” by Christine Anderson-Cook, Connie Borror and Douglas Montgomery. Journal of Statistical Planning and Inference, 139(2), 642-644.
Khuri, A. I. (2009). Discussion of “Response surface design evaluation and comparison” by Christine M. Anderson-Cook, Connie M. Borror, Douglas C. Montgomery. Journal of Statistical Planning and Inference, 139(2), 647-649.
Kitagawa, T., Kubo, A., & Maekawa, K. (1997). Temperature and wear of cutting tools in high-speed machining of Inconel 718 and Ti 6Al 6V 2Sn.Wear, 202(2), 142-148.
Kose, E., Kurt, A., & Seker, U. (2008). The effects of the feed rate on the cutting tool stresses in machining of Inconel 718. Journal of Materials Processing Technology, 196(1), 165-173.
Li, L., He, N., Wang, M., & Wang, Z. G. (2002). High speed cutting of Inconel 718 with coated carbide and ceramic inserts. Journal of Materials Processing Technology, 129(1), 127-130.
Myers, R. H., Montgomery, D. C., & Anderson-Cook, C. M. (2016). Response surface methodology: process and product optimization using designed experiments. John Wiley & Sons.
Nalbant, M., Altın, A., & Gökkaya, H. (2007). The effect of cutting speed and cutting tool geometry on machinability properties of nickel-base Inconel 718 super alloys. Materials & Design, 28(4), 1334-1338.
Narutaki, N., Yamane, Y., Hayashi, K., Kitagawa, T., & Uehara, K. (1993). High-speed machining of Inconel 718 with ceramic tools. CIRP Annals-Manufacturing Technology, 42(1), 103-106.
Osborne, J. W. (2010). Improving your data transformations: Applying the Box-Cox transformation. Practical Assessment, Research & Evaluation, 15(12), 1-9.
Pawade, R. S., Sonawane, H. A., & Joshi, S. S. (2009). An analytical model to predict specific shear energy in high-speed turning of Inconel 718. International Journal of Machine Tools and Manufacture, 49(12), 979-990.
Piepel, G. F. (2009). Discussion of “Response surface design evaluation and comparison” by CM Anderson-Cook, CM Borror, and DC Montgomery. Journal of Statistical Planning and Inference, 139(2), 653-656.
Sakia, R. M. (1992). The Box-Cox transformation technique: a review. The Statistician, 41(2), 169-178. Sahoo, A. K., & Mishra, P. C. (2014). A response surface methodology and desirability approach for
predictive modeling and optimization of cutting temperature in machining hardened steel. International Journal of Industrial Engineering Computations, 5(3), 407- 416.
Schultheiss, F., Hägglund, S., Bushlya, V., Zhou, J., & Ståhl, J. E. (2014). Influence of the minimum chip thickness on the obtained surface roughness during turning operations. Procedia CIRP, 13, 67-71.
Sharman, A., Dewes, R. C., & Aspinwall, D. K. (2001). Tool life when high speed ball nose end milling Inconel 718™. Journal of Materials Processing Technology, 118(1), 29-35.
Sharman, A. R. C., Hughes, J. I., & Ridgway, K. (2006). An analysis of the residual stresses generated in Inconel 718™ when turning. Journal of Materials Processing Technology, 173(3), 359-367. Tebassi, H., Yallese, M., & Meddour, I. (2016a). A new method for evaluation nominal coefficient of
friction and frictional forces in turning and inserts characterization using cutting forces profiles. Engineering Solid Mechanics, 4(1), 1-10.
Tebassi, H., Yallese, M., Khettabi, R., Belhadi, S., Meddour, I., & Girardin, F. (2016b). Multi-objective optimization of surface roughness, cutting forces, productivity and Power consumption when turning of Inconel 718. International Journal of Industrial Engineering Computations, 7(1), 111-134. Tebassi, H., Yallese, M., Meddour, I., Girardin, F. & Mabrouki, T. (2017). On the modeling of surface
roughness and cutting force when turning of inconel 718 using artificial neural network and response rurface methodology: accuracy and benefit. Periodica Polytechnica Mechanical Engineering, 61(1), 1-11.
Yadav, R. K., Abhishek, K., & Mahapatra, S. S. (2015). A simulation approach for estimating flank wear and material removal rate in turning of Inconel 718.Simulation Modelling Practice and Theory, 52, 1-14.
Zhou, J. M., Bushlya, V., & Stahl, J. E. (2012). An investigation of surface damage in the high speed turning of Inconel 718 with use of whisker reinforced ceramic tools. Journal of Materials Processing Technology, 212(2), 372-384.
Zhuang, K., Zhu, D., Zhang, X., & Ding, H. (2014). Notch wear prediction model in turning of Inconel 718 with ceramic tools considering the influence of work hardened layer. Wear, 313(1), 63-74.