International Journal of Industrial Engineering Computations 7 (2016) 257–266
Contents lists available at GrowingScience
International Journal of Industrial Engineering Computations
homepage: www.GrowingScience.com/ijiec
Analysis of surface roughness and cutting force during turning of Ti6Al4V ELI in dry environment
V. G. Sargadea, S. R. Nipanikara* and S. M. Meshramb
aProfessor, Department of Mechanical Engineering, Dr. Babasaheb Ambedkar Technological University, Lonere-402103, Maharashtra, India bPG Student, Department of Mechanical Engineering, Dr. Babasaheb Ambedkar Technological University, Lonere-402103, Maharashtra, India C H R O N I C L E A B S T R A C T
Article history: Received July 22 2015 Received in Revised Format Septmber17 2015
Accepted October 14 2015 Available online October 15 2015
This paper investigates the effect of cutting parameters on the surface roughness and cutting force of titanium alloy Ti-6Al-4V ELI when turning using PVD TiAlN coated tool in dry environment. Taguchi L9 orthogonal array design of experiment was used for the turning experiment 2 factors and 3 levels. Turning parameters studied were cutting speed (50, 65, 80 m/min), feed rate (0.08, 0.15, 0.2 mm/rev) and depth of cut 0.5 mm constant. Linear and second order model of the surface roughness and cutting force has been developed in terms of cutting speed and feed. The results show that the feed rate was the most impact factor controlling the cutting force and surface roughness produced. MINITAB 17software was used to develop a linear and second order model of surface roughness and cutting force. Optimum condition was at 66.97 m/min of cutting speed, 0.08 mm/rev of feed rate. Surface roughness 0.57μm and cutting force 54.02 N were obtained at the optimum condition. A good agreement between the experimental and predicted surface roughness and cutting force were observed.
© 2016 Growing Science Ltd. All rights reserved
Keywords:
Ti6Al4V ELI Surface roughness PVD TiAlN Dry environment
1. Introduction
The surface quality of components are generally determined in terms of the measured surface roughness. Surface roughness also affects several functional attributes of component like friction, light reflection, heat transmission, coating and ability of distributing and holding a lubricant. Ti-6Al-4V ELI alloy (Extra Low Interstitial) has low oxygen, carbon, and iron content. It is used in biomedical applications such as medical gadgets, orthopedic transplants, and is the ultimate grade for marine and cryogenic applications, and some significant aerospace components. Asiltürk et al. (2012) investigated that the main effect of the feed rate was the most significant factor on the workpiece surface roughness (Ra and Rz) with the percent
impact of 85.5% in bringing down the average roughness values in both Taguchi and response surface analysis. It was also found that RSM to be effective for the identification and development of important relationships between cutting parameters. Axinte et al. (2002) found that no considerable changes in microstructure and micro-hardness below the machined surface. These effects mainly seem due to thermal and mechanical cycling, microstructural transformations, and mechanical and thermal
* Corresponding author.
deformations during machining processes. Ezugwu et al. (1997) explored that the main difficulties related with the machining of titanium as well as tool wear and the mechanisms accountable for tool failure. Increasing the productivity and the quality of the machined parts are the main challenges of industry; there has been increased curiosity in checking all aspects of the machining process.
Haron et al. (2005) explored that titanium alloys are generally used for a component, which requires the greatest reliability; therefore the surface integrity must be maintained. Straight grade cemented carbides are suitable for use in machining titanium alloy 64. The wear resistance and cutting edge strength of insert CNMG 120408-883 are superior to insert CNMG 120408-890.
Haron et al. (2011) found that the feed was the most dominant factor influencing the surface roughness. Acceptable surface roughness achieved when cutting speed was 160 m/min; feed was 0.18 mm/rev and depth of cut was 1 mm. Ibrahim et al. (2009) found that surface roughness more affected by feed rate and nose radius in turning of Ti6Al4V ELI in dry environment. Machined surface acceptable and free from physical damage viz; cracks and tears. Ibrahim et al. (2011) explored that machining of titanium alloy at the high feed rate produced the high and uneven surface roughness but when the cutting speed increases surface roughness decreases. Ramesh et al. (2008) explored that surface roughness increases due to high feed, but the increased cutting speed decreases the surface roughness.
Revankar et al. (2014) found that the surface roughness is minimum in minimum quantity lubrication environment as compared to dry and flood condition. The surface roughness decreases with increased cutting speed and nose radius, whereas the surface roughness increases with increased feed rate and depth of cut. The cutting speed (72.32 %) and feed rate (17.49 %) have major effects on minimizing surface roughness. Shetty et al. (2014) investigated that the influence of lubrication was highest physical as well as statistical on surface roughness of about 95.1% when turning Ti6Al4V by using PCBN tool under dry and near dry environment. Suhail et al. (2010) found that the workpiece surface temperature can be sensed and used effectively as an indicator to control the cutting performance and improves the optimization process. Surface roughness measurement presents important assignment in many engineering applications. Ulutan et al. (2011) observed that the surface roughness results are found to be lower in fresh cutting tools as compared to those measured when using slightly used cutting tool. They found that higher surface roughness is observable for worn tools. Zoya et al. (2000) found that adequate surface finish can be obtained during machining titanium alloys at the speed range of 185–220 m/min. In this universal context the aim of this paper is to optimize and predicted surface roughness and cutting forces when machining of titanium alloy Ti-6Al-4V ELI by using PVD TiAlN insert in turning process under dry environment. Cutting conditions such as cutting speed and feed were adopted for this study whereas depth of cut was constant 0.5 mm. Quadratic model have been developed with 95% confidence level.
2. Experimental Procedures
2.1 Workpiece material
The workpiece material used in the experiments was in the form of a cylinder bar of alpha-beta titanium alloy Ti-6Al-4V ELI. The compositions of the alloys (in wt. %) are given in Table 1.
Table 1
Chemical composition of the titanium alloy Ti6Al4V ELI
Composition C Si Fe Al N V S O H Ti
Wt % 0.08 0.03 0.22 6.1 0.006 3.8 0.003 0.12 0.003 Balance
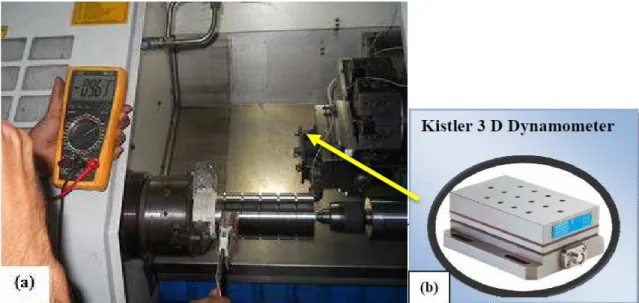
Fig. 1. (a) Photographic view of Kistler 3-D Dynamometer during turning;
(b) Kistler 3-D Dynamometer unit
2.2 Cutting tool material
A cutting tool insert with ISO designation CNMG 120408-QM-1105 PVD TiAlN was used for the machining experiments. The photographic view of PVD TiAlN insert is shown in Fig. 2.
Fig. 2. Photographic view of PVD TiAlN coated insert
2.3 Scratch test
Photographic view of scratch
Fig. 3. Variation of normal load and coefficient of friction with scratch length during scratch test on
TiAlN coated insert
2.4 Machining tests
All the machining experiments were carried out on a ACE CNC LATHE JOBBER XL, which FANUC Oi Mate- TC as a controller. During the experiments, the combinations of the parameter values were designed by using L9 orthogonal array design of experiment. The cutting speeds were set at 50, 65 and 80 m/min, while the feed rates were 0.08, 0.15 and 0.2 mm/rev. The depth of cut was 0.5 mm is constant during the machining process. The machining experiments were carried out in dry environment. The combinations of parameters used are shown in Table 2.
Table 2
Combination of cutting parameters were used in the experiment
Run Cutting speed (m/min) Feed (mm/rev) Depth of cut (mm)
1 50 0.08 0.5
2 50 0.15 0.5
3 50 0.2 0.5
4 65 0.08 0.5
5 65 0.15 0.5
6 65 0.2 0.5
7 80 0.08 0.5
8 80 0.15 0.5
9 80 0.2 0.5
Meanwhile, the cutting conditions in this experiment are shown in Table 3.
Table 3
Cutting condition for experimental works
Machine tool ACE CNC LATHE JOBBER XL, FANUC Oi Mate- TC as a controller Work specimen Material Titanium alloy, Ti-6Al-4V ELI
Cutting tool (insert) Cutting insert : Carbide, ISO CNMG 120408-QM-1105 Sandvick (PVD TiAlN) Tool holder PCLNL 2525 M12
Process parameters Cutting speed (Vc) : 50, 65 and 80 m/min Feed (f): 0.08, 0.15 and 0.2 mm/rev Depth of cut (d): 0.5mm
Machining Environment Dry
= 78 N )
C
Design layout and experimental results shown in Table 4.
Table 4
Design layout and Experimental Result
Run Cutting speed
(m/min)
Feed (mm/rev)
Depth of cut (mm)
Surface Roughness (µm)
Cutting Force (N)
1 50 0.08 0.5 0.67 60.01
2 50 0.15 0.5 0.88 90.76
3 50 0.2 0.5 1.17 115.9
4 65 0.08 0.5 0.57 54.16
5 65 0.15 0.5 0.87 85.3
6 65 0.2 0.5 1.04 105.6
7 80 0.08 0.5 0.65 57.4
8 80 0.15 0.5 0.85 81.33
9 80 0.2 0.5 1.13 109.9
3. Results and Discussions
Surface roughness and Cutting force
In the experiments there were 9 experimental results used to investigate the effect of machining parameters on measured surface roughness and cutting force. The analysis of variance was applied to study the influence of the input parameters on the surface roughness. It exposes that quadratic model is the best fitting model. The most significant factor is feed rate which influencing on surface roughness and cutting force.
Development of the surface roughness model and cutting force model
Considering the surface roughness and cutting force values as response factor, and cutting parameters as input parameters; it is possible to achieve a linear, second order equation expressing the relationship between the response and input parameters.
3.1 Linear model
The dependent variable surface roughness and cutting force can be considered as a linear combination of the independent variables. Regression analysis is employed to the experimental data in order to obtain the coefficients of this equation.
Ra = 0.364 - 0.00100 Vc + 3.986 f
( R2 = 95.17%, Ra2 = 93.56% )
Fc =34.20 – 0.2004 Vc + 441.7 f
(R2 = 98.32%, Ra2 = 97.77%)
3.2 Second order model
Second order surface roughness model developed by using MINITAB software and the equation is established as follows.
Ra= 1.706 - 0.0378 Vc + 0.76 f + 0.000289 Vc xVc + 12.94 f x f - 0.0055 Vc x f
( R2 = 98.62%, R
a2 =96.33% )
Fc= 111.9 – 2.47 Vc + 317 f + 0.01865 Vc xVc + 706 f x f – 1.09 Vc x f
( R2 = 99.49%, Ra2 =98.65% )
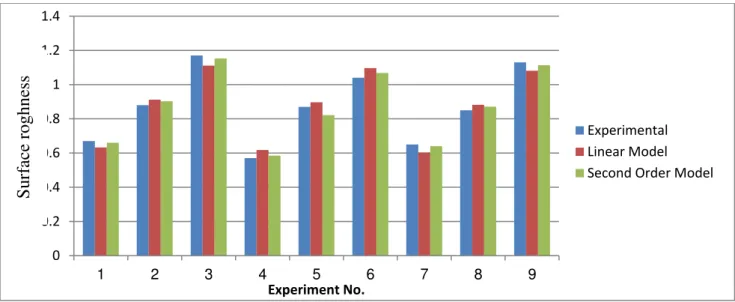
Fig. 4. Comparison of Experimental and Predicted values for Surface Roughness
Fig. 5. Comparison of Experimental and Predicted values for Cutting Force
The values calculated using all the equations generated for surface roughness and cutting force models were compared with the experimental measurements, for the purpose of determining the most suitable model. Moreover the cutting parameters (cutting speed, feed rate), the experimental surface roughness and cutting force results were entered as inputs. Surface roughness (Ra) and cutting force (Fc) values
were calculated for each cutting speed, feed rate. However, considering the total average errors, it is clear that the second order model represents the most reliable method.
3.3 Analysis of Variance
ANOVA technique can be useful for determining effect of input parameters from a series of experimental results by design of experiments for machining process and it can be used to interpret experimental data. The obtained results are analyzed by statistical analysis software (Minitab-17) which is extensively used in many engineering applications. The ANOVA table consists of a sum of squares and degrees of freedom. The ratio of sum of squares to degrees of freedom is called as mean square and F ratio is the mean square ratio to the mean square of the experimental error. Table 5 shows analysis of variance for surface roughness and Table 6 shows analysis of variance for cutting force. This analysis was carried out
for a significance level of α = 0.05, i. e. for a confidence level of 95%. 0
0.2 0.4 0.6 0.8 1 1.2 1.4
1 2 3 4 5 6 7 8 9
SSu
rf
a
ce
Ro
u
g
h
n
es
s
Experiment No.
Experimental
Linear Model Second Order Model
0 20 40 60 80 100 120 140
1 2 3 4 5 6 7 8 9
C
u
tti
n
g
F
o
rc
e
(N)
Experiment No.
Experimental
Linear Model
Second Order Model
C
uttin
g F
orc
e (N
)
S
ur
face r
og
hn
Table 5
Analysis of variance for surface roughness (Ra)
Source DF Adj SS Adj MS F-Value P-Value % contribution
Vc 2 0.009800 0.004900 3.82 0.118 2.68
f 2 0.350467 0.175233 136.55 0.000 95.91
Error 4 0.005133 0.001283 1.41
Total 8 0.365400 100
Table 6
Analysis of variance for cutting force (Fc)
Source DF Adj SS Adj MS F-Value P-Value % contribution
Vc 2 89.46 44.73 6.86 0.051 2.04
f 2 4265.35 2132.68 327.19 0.000 97.34
Error 4 26.07 6.52 0.62
Total 8 4380.89 100
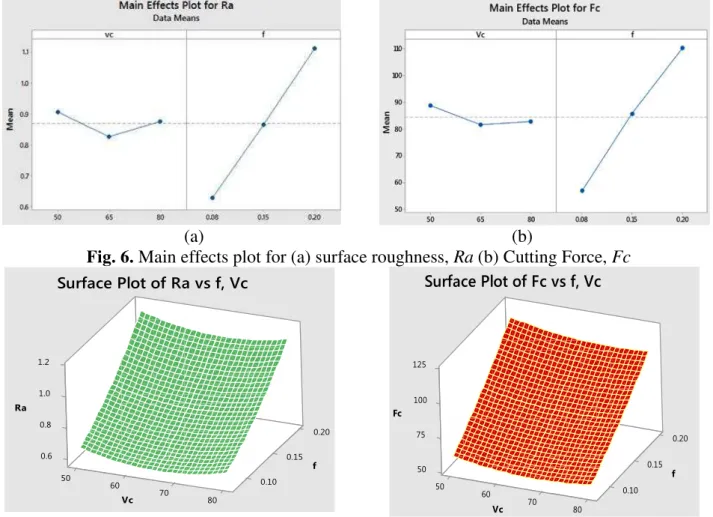
It was found that surface roughness ranged from 0.57 to 1.17μm and cutting force ranged from 54.16 to 115.9 N. Figure 6 shows that the main effects plot for surface roughness (Ra) and cutting force (Fc) indicates that surface roughness and cutting force is influenced by feed rate significantly.
(a) (b)
Fig. 6. Main effects plot for (a) surface roughness, Ra (b) Cutting Force, Fc
(a) (b)
Fig. 7. a) Surface roughness in 3D plot b) Cutting Force in 3D plot when depth of cut 0.5 mm
Fig. 7 shows that the cutting speed is kept constant at 50 m/min or 65 m/min or 80 m/min and the feed rate is varied at 0.08, 0.15 and 0.2 mm/rev, resulted in intensely increased in surface roughness at higher feed rate because of less available time to carry out the heat from the cutting zone, high amount of material removal rate and accumulation of chip between tool work piece zones. It can be revealed that
50 60 0 7 50 5 7 100 0 8
lower surface roughness values are obtained at higher cutting speeds due to lower forces generated. At high cutting speed, an improvement in surface finish was obtained since less heat was dissipated to the workpiece. It is known that the amount of heat generation increases with increase in feed rate, because the cutting tool has to remove more volume of material from the workpiece.
4. Optimization of Response
Most unique important aims of experiments related to machining is to achieve the desired surface roughness and cutting force with the optimal cutting parameters. To attain this end, the RSM optimization seems to be a helpful technique. Here, the goal is to minimize surface roughness (Ra) and cutting forces
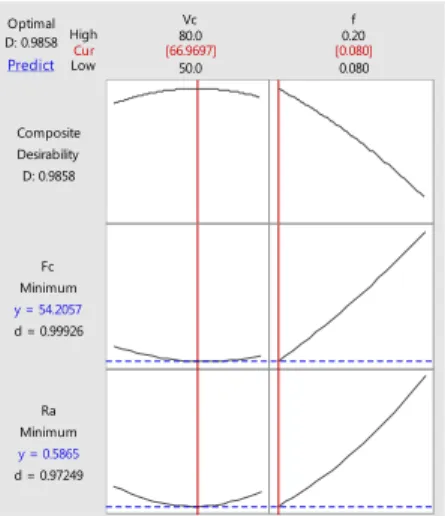
(Fc). Fig. 8 shows the response optimization for surface roughness and cutting force.
Fig. 8. Response Optimization for Surface Roughness and Cutting Force
After optimization process the results are obtained in uncoded. The optimized values of input process parameters for all the responses are shown in the Table 7.
Table 7
Optimization Result
Response
Optimized Value of
Input Process variables Predicted Response Value Cutting Speed, Vc (m/min) Feed, f (mm/rev)
Surface Roughness, Ra (μm) 66.97 0.08 0.5865
Cutting Force 66.97 0.08 54.2057
On the basis of second order surface roughness model the predicted results according to the optimized input process parameters are given in the Table 7. Confirmation test is done to check the acceptability of the developed second order model and the experimental results thus found on the basis of optimized input parameters are given in Table 8. It could be observed that the predicted results are in acceptable zone with respect to the experimental results and thus it is concluded that the developed model seems to be acceptable.
Table 8
Result of Confirmation Test
Response Response Value
Predicted Experimental
Surface Roughness, Ra (μm) 0.5865 0.57
Cutting Force, Fc (N) 54.2057 54.02
5. Conclusions
The following can be concluded from the results obtained when turning of titanium alloy Ti-6Al-4V ELI under dry environment using PVD TiAlN cutting tool:
Cur High
Low D: 0.9858 Optimal
Predict
d = 0.99926 Minimum
Fc
y = 54.2057
d = 0.97249 Minimum
Ra
y = 0.5865
D: 0.9858 Desirability Composite
0.080 0.20
50.0 80.0
f Vc
1. Feed rate is the most significant factor influencing the surface roughness. In this experiment the range values of surface roughness between 0.57 – 1.17μm.
2. Based on the analysis of the variance (ANOVA) results, the highly effective parameters on both the surface roughness and cutting forces were determined. Namely, the feed rate parameter is the main factor that has the highest importance on the surface roughness and accounts for 95.91% contribution in the total variability of the model. The cutting force is affected strongly by the feed rate and account for 97.34% contribution in the total variability of model.
3. The optimum cutting parameters was obtained using MINITAB 17 software, at cutting speed of 66.97 m/min and feed rate of 0.08 mm/rev. Optimum parameters have produced the accepted surface roughness, Ra, of 0.57μm was obtained and cutting force, Fc, of 54.02 N.
4. An improvement in surface quality and lower cutting forces are observed at higher cutting speed with lower feed rate.
5. The developed model has high square values of the regression coefficients which showed high association with variances in the predictor values.
6. The established second order model seems to be suitable.
References
Asiltürk, I., & Neşeli, S. (2012). Multi response optimization of CNC turning parameters via Taguchi method
-based response surface analysis. Measurement, 45(4), 785-794.
Axinte, D. A., & Dewes, R. C. (2002). Surface integrity of hot work tool steel after high speed milling-experimental data and empirical models. Journal of Materials Processing Technology, 127(3), 325-335.
Calamaz, M., Coupard, D., & Girot, F. (2008). A new material model for 2D numerical simulation of serrated chip formation when machining titanium alloy Ti–6Al–4V. International Journal of Machine Tools and
Manufacture, 48(3), 275-288.
Che-Haron, C. H., & Jawaid, A. (2005). The effect of machining on surface integrity of titanium alloy Ti–6% Al– 4% V. Journal of Materials Processing Technology, 166(2), 188-192.
Ezugwu, E. O., & Wang, Z. M. (1997). Titanium alloys and their machinability- a review. Journal of materials
processing technology, 68(3), 262-274.
Ginting, A., & Nouari, M. (2009). Surface integrity of dry machined titanium alloys. International Journal of
Machine Tools and Manufacture, 49(3), 325-332.
Haron, C. C., & Jawaid, A. (2005). The effect of machining on surface integrity of titanium alloy
Ti-6Al-4V. Journal of Materials Processing Technology, 166, 188-192.
Haron, C. C., Ginting, A., & Arshad, H. (2007). Performance of alloyed uncoated and CVD-coated carbide tools in dry milling of titanium alloy Ti-6242S.Journal of Materials Processing Technology, 185(1), 77-82.
Haron, C. H., Ghani, J. A., Sulaiman, M. A., Intan, L. R., & Kasim, M. S. (2011). The Effect of Minimal Quantity Lubrication (MQL) on the Surface Roughness of Titanium Alloy Ti-6Al-4V ELI in Turning Process. Advanced
Materials Research, 146, 1750-1753.
Ibrahim, G. A., Che Haron, C. H., & Ghani, J. A. (2010). Tool wear mechanism in continuous cutting of difficult-to-cut material under dry machining. Advanced Materials Research, 126, 195-201.
Ibrahim, G. A., Che Haron, C. H., & Ghani, J. A. (2011, July). Evaluation of PVD-Inserts Performance and Surface Integrity when Turning Ti-6Al-4V ELI under Dry Machining. In Advanced Materials Research (Vol. 264, pp. 1050-1055).
Ibrahim, G. A., Haron, C. C., & Ghani, J. A. (2009). Progression and wear mechanism of CVD carbide tools in turning Ti-6Al-4V ELI. International Journal of Mechanical and Materials Engineering, 4(1), 35-41.
Ibrahim, G. A., Haron, C. C., & Ghani, J. A. (2009). The effect of dry machining on surface integrity of titanium alloy Ti-6Al-4V ELI. Journal of Applied Sciences, 9(1), 121-127.
Ibrahim, G. A., Haron, C. C., & Ghani, J. A. (2009). The effect of dry machining on surface integrity of titanium alloy Ti-6Al-4V ELI. International Journal of Mechanical and Materials Engineering,4(2), 191-196.
Jawaid, A., Sharif, S., & Koksal, S. (2000). Evaluation of wear mechanisms of coated carbide tools when face milling titanium alloy. Journal of Materials Processing Technology, 99(1), 266-274.
Liao, Y. S., & Shiue, R. H. (1996). Carbide tool wear mechanism in turning of Inconel 718 superalloy. Wear, 193(1), 16-24.
Makadia, A. J., & Nanavati, J. I. (2013). Optimisation of machining parameters for turning operations based on response surface methodology. Measurement,46(4), 1521-1529.
Mantle, A. L., & Aspinwall, D. K. (1997). Surface integrity and fatigue life of turned gamma titanium aluminide. Journal of materials processing technology,72(3), 413-420.
Mantle, A. L., & Aspinwall, D. K. (2001). Surface integrity of a high speed milled gamma titanium aluminide. Journal of Materials Processing Technology, 118(1), 143-150.
Özel, T., & Zeren, E. (2007). Finite element modeling the influence of edge roundness on the stress and temperature fields induced by high-speed machining. The International Journal of Advanced Manufacturing
Technology,35(3-4), 255-267.
Pandey, A. K., & Dubey, A. K. (2012). Simultaneous optimization of multiple quality characteristics in laser cutting of titanium alloy sheet. Optics & Laser Technology, 44(6), 1858-1865.
Ramesh, S., Karunamoorthy, L., & Palanikumar, K. (2008). Surface roughness analysis in machining of titanium alloy. Materials and Manufacturing Processes,23(2), 174-181.
Revankar, G. D., Shetty, R., Rao, S. S., & Gaitonde, V. N. (2014). Analysis of surface roughness and hardness in titanium alloy machining with polycrystalline diamond tool under different lubricating modes. Materials
Research, (AHEAD), 1010-1022.
Ribeiro, M. V., Moreira, M. R. V., & Ferreira, J. R. (2003). Optimization of titanium alloy (6Al–4V) machining. Journal of Materials Processing Technology,143, 458-463.
Rotella, G., Dillon Jr, O. W., Umbrello, D., Settineri, L., & Jawahir, I. S. (2014). The effects of cooling conditions on surface integrity in machining of Ti6Al4V alloy. The International Journal of Advanced Manufacturing
Technology, 71(1-4), 47-55.
Shetty, R., Jose, T. K., Revankar, G. D., Rao, S. S., & Shetty, D. S. (2014). Surface Roughness Analysis during Turning of Ti-6Al-4V under Near Dry Machining using Statistical Tool. International Journal of Current
Engineering and Technology, 4(3), 2061-2067.
Sridhar, B. R., Devananda, G., Ramachandra, K., & Bhat, R. (2003). Effect of machining parameters and heat treatment on the residual stress distribution in titanium alloy IMI-834. Journal of Materials Processing
Technology, 139(1), 628-634.
Suhail, A. H., Ismail, N., Wong, S. V., & Jalil, N. A. (2010). Optimization of cutting parameters based on surface roughness and assistance of workpiece surface temperature in turning process. American journal of engineering
and applied sciences, 3(1), 102.
Sulaiman, M. A., Haron, C., Ghani, J. A., & Kasim, M. S. (2014). Effect of High-speed Parameters on Uncoated Carbide Tool in Finish Turning Titanium Ti-6Al-4V ELI. Sains Malaysiana, 43(1), 111-116.
Sun, J., & Guo, Y. B. (2009). A comprehensive experimental study on surface integrity by end milling Ti–6Al–
4V. Journal of Materials Processing Technology, 209(8), 4036-4042.
Thepsonthi, T., & Özel, T. (2013). Experimental and finite element simulation based investigations on micro-milling Ti-6Al-4V titanium alloy: Effects of cBN coating on tool wear. Journal of Materials Processing
Technology, 213(4), 532-542.
Ulutan, D., & Ozel, T. (2011). Machining induced surface integrity in titanium and nickel alloys: A review. International Journal of Machine Tools and Manufacture, 51(3), 250-280.
Ulutan, D., & Özel, T. (2012, June). Methodology to determine friction in orthogonal cutting with application to machining titanium and nickel based alloys. In ASME 2012 International Manufacturing Science and Engineering Conference collocated with the 40th North American Manufacturing Research Conference and in
participation with the International Conference on Tribology Materials and Processing (pp. 327-334).
Venugopal, K. A., Paul, S., & Chattopadhyay, A. B. (2007). Tool wear in cryogenic turning of Ti-6Al-4V alloy. Cryogenics, 47(1), 12-18.
Vijay, S., & Krishnaraj, V. (2013). Machining parameters optimization in end milling of Ti-6Al-4V. Procedia
Engineering, 64, 1079-1088.
Wang, Z. G., Rahman, M., & Wong, Y. S. (2005). Tool wear characteristics of binderless CBN tools used in high-speed milling of titanium alloys. Wear,258(5), 752-758.
Zareena, A. R., & Veldhuis, S. C. (2012). Tool wear mechanisms and tool life enhancement in ultra-precision machining of titanium. Journal of Materials Processing Technology, 212(3), 560-570.
Zoya, Z. A., & Krishnamurthy, R. (2000). The performance of CBN tools in the machining of titanium alloys. Journal of Materials Processing Technology, 100(1), 80-86.