Research Article
Design and Construction of a compressive force measuring device for oil expression
I. C. Ozumba1,*, K. Ojea2, A. T. Ajiboye1 and M. Olayinka1
1National Centre for Agricultural Mechanization (NCAM) P.M.B. 1525, Ilorin, Nigeria. 2Department of Agricultural and Biosystems Engineering, University of Ilorin, Nigeria.
Received 28 July 2009; Revised 9 March 2010; Accepted 19 March 2010
Abstract
This paper describes the design and construction of a device for measuring compressive force during oil expression from oil bearing seeds or nuts. The device consist of a 10 tons load cell and an amplifier with display unit. The device was calibrated and tested. The result obtained from the test shows that the device is adequate for measuring dead load and compressive force, ranging from 0-100kN in a situation where a percentage error of up to 0.2% is permissible. In addition, test result of oil yield obtained by using the device to measure compressive force during oil expression from grounded Palm Kernel was compared to the result of oil yield measured using the Universal Testing Machine (UTM) of 50KN capacity. The results were subjected to a statistical analysis using T-test. The comparative analysis of the two independent results confirmed that there is no significant difference between the two devices at 5% level of confidence (P>.05).
Keywords: Superlattices, Lattice Dynamics, Raman scattering, phonons.
Journal of Engineering Science and Technology Review 3 (1) (2010) 80-84
Technology Review
www.jestr.org
The compression of oil seeds by agricultural equipment has be -come a matter of increasing concern because for each crop there is an optimum level of pressure for maximum yield [8]. Loading beyond this optimum level can be very detrimental.
Oil seeds are most of the time subjected to compressive loads in order to express oil from them. These forces tend to either in-crease or dein-crease the quantum of oil expressed as the case may be. Thus, there is the need to determine the magnitude of such compressive forces in order to device appropriate strategies for a particulfar situation. Therefore, the development of simple devic-es or techniqudevic-es that will identify and quantify the comprdevic-essibility of oil seeds is a first step towards optimization of oil yield.
Interpretation of compression data in terms of squeezing-flow parameters is receiving increasing attention in food research [2]. It has also been used in polymer science, particularly for measuring biaxial extensional viscosity of highly viscous polymers [4].
Most information on mechanical and textural properties of oil seeds has been obtained using triaxial apparatus or uniaxial compression tests using material testing equipment such as In -stron or Testometric Universal Testing Machine.
These force-measuring devices earlier used for such research work are very expensive and difficult to maintain, especially in developing countries with low income and where Hi-technology is rarely available.
Force measurement can be divided into two categories, di
-rect comparison and indi-rect comparison. The unknown is di-rectly compared with a gravitational force in direct comparison, while in an indirect comparison method the use of calibrated mass or transducer is employed.
The transducing method of measuring force is the most com-mon because of its flexibility. While other methods of force meas -urements can be used for static or slowly varying loads, the elastic deflection method which fall under transducing method are widely use for both static and dynamic loads of frequency content of the order of thousands of hertz [5].
Some of the factors to be considered for force transducer se-lection include nature of signal to be measured, loading effect of the transducer, environmental considerations, transducer capabil-ity, measuring system compatibility and cost [6].
The objective of this study is to design and construct a com -pressive force measuring system for oil seeds in order to device strategies to determine the effects of such forces on the target ma-terials.
2. Design and construction
The design and construction of the force-measuring device was carried out in such a way that the device has high reliability, ac -curacy, repeatability and reasonable sensitivity. The components used for the designed circuit were selected based on technical, economic and availability considerations.
* E-mail address: [email protected]
ISSN: 1791-2377 © 2010 Kavala Institute of Technology. All rights reserved.
2.1 Design
The expected measuring range of the device is 0kN to 100kN, therefore; the maximum rating of the selected load-cell was 100kN. The load cell excitation voltage was ± 5v d.c and the out -put from each of the terminals with respect to ground under no-load (balanced) condition were +4.7mV d.c, while the differential output between the two output terminals was 0 volt.
The maximum differential output voltage from the load cell under maximum load was in microvolt range. The detection of this voltage is practically impossible for most commonly available display that can only detect voltage in millivolt range and above. In order to display the voltage with reasonable accuracy and for easy calibration, there is the need for this differential voltage to be amplified.
Since the output voltage from the load cell is a differential voltage, differential amplifier was used for amplifying the voltage. The design of the amplifier and associated circuit was carried out as follows:
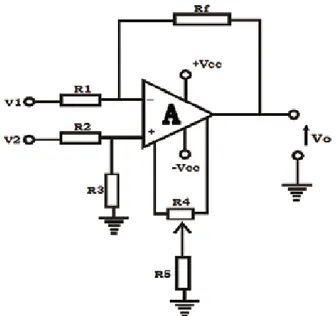
The circuit diagram of a differential amplifier is as shown in fig 1.
R1 and R2 are the input resistance; Rf is the feed back
resist-ance. R3 is the balancing resistance, while R4 and R5 are combined
to form zero adjusting resistors. A is the operational amplifier; V1
and V2 are the inverting input and non-inverting input voltage
re-spectively. V0 is the amplifier output voltage while +Vcc and –Vcc
are the positive and negative amplifier power supply voltage, re -spectively.
The closed – loop gain G for this amplifier is expressed in terms of other circuit parameters in equation (1)
(1)
For proper operation of the circuit,
(2)
V1 and V2 were obtained from the output of the load cells.
To interface the load cell with the differential amplifier, the output of the load cell must pass through a buffer (unity gain, high input impedance and low output impedance amplifier) so that the output impedance of the load cell circuit can be matched with input im -pedance of the differential amplifier. The output of the differential amplifier was also interfaced with the display via a buffer for the same reason.
The differential voltages, when 1kN and 100kN forces were applied are 1micro volt and 100 microvolt respectively. Therefore, to obtain an output of 1milivolt at minimum load and 100milivolt at maximum load, an amplifier closed-loop gain G of 1000 was used.
But
Therefore,
To obtain Rf, a value of 1KΩ was used for R1 to improve the
input impedance of the amplifier. Thus, the value of Rf was deter
-mined as follows:
From equation (2)
And
A general-purpose operational amplifier LM 324 was used for this work. As a result of non availability of standard instru -mentation amplifier such as AD624, INA124, 125 e.t.c in Nigeria. it was configured as an instrumentation amplifier using all the four Op-Amps as shown in fig 2. The basic and major disadvantage of this configuration is poor commomn mode rejection ratio (CMRR) which was taken care off by:
1. Using precision type resistors for all fixed resistors. 2. Making sure resistors R1, R2 and R3, R4 are matched
3. Providing electrostatic discharge point and grounding shields within the circuit board as shown in figure 3 by the two cylinders
Figure 1. Circuit diagram of a differential amplifier
1 2
1
R
=
R
=
K
Ω
3 f
1
For proper nulling, a 10KΩ pot and 1KΩ resistor was used for R5 and VR1, respectively.
The complete circuit diagram of the designed circuit is as shown in Fig 2.
LIST OF COMPONENT
R1 and R2 - 1k (Precision and matched)
R3 and R4 - 1M (Precision and Matched)
R5 - 1K
VR - 10K
OP1 - 4 - LM324
Vero Board - 15cm x 6cm Digital Voltmeter
2.2 Construction:
The conditions of the components used for the construction of the force-measuring device were ascertained through testing before using them. The components were arranged accordingly on the Vero board and soldered.
Conformance tests were carried out on the output of the load cell, input of the differential amplifier, output of the differential amplifier and input of the display to ensure conformity with the de -sired voltage and the results agreed with the de-sired voltage values. The picture of the constructed device is as shown in Figure 4.
3. Calibration
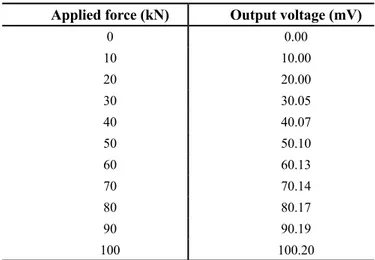
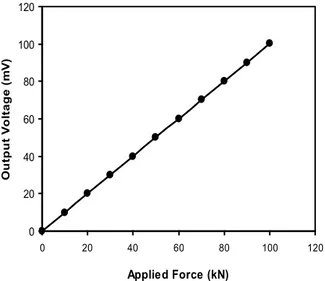
Calibration is the process by which the output voltage of the con -structed force-measuring device was recorded as the applied force was varied in a predefined environment [7]. The applied force could be from a primary standard force (dead weight) or a second -ary standard force (e.g. Hydraulic press). For the purpose of this work, a hydraulic press with 300kN force rating was used and the readings obtained as the force was increased from 0kN to 100kN were recorded as shown in Table1. The calibration curve (Fig.5) was obtained by plotting the values of output voltage against the applied force.
It can be seen from the calibration curve that the relationship between the output voltage and the applied force was linear with no hysteresis. Furthermore, when the data obtained was fitted to a lin -ear regression model, the resulting equation for the calibration was
Y=X (3) Where Y is measuring device output in millivolts and X is the applied force in kN.
Table 1. Calibration readings.
Applied force (kN) Output voltage (mV)
0 0.00
10 10.00
20 20.00
30 30.05
40 40.07
50 50.10
60 60.13
70 70.14
80 80.17
90 90.19
100 100.20
4. Testing of the device
4.1 Validation of calibration
In order to validate the calibration of the device, the device was used on another hydraulic press different from the one used for calibration to further authenticate the results of the calibration test. The results obtained are shown in Table 2.
4.2 Performance test
The performance test of the designed device was carried out by measuring the compressive force used in expressing oil from Figure 2. Complete circuit diagram of the designed force-measuring device
Figure 3. Picture of the Circuit Board
grounded palm kernel seed in an oil expression rig mounted on a hydraulic press. The oil yield obtained from each corresponding force measured by the designed device was compared to the oil yield obtained from compressive force measured using the Univer-sal Testing Machine (UTM).
Fig.6 shows the complete assembly of the mechanical oil ex -pression rig, designed force measuring device and the hydraulic press used for carrying out the performance test of the designed compressive force-measuring device. The rig is made up of three major components: piston, the press cage cylinder and the support -ing platform. The rig was coupled to the hydraulic press and UTM respectively as shown in Figures 6 and 7. The compressive force used to express oil was measured using the designed device for the hydraulic press. The ground palm kernel of fine particle sizes were poured into the press cage cylinder, the sample was heated for 30 minutes, at the heating temperature of 110oC. Then the pressing
speed of 2.5mm/minute was imputed into the UTM and the com -pression piston mounted on the cross –head of the UTM begins to move down into the press cage cylinder containing the samples and then compresses sample at the exert loads of 30, 35, 40 and 50kN selected from the UTM. The pressing was allowed for 10 minutes (i.e. the time when no oil comes out again) after then the compressing piston was moved up. The oil collected and the cake was weighed. The test was repeated three times for each compres -sive load selected.
Note that for the hydraulic press and measuring device, the compression piston was mounted on the plunger and it can be moved manually using the lever, as the compression piston presses the sample, the exerted loads ( i.e. 30, 35, 40, 45 kN ) was read from the display of the measuring device. These range of loads was selected because the UTM maximum capacity was 50kN, while preliminary experiments shows that reasonable quantity of oil was obtained at 30kN load.
At the end of the tests, oil yield from ground palm kernel under compressive loading measured using the designed and con-structed device and Universal Testing Machine respectively was calculated as the ratio of the weight of oil expressed to the weight of the sample before expression. [1] mathematically expressed the oil yield as:
(4)
Where
YO = Oil yield (%)
WO = Weight of oil expressed (g)
WS = Weight of sample before expression (g)
The result of the oil yield obtained from the various loads (compressive) measured using the UTM and the designed and con-structed device respectively was subjected to statistical analysis to determine if there was any significant difference between them.
Legend
A Mechanical Oil Expression Rig B Temperature Controller
C Amplifier with display Unit
D Load Cell
Legend
A Compression Piston B Press Cage Cylinder C Heater Band D Thermocouple E Support Platform F Temperature Controller
G UTM Display Unit
Figure 5. Calibration Curve for the Force Measuring Device.
Figure 6. Assembly of the Designed Device and the Mechanical Oil Expres-sion Rig on Hydraulic Press.
5. Results and discussion
5.1 Validation of calibration
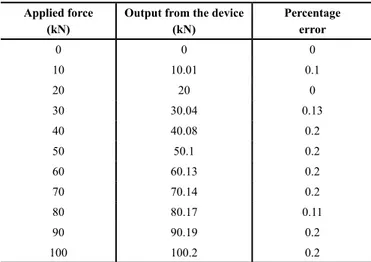
It can be seen from Table 2 that the force-measuring device can be used for both dead weight measurement and varying compressive force measurement, ranging from 0 to 100kN. One can also observe from Table 2 that the maximum error obtained was 0.2% of the ap -plied force. Therefore, it can be inferred that the device is adequate for force measurements in situations where 0.2% error is acceptable.
Table 2. Result of validation of Calibration of the measuring de -vice on an hydraulic press.
Applied force (kN)
Output from the device (kN)
Percentage error
0 0 0
10 10.01 0.1
20 20 0
30 30.04 0.13
40 40.08 0.2
50 50.1 0.2
60 60.13 0.2
70 70.14 0.2
80 80.17 0.11
90 90.19 0.2
100 100.2 0.2
Table 3. Result of oil yield from ground palm kernel seed under compressive loading measured by the designed device.
Load
(KN) Oil Yield (%)
Aver-age Oil yield Tempe-rature oC Press-ing time (mins) Heating time (mins)
1 2 3
30.0 17.17 18.22 17.86 17.75 110 10 30
35.0 19.70 18.94 19.67 19.44 110 10 30
40.0 20.12 20.04 21.02 20.39 110 10 30
45.0 22.40 21.98 23.76 22.71 110 10 30
5.2 Performance test
Tables 3 and 4 shows the result of oil yield obtained by mechani -cally expressing oil from grounded Palm kernel seed under vari-ous Compressive force measured using the designed device and the Universal Testing Machine respectively. The test results were subjected to statistical analysis using T-test to determine if there were any significant difference between the values measured us -ing each of the devices (i.e. the designed device and the UTM). From the result of the statistical analysis, the T-test value (i.e. cal-culated) was 0.0384, while the T-table value was 2.447 at 5% level of significance with degree of freedom of 6.Since the calculated T-test value was less than the T-table value. It can then be concluded that there was no significant difference between the compressive force measured by each of the two load measuring devices at 5% level of significance (P>0.05).
Table 4. Result of oil yield from ground palm kernel seed under compressive loading measured by the Universal Testing Machine.
Load
(KN) Oil Yield (%)
Aver-age Oil yield Tempe-rature oC Press-ing time (mins) Heating time (mins)
1 2 3
30.0 18.02 17.92 18.32 18.09 110 10 30
35.0 20.10 19.21 18.96 19.42 110 10 30
40.0 20.46 21.02 20.26 20.58 110 10 30
45.0 22.28 22.03 23.81 22.71 110 10 30
6. Conclusion
A low cost device that is a replicate of the universal testing ma -chine (UTM) and produces satisfactory compressive force-meas-urements was designed and constructed. The device is easy to op -erate and maintain; and can be afforded by laboratories that cannot afford the UTM. The output of the device was linear. The device is suitable for measuring both dead load and slow varying force ranging from 0-100kN.The oil yield obtained by expressing oil from ground Palm Kernel seed under various compressive forces measured using the device and the UTM respectively; shows that there was no significant difference between the values obtained from each of the machines at 5% confidence level using T-test. Thus, it then implies that the designed device compares favourably with any compressive force-measuring machine\device.
1. Adeeko, K. A and Ajibola, O. O (1989). Processing Factors Affecting the Yield and Quality of Mechanically Expressed Groundnut oil, Journal of Agric Engineering Research Vol. 46, pp. 45-53.
2. AK, M. M. and Gunasekaran, S (1992). Stress-Strain Curve Analysis of Cheddar under Uniaxial Compression. Journal of Food Science. Vol. 57, no.5, pp. 1078-1081.
3. Boyes, W. (2002). Instrumentation Reference Book, 3rd edition,
Butter-worth – Heinemann, Johannesburg pp. 106-112.
4. Chatraei, S. H., Macosko, C. W. and Winter, H. H. (1981). Lubricated squeezing Flow: a new biaxial extensional rheometer. J. Rheol. 25: 433. 5. Doebelin, O. E. (1975). Measurement Systems Application and Design,
International Student Edition, Mc Graw-HILL INTN’L Book Company, Tokyo pp. 333, 338, 341 & 342.
6. Jain R. K (1974). Mechanical and Industrial Measurement, 2nd Edition,
Khanna Publishers, Delhi pp. 54, 73-77.
7. Mamman, E., Oni, K. C. and Ajiboye, A. T. (2002). Design and Construc -tion of an Instrumenta-tional System for Measuring Draught on Model Tillage Tools. Proceedings of the 1st Int’L Conference of WASAE, Abuja,
pp. 232.
8. Soane, B. D. (1985). Traction and transport systems as related to cropping systems. In Proc. 1st International Conference on Soil Dynamics, Vol. 5,
pp. 863-935.