Comparative Phylogeography of Two Sympatric
Microgastropod Species
Alexander M. Weigand1*, Markus Pfenninger2, Adrienne Jochum1, Annette Klussmann-Kolb1
1Department of Phylogeny and Systematics, Goethe University, Frankfurt am Main, Hesse, Germany,2Molecular Ecology Group, Biodiversity and Climate Research Centre by Senckenberg Gesellschaft fu¨r Naturforschung and Goethe University, Frankfurt am Main, Hesse, Germany
Abstract
The Alpine Region, constituting the Alps and the Dinaric Alps, has played a major role in the formation of current patterns of biodiversity either as a contact zone of postglacial expanding lineages or as the origin of genetic diversity. In our study, we tested these hypotheses for two widespread, sympatric microgastropod taxa –Carychium minimumO.F. Mu¨ller, 1774 and
Carychium tridentatum(Risso, 1826) (Gastropoda, Eupulmonata, Carychiidae) – by using COI sequence data and species potential distribution models analyzed in a statistical phylogeographical framework. Additionally, we examined disjunct transatlantic populations of those taxa from the Azores and North America. In general, bothCarychiumtaxa demonstrate a genetic structure composed of several differentiated haplotype lineages most likely resulting from allopatric diversification in isolated refugial areas during the Pleistocene glacial periods. However, the genetic structure ofCarychium minimumis more pronounced, which can be attributed to ecological constraints relating to habitat proximity to permanent bodies of water. For most of theCarychiumlineages, the broader Alpine Region was identified as the likely origin of genetic diversity. Several lineages are endemic to the broader Alpine Region whereas a single lineage per species underwent a postglacial expansion to (re)colonize previously unsuitable habitats, e.g. in Northern Europe. The source populations of those expanding lineages can be traced back to the Eastern and Western Alps. Consequently, we identify the Alpine Region as a significant ‘hot-spot’ for the formation of genetic diversity within European Carychium lineages. Passive dispersal via anthropogenic means best explains the presence of transatlantic EuropeanCarychiumpopulations on the Azores and in North America. We conclude that passive (anthropogenic) transport could mislead the interpretation of observed phylogeographical patterns in general.
Citation:Weigand AM, Pfenninger M, Jochum A, Klussmann-Kolb A (2012) Alpine Crossroads or Origin of Genetic Diversity? Comparative Phylogeography of Two Sympatric Microgastropod Species. PLoS ONE 7(5): e37089. doi:10.1371/journal.pone.0037089
Editor:Paul Sunnucks, Monash University, Australia
ReceivedNovember 24, 2011;AcceptedApril 17, 2012;PublishedMay 14, 2012
Copyright:ß2012 Weigand et al. This is an open-access article distributed under the terms of the Creative Commons Attribution License, which permits unrestricted use, distribution, and reproduction in any medium, provided the original author and source are credited.
Funding:The Biodiversity and Climate Research Centre from the LOEWE programme (Landes-Offensive zur Entwicklung Wissenschaftlich-o¨konomischer Exzellenz’’ of Hesse’s Ministry of Higher Education, Research, and the Arts) provided financial support for field trips and laboratory work (http://www.bik-f.de/root/ index.php). The funders had no role in study design, data collection and analysis, decision to publish, or preparation of the manuscript.
Competing Interests:The authors have declared that no competing interests exist.
* E-mail: A.Weigand@bio.uni-frankfurt.de
Introduction
Alternations of glacial and interglacial periods as results of climatic fluctuations of the Pliocene and Pleistocene periods most likely triggered the formation of current patterns of biodiversity. Species reacted to the changing environmental conditions in diverse and individualistic ways [1,2]. Catalysts and consequences of taxon-specific responses to changes in their geographic ranges can be investigated using techniques employed via phylogeogra-phy [3,4]. Hypotheses can be constructed leading to a deeper understanding of the existence and position of (cryptic) refugia, routes of postglacial-expansion and suture zones of secondary contact [5–9]. A frequent observation is the decrease in genetic diversity from the European south to north [10], which led to the ‘southern richness’ versus ‘northern poverty’ hypothesis. This condition can be ascribed to more frequently inhabited (or permanent) southern refugia, thus possessing a higher population size and genetic diversity than more northern areas, which are only occupied during favorable conditions after bottleneck events of range expansions. On the other hand, it has been shown that
northern suture zones can harbor a comparable amount of genetic diversity [11]. However, because phylogeographical patterns are highly individualistic and depend upon historical contingency as well as the characteristics specific to the taxa under study (e.g. climatic tolerance, mode of dispersal), it is important to test these hypotheses for a wide range and large number of taxa [8,12,13]. Terrestrial gastropods are particularly suitable for the testing of phylogeographical hypotheses [14]. Their restricted active dis-persal abilities, often low effective population sizes and specific habitat requirements lead to extinction rather than to habitat tracking with historical spatial-genetic patterns remaining con-served and prominent [15–17]. In studies dealing with European terrestrial gastropods, the Alps, even though covered under ice, have proven to have played a major role either as a glacial refugium and/or suture zone of previously isolated lineages [18– 22].
defined as epigeal and consist of permanently wet, aphotic zones such as shaded, humid leaf litter and crevices [25]. In Europe, two widely distributed species are recognized – Carychium minimum
Mu¨ller, 1774 [26] and Carychium tridentatum (Risso, 1826) [27]. Beyond these two common taxa, endemic species or subspecies have been described using conchological characters as designators for geographic areas within Europe [28,29].
We performed a comparative phylogeographic approach including data for the two closely related and mostly sympatric microgastropod speciesCarychium minimumand C. tridentatum. Our aim was to investigate the individual responses to past climatic fluctuations and to analyze whether the broader Alpine Region (Alps+Dinaric Alps) constitutes a ‘hot-spot’ (refugium) or ‘melting-pot’ (suture zone) of genetic diversity. We tested our two competing hypotheses by the application of multiple lines of evidence using independent methods based on genetic and bioclimatic data, respectively, and by the comparative investiga-tion of co-distributed gastropod taxa. We further benefit from the hermaphroditic nature of Carychium gastropods [24]. Mitochon-drial mutations occurring in ‘paternal’ lineages are not immedi-ately lost and can be potentially transferred by the same individual serving as the egg donor during any subsequent mating. Thus, it can be assumed that our study design strengthens inferences drawn from mtDNA data only. Under the ‘hot-spot’ scenario, paleoclimatic conditions for the Alpine Region at the Last Glacial Maximum (LGM) in Europe should have been suitable for
Carychiumtaxa and one would expect high genetic diversity, with endemic lineages and/or haplotypes to be found in this region. Furthermore, the Alpine Region could have served as an important source for postglacial population expansions [30]. On the contrary, unsuitable paleoclimatic conditions in the Alpine Region for the time at the LGM, and a subsequent postglacial recolonization by only a few lineages and/or haplotypes from more southerly located refugia (still resulting in regions of high genetic diversity after secondary contact), would favour the Alpine Region ‘melting-pot’ hypothesis. Finally, we inferred the geo-graphic origin of disjunct transatlantic populations of both taxa.
Methods
Sampling and species identification
In total, 742 specimens from 92 sampling localities (Fig. 1, Table 1) ofCarychium minimum(CM; 325 specimens, 48 sampling localities) and C. tridentatum (CT; 417 specimens, 66 sampling localities) were sampled during the years 2008–2011 throughout their native European range (Fig. 1B, E) and from disjunct transatlantic sampling localities (Fig. 1C, D). No specific permits were required for the described field studies. We exclusively collected in non-protected areas and the involved Carychiumtaxa are not treated as endangered. In 24% of all populations, both species occurred in sympatry. On average, 6–7 specimens of a single species were obtained per population (minimum: 1; maximum: 15). Specimens were immediately preserved in 70– 99% ethanol after collection. All individuals were identified by an integrative taxonomic approach using the combined investigation of conventional conchological characters for Carychiidae [29] and DNA barcodes [31].
DNA extraction, amplification and sequencing
DNA of freshly conserved specimens was extracted using the DNeasy Blood and Tissue Kit (Qiagen, Hilden, Germany) and the respective protocol. Prior to DNA extraction, visceral and shell material were removed to minimize contamination risk. E-voucher data (images, georeferences, and sequence information) can be
obtained from the projects ‘Phylogeography of Carychium’ (PHYCA) and ‘Barcoding Carychiidae microsnails’ (BARCA) stored at the Barcode of Life Data System (BOLD) [32]. The mitochondrial-encoded Folmer-fragment of the cytochrome c oxidase subunit I (COI) was amplified by polymerase chain reaction (PCR) using the standard invertebrate primer pair LCO1490 – 59GGTCAACAAATCATAAAGATATTGG39 and HCO2198 – 59TAAACTTCAGGGTGACCAAAAAATCA39 [33]. Each 25mL PCR mixture included 1mL (10 pmol) of each primer, 2.5mL 106PCR buffer, 2mL (100 mM) MgCl2, 0.3mL
(20 mM) dNTPs, 0.3mLTaq-polymerase, 0.25mL (0.5 M) tetra-methylammonium chloride, 1.5mL (10 mg/mL) bovine serum albumin, 11.15mL ddH2O and 5mL template DNA. PCR cycles
were run at the following conditions: 1 min at 95uC, followed by 30 cycles of 30 s at 95uC, 30 s at 52uC and 30 s at 72uC, and finally, 3 min at 72uC. Single PCR products were visualized on a 1.4% agarose gel and cleaned with the GeneJET PCR Purification Kit (Fermentas, St. Leon-Rot, Germany). In cases where multiple PCR products were detected the QIAquick Gel Extraction protocol (Qiagen) was used. PCR products were bidirectionally sequenced using the PCR primer pair and the BigDyeH
Terminator v.3.1 Cycle Sequencing Kit (Applied Biosystems, Inc.) on an ABI 3730 xl capillary sequencer following the manufacturer’s instructions.
Editing and alignment
Sequences were edited and aligned using Geneious 5.4 (Biomatters Ltd.) and BioEdit 7.0.9 [34] with the implemented ClustalW option [35]. In a post-editing process, primer sequences were deleted as they represent conserved (uninformative) regions influencing population genetic estimates. Further, alignment results were checked for potential 39/59-flanking regions of missing data by using Gblocks 0.91b [36]. The two final alignments were manually adjusted in length to receive homologous and thus comparable datasets for all two taxa.
Population genetic analyses
Analyses of genetic data can provide insights into population structure and events shaping their demographic history, e.g. the impact of glacial periods with the formation of isolated allopatric lineages. A spatial-genetic correlation can further point to regions of high genetic diversity as potential refugial areas or zones of secondary contact.
Genetic and haplotype diversity. The software DnaSP v5 [37] was used to estimate the number of haplotypes per taxon as well as sampling site and to calculate the haplotype diversity (H). The genetic diversity (p) was obtained under the pairwise-deletion
option in MEGA5 [38].
Identification of MOTUs (Molecular Operational Taxonomic Units). Haplotype networks were constructed by using Network 4.6 (Fluxus Technology Ltd.) for Median-Joining [39] and TCS 1.21 [40] for Statistical Parsimony networks [41]. To break the mutational pathway and thus to resolve ambiguities (loops) in the networks, the approach described by [14] was followed. To identify molecular operational taxonomic units (MOTUs), the nesting design was manually constructed using the resolved haplotype networks according to the rules given in [42]. The nesting level was chosen for MOTU characterization that provided a suitable level of resolution: For example a 3rdlevel nesting for the less genetically structured CT resulted in only two units, and would thus provide few insights into the spatial distribution of genetic diversity.
while comparing the CM and CT datasets under two competing scenarios – constant population size vs. exponential growth. Identical priors were used between comparable runs. Simulations were run for more than 10,000,000 generations and trees sampled every 100th generation. Final samples were taken from the stationary phase of the runs. The convergence of relevant parameters was assessed using Tracer v1.5 [44]. The traces of the MCMC samples and the effective sampling size with parameters for each run showing values.100, thus indicating a sufficient level of sampling were inspected. For model comparison and selection of the best fitting model, the harmonic means of tree likelihoods were compared using a Bayes Factor (BF) test [45]. After [46], the results of log BF can be interpreted as substantial (K-1), strong (1–2) and decisive evidence (.2) for a given
hypothesis.
The McDonald-Kreitman test for a combined dataset of CM+CT was conducted in DnaSP v5. This test is based on the comparison of synonymous and non-synonymous differences within and between species [47] and calculates the amount of polymorphic synonymous (Ps), polymorphic non-synonymous (Pn), fixed synonymous (Ms) and fixed non-synonymous (Mn) differ-ences. Thereby, a site is called polymorphic if it shows variation within species, while it is classified as fixed if it differs between species but not within them. In case genetic changes are the result of positive selection, the ratio of fixed differences to
polymor-phisms is much higher for non-synonymous changes (Mn/ Pn..Ms/Ps).
For selected MOTUs additional Tajima’s D [48] and Fu’s FS
[49] measures for neutral molecular evolution were determined in DnaSP v5 [37]. Both statistics identify deviations from the null-hypothesis (selective neutrality) of the neutral theory model at equilibrium between genetic drift and mutation. Significant negative deviations from 0 can indicate past population expansion and/or purifying selection, whereas significant positive values can result from balancing selection and/or a decrease in population size. Tajima’s D and Fu’s FS measures are significant below the
0.05 and 0.02 p-level, respectively, which were calculated in DnaSP v5 (1000 coalescent simulations). Deviations of the observed data from a simulated model of population expansion [50] were further tested by calculating mismatch distributions (frequency of pairwise genetic differences against stepwise genetic distance of haplotypes) and estimating the Harpending’s ragged-ness index (Hri; [51] in DnaSP v5. A significantly high value of Hri (p,0.05) means a non-fitting deviation, and thus, a rejection of the null-hypothesis of a population expansion model.
Species potential distribution modeling
The comparison of species potential distribution models under recent and past bioclimatic conditions can help to identify (re-)colonization events and to locate permanently suitable regions Figure 1. Distribution map of sampling sites.Overview map (A) of sampling sites and detailed depiction of European (B), transatlantic North American (C) and Azorean (D) as well as East European populations (E). Further information can be retrieved from Table 1.
Table 1.Locality information of analyzed sampling localities.
abb. Locality
latitude (N)
longitude
(E) NCM HCM pCM haplotypes CM NCT HCT pCT haplotypes CT
AR France, Argentie`re 45.9723 6.9173 10 0.2000 0.0010 H25, H33
AS Belgium, Assenois 49.7965 5.4557 3 0 0 H1
AU Italy, Auer 46.3385 11.3503 9 0 0 H20 7 0.6667 0.0032 H3, H26, H29
AZ1* Portugal, Azores 37.852 225.265 4 0 0 H30 2 0 0 H2
AZ2* Portugal, Azores 37.8 225.2 8 0 0 H2
BA Germany, Baunatal 51.2574 9.3581 7 0.7619 0.0016 H1, H8, H13 13 0.6795 0.0033 H1, H7, H8, H25, H27
BB Germany, Bad Herrenalb 48.8247 8.4622 6 0 0 H1
BE France, Beg En Fry 48.70 23.72 6 0 0 H1
BH Germany, Bad Homburg 50.227 8.635 6 0.6000 0.0102 H1, H33
BI Austria, Bichlbach 47.417 10.842 9 0 0 H1
BN France, Bonnac 43.164 1.5959 12 0.1667 0.0006 H1, H16
BO Czech Republic, Bohemia 50.7911 15.2103 9 0 0 H1 8 0 0 H25
BR Germany, Bremen 53.09 8.82 9 0.4167 0.0008 H3, H4, H5 3 0 0 H1
BT Hungary, Budapest 47.5115 19.2435 8 0.4286 0.0007 H1, H3 4 0 0 H1
BU Romania, Baru 45.5119 23.2142 5 0.4000 0.0007 H22, H23
BY Czech Republic, Brezany 48.8736 16.3308 1 n/a n/a H3
CE Czech Republic, Cereniste 50.5944 14.1089 3 0 0 H25
CN Romania, Cluj-Napoca 46.7613 23.5869 15 0.6762 0.0041 H21, H23, H24
CS France, Ceyras 43.6453 3.4597 10 0 0 H33
DA Germany, Darmstadt 49.8704 8.6783 5 0 0 H1 8 0.5714 0.0049 H1, H25
DI Germany, Diessen 47.94 11.11 9 0.2222 0.0004 H30, H32
EC Czech Republic, Echemia 50.8006 15.3581 4 0.5000 0.0042 H1, H25
EP Italy, Eppan 46.4889 11.2464 9 0 0 H9 5 0.6000 0.0021 H19, H26
ER Germany, Erdbach 50.6813 8.2168 10 0.7111 0.0069 H1, H2, H33 5 0 0 H1
ES Germany, Eppstein 50.1536 8.3962 10 0.3556 0.0006 H1, H11
EU Belgium, Eupen 50.59 5.98 4 0 0 H1
FR1 Germany, Frankfurt am Main 50.1293 8.6583 4 0.8333 0.0020 H1, H7, H11 3 0.6667 0.0068 H1, H33
FR2 Germany, Frankfurt am Main 50.1244 8.6542 2 0 0 H33
FV Belgium, Fays Les Veneurs 49.8654 5.1615 5 0.6000 0.0010 H1, H14 2 0 0 H1
GA Slovenia, Gradicek 45.8897 14.7756 4 0.5000 0.0009 H17, H18 2 0 0 H38
GG Slovenia, Gornji Ig 45.9189 14.4934 10 0 0 H20
GH Romania, Gheorgheni 46.7096 25.5978 5 0 0 H1 2 0 0 H23
GI Spain, Gijo´n 43.5204 25.6164 15 0 0 H21 1 n/a n/a H1
GM France, Gambsheim 48.6821 7.9032 6 0 0 H1
GN Germany, Gaienhofen 47.68 8.99 5 0.4000 0.0007 H1, H15
GR France, Grimbosq 49.05 20.44 3 0 0 H1
HA France, Haguenau 48.8806 7.7068 10 0 0 H1
HU Denmark, Humlebaek 55.9701 12.5426 3 0 0 H1 13 0.5128 0.0009 H1, H10
HW United Kingdom, Hartley Wintney
51.31 20.89 10 0 0 H1
IT1* USA, Ithaca 42.4008 276.5047 9 0 0 H34
IT2* USA, Ithaca 42.4494 276.4758 10 0 0 H34
KE Germany, Kelkheim/Eppenhain 50.17 8.39 1 n/a n/a H33 1 n/a n/a H1
LA Spain, La Creueta 41.9683 2.8572 3 0.6667 0.0023 H26, H33
LB Switzerland, Le Bouillet 46.2781 7.0269 10 0.4667 0.0048 H1, H33
LC Switzerland, Les Collons 46.1799 7.3889 10 0 0 H1
LD Slovenia, Logarska Dolina 46.41 14.636 5 0.4000 0.0041 H26, H39
LF Germany, Linderhof 47.57 10.96 4 0 0 H1
Table 1.Cont.
abb. Locality
latitude (N)
longitude
(E) NCM HCM pCM haplotypes CM NCT HCT pCT haplotypes CT
LM1 Switzerland, Les Masses 46.176 7.396 2 1.0000 0.0017 H23, H24 7 0.5238 0.0053 H1, H33, H34
LM2 Switzerland, Les Masses 46.23 7.01 4 0.5000 0.0025 H25, H33
LO France, Lopreden 48.5967 23.97 10 0.2000 0.0003 H1, H4
LP Slovenia, Loka Pri Mengsu 46.1426 14.5533 5 0.9000 0.0068 H3, H26, H28, H30
LS France, Les Palais 43.1080 2.7127 4 0 0 H25
LT Italy, La Thuile 45.717 6.9445 9 0 0 H1
MA Italy, Manerba 45.5588 10.5617 10 0 0 H33
MO Russia, Moscow 55.77 37.79 5 0 0 H1
OB Austria, Oberperfuss 47.2332 11.2443 8 0.2500 0.0030 H1, H18
OF Switzerland, Oberdorf 47.24 7.50 5 0 0 H1
OT1 Germany, Ottenho¨fen 48.5675 8.1561 8 0.6786 0.0063 H1, H31, H33, H34
OT2 Germany, Ottenho¨fen 48.5618 8.1437 6 0 0 H1
PA Italy, Partschins 46.6901 11.0607 9 0.2222 0.0004 H3, H5
PF1 Switzerland, Pfa¨ffikersee 47.341 8.775 3 0 0 H34
PF2 Switzerland, Pfa¨ffikersee 47.336 8.761 6 0.3333 0.0006 H34, H37
PG France, Phalsbourg 48.7506 7.2221 6 0.3333 0.0028 H1, H25
PH Belgium, Philippeville 50.2209 4.647 2 0 0 H1 9 0 0 H1
PI* USA, Pittsburgh 40.4367 279.9481 3 0 0 H39
PL Slovenia, Planina 45.825 14.248 10 0.6444 0.0078 H27, H33
PO Slovenia, Postojna 45.7769 14.2036 6 0 0 H33
PR Spain, Precendi 43.2692 25.1391 10 0.6444 0.0018 H26, H32, H33, H35
PT Georgia, Poti 42.1457 41.6974 4 0.6667 0.0057 H15, H16
PU Romania, Putna 47.8682 25.5828 10 0 0 H25
RE Germany, Reinsberg 51.0180 13.3397 10 0 0 H1 4 0.5000 0.0025 H25, H33
SC Spain, Santa Coloma de Farners 41.8581 2.6599 14 0 0 H31
SG Switzerland, St. Gallen 47.36 9.14 8 0.1250 0.0004 H1, H14
SH United Kingdom, Shropshire 52.9361 23.0239 9 0.3889 0.0014 H1, H12, H13
SL Poland, Słubice 52.3467 14.5806 10 0.7333 0.0019 H1, H3, H6, H10
SM United Kingdom, St. Martins 52.9244 22.9975 8 0.2500 0.0004 H1, H3
SO United Kingdom, Sonning 51.47 20.89 3 0 0 H1
SZ Bulgaria, Stara Zagora 42.4428 25.6386 10 0 0 H1
TE Italy, Terres 46.3142 11.02 4 0.5000 0.0025 H17, H19
TO Croatia, Tounj 45.2439 15.3253 6 0 0 H19 5 0.4000 0.0027 H36, H37
TR Turkey, Trabzon 40.935 40.246 3 0.6667 0.0023 H28, H29
TS France, Trebes 43.2049 2.4297 7 0 0 H1
TU Italy, Tuenno 46.3261 11.0114 10 0 0 H26
UP1 Sweden, Uppsala 59.8532 17.6408 5 0 0 H1
UP2 Sweden, Uppsala 59.8518 17.6288 4 0 0 H1
VA Switzerland, Vallorbe 46.6981 6.3456 6 0.3333 0.0034 H1, H33
VR* Canada, Vancouver 49.24 2123.11 5 0 0 H1
WE Germany, Wehr 47.6388 7.8972 10 0.6222 0.0106 H6, H22, H30 5 0 0 H1
WH United Kingdom, Whitekirk 56.0433 22.6375 10 0 0 H1 2 0 0 H9
WU Switzerland, Wu¨lflingen 47.52 8.70 6 0.3333 0.0006 H1, H6
ZU Switzerland, Zu¨rich 47.3586 8.5364 10 0.6000 0.0039 H1, H30, H38
Provided are locality abbreviation (abb.; corresponding to Figure 1), geographic region of sampling locality (locality), georeference data (latitude, longitude), number of specimens (N), haplotype diversity (H), genetic diversity (p) and taxon-specific haplotypes (H1-39 for both taxa). CM =Carychium minimum; CT =Carychium tridentatum.
(stable habitat) that with high probability, could have served as refugial area.
Recent and past species potential distribution models were estimated using presence-only maximum entropy modeling implemented in Maxent 3.3.3 [52,53]. This approach combines actual georeference data (presence-only points) and layers of environmental variables to create a probability distribution (potential distribution) given the parameters (taxa+bioclimatic variables) and area under study. Model runs were performed constituting 39 and 58 molecularly confirmed presence points of CM and CT, respectively. We used the 19 bioclimatic variables from the WorldClim database [54] to estimate models of ‘present-Europe’ (mean values 1950–2000) and MIROC3.2 palaeodata from [55] to generate models for the European Last Glacial Maximum (‘LGM-Europe’). Both datasets were retrieved from [56] and used in a comparable spatial resolution of 2.5 arc min. In an a priori selection, we screened for important environmental variables to yield an even better goodness-of-fit than a mere model containing all variables. Consequently, the spatial and temporal transferability will be enhanced if such variables are omitted from the model runs [57,58]. The variables bio8+bio11 for CM and bio18 for CT showed significant overfitting/covariation and where excluded from the final model runs. For all models, we used 25% of presence points for model testing and performed 10 bootstrap replicates under the recommended settings (convergence thresh-old: 0.00001; maximum number of iterations: 500; background points: 10,000; see [57]). Presence thresholds were implemented to render continuous logistic model outputs into binary formats using ArcGIS 10.0 (ESRIH Inc.). The minimum prediction that corresponds to a given presence-point (CM: 0.1011; CT: 0.1157) was used for ‘present-Europe’ models and a 50% threshold of the maximum of the logistic entropy function (as a proxy for species potential distribution) was set for ‘LGM-Europe’ models. All models were evaluated using the area under the receiver operating characteristic curve (AUC) statistic, with values for model performance ranging from 0.5 (random) to 1 (perfect) [59,60].
Refugium localization reconstruction
In distinguishing between ‘hot-spot’ (refugia) and ‘melting-pot’ (secondary contact) regions, it is important to detect past population expansion events and to localize their potential origins in congruence with spatial-genetic patterns and bioclimatic data.
The refugium localization reconstruction approach (RLR) combines methods used in phylogenetic ancestral character reconstruction and population genetics for inferring the ancestral locality of the most recent common ancestor (MRCA) of a given lineage [61]. It follows the rationale that the coalescent structure of the haplotypes contains information on the origin of their MRCA if a suitable dispersal model is applied. In this case, we applied a parsimonious dispersal model. This model assumes that a) colonization events are rare; b) colonization proceeds not strictly in a stepping-stone fashion, but rather under an island model and c) secondary gene-flow among populations can be neglected. All these assumptions are probably met by land snail populations [61,62]. By treating the sampling site as a discrete character, the dispersal routes can then be traced back in time along the coalescence tree, which has an inherent temporal direction. However, since the true coalescence tree of the sampled haplotypes is not known, a Bayesian approach was chosen to account for this uncertainty.
We used 250 randomly-sampled COI coalescent trees of the stationary phase of a BEAST-run applying the same parameters as mentioned for the demographic history analyses. BEAST-runs under constant size and exponential growth scenarios were
compared using Bayes Factor tests (Table S1). Runs under constant size scenarios performed slightly better and thus were consistently used for tree sampling. For the estimation of the ancestral locality, each locality was treated as a character and assigned to the respective haplotype. To increase the resolution, adjacent localities were pooled (Table S2). Calculations for the parsimonious ancestral character reconstruction were conducted in Mesquite 2.75 [63]. Ancestral characters (n) of the MRCA were identified and, if necessary, weighted according to the total number of equivalent ancestral characters at the root in a given genealogy (w = 1/n). Finally, the relative probability score of a given locality was determined by summing up all weighted occurrences (w) divided by the total number of trees (here 250).
Results
Genetic and haplotype diversity
The COI datasets have a length of 590 homologous base pairs (bp). Total numbers of variable sites are 52 (Carychium minimum, CM) and 39 (Carychium tridentatum, CT). We detected the same number of haplotypes (n = 39) for both taxa (Table 1). All differences between haplotypes result from single nucleotide polymorphisms. Mean genetic (p) and haplotype diversity (H)
are both significantly higher in CM (pCM= 0.0105, SD 0.0003;
HCM= 0.8351, SD 0.0150) than in CT (pCT= 0.0045, SD 0.0002;
HCT= 0.6758, SD 0.0250). The number of haplotypes per locality
extends from 1–5 (Table 1). Genetic diversity per locality in CM has maximal values in western/southwestern Germany (localities BH, ER, LG and WE) and in the Dinaric Alps (PL) (Fig. 2). Sampling localities with the highest genetic diversity for CT are located in western Germany (DA, FR1), the Dinaric Alps (LP) and the Alps (LB, LM1). The four (AZ1, IT1, IT2 and PI) and three (AZ1, AZ2 and VR) transatlantic sampling localities of CM and CT (Fig. 1C, D) are represented by a single haplotype each and thus, possess a haplotype and genetic diversity of zero.
Phylogenetic relationships and spatial analyses of haplotypes and molecular operational taxonomic units in Europe
Carychium minimum. Results of the resolved Median-Joining and Statistical Parsimony network are identical (Fig. 3A). The observed 39 haplotypes for CM can be divided into 5 MOTUs (CMMOTU1– CMMOTU5) following the results of a 3rd
level nesting. CMMOTU1 demonstrates a star-like topology
comprising the most frequent haplotype H1 (Table 1) and is the most spatially widespread (Fig. 4A). Haplotypes are distributed over southeastern (Dinaric Alps, Balkan Mountains), Central (e.g. Germany, Belgium) and Northern Europe (e.g. Great Britain and Sweden), where in the latter region this MOTU can exclusively be found. All other MOTUs form more spatially restricted genetic entities. Among these, CMMOTU4shows the widest distribution
with haplotypes located in southern France, the Alps, the Dinaric Alps and south/southwestern Germany. Haplotypes of the other three MOTUs are restricted to the Carpathians (CMMOTU2),
northern Spain (CMMOTU3) and the Alpine Region (CMMOTU3+
CMMOTU5). Haplotypes of CMMOTU5 are also present at two
localities on the Black Sea coast (Table 1: PT, TR).
Carychium tridentatum. Resolved Median-Joining and Statistical Parsimony networks provide the same results (Fig. 3B). As a consequence of the more shallow genetic structure (CT shows the lowest H andp), MOTUs have been assigned according to a
2ndlevel nesting. The 39 haplotypes form 8 divergent haplotype lineages (CTMOTU1– CTMOTU8). The application of a 3rdlevel
line) and would result in a very coarse spatial-genetic pattern. A geographical trend for this clustering is roughly visible along an east to west corridor, with haplotypes of CTMOTU1-4 and
CTMOTU5-8 occurring more likely northwards and southwards
(respectively) of this virtual barrier (Fig. 4B). Main exceptions are localities in central Europe (e.g. localities BO, DA, RE), along the French Pyrenees (BN, TS) and in northern Spain (GI). The most widespread MOTU of this taxon, CTMOTU1, has its main
distribution in the Alps, in Central and Western Europe as well as in regions as far north as Great Britain and Denmark. In general, MOTUs are geographically restricted, with e.g. CTMOTU3 and CTMOTU7 present only in the Alpine Region
and CTMOTU4limited to the Carpathians. On the contrary, some
MOTUs possess a geographical pattern indicating a wider but patchy distribution (e.g. CTMOTU5and CTMOTU6).
Phylogeography of transatlantic EuropeanCarychium
The seven transatlantic localities of CM (4 localities) and CT (3 localities) are characterized by only one haplotype per locality
(Fig. 1C, D; marked by an asterisk in Table 1). The sampling localities of CM from the Azores (AZ1) and from Ithaca, USA (IT1, IT2) reveal haplotypes H30 and H34 which cluster within CMMOTU4 (Fig. 3A). Haplotype H39 of CM is endemic to
Pittsburgh, USA (PI) and together with H25 from Romania constitutes the European CMMOTU2. In the case of CT, all
individuals from the three transatlantic sampling localities belong to the same haplotype lineage, CTMOTU1, with specimens from
the Azores (AZ1, AZ2) demonstrating haplotype H2 and individuals from Vancouver, Canada haplotype H1. Thus, six out of seven transatlantic sampling localities possess identical (CM: H30, H34; CT: H1) or closely related haplotypes (CT: H2) as found on the European mainland.
Species potential distribution modeling
Model runs for CM (39 presence points, omitting variables bio8+bio11) and CT (58 presence points, omitting variable bio18) ‘present-Europe’ and ‘LGM-Europe’ potential distribution models performed well. The average values for training AUC of both Figure 2. Distribution of genetic diversity ofCarychium minimum(A) andC. tridentatum(B) in Europe. Genetic diversity is classified into three sections (withp,0.001; 0.001–0.005;.0.005) and indicated by the respective dot.
Figure 3. COI haplotype networks forCarychium minimum(A) andC. tridentatum(B).The respective nesting is indicated as a thin (1stlevel),
thick (2ndlevel) and thick dotted line (3rdlevel). The applied nesting design is color coded, with colored boxes indicating taxon-specific molecular
datasets are close to 1 (CM: 0.954, SD 0.007; CT: 0.966, SD 0.006). Thus, these models possess a high predictive performance and transferability.
The ‘present-Europe’ models for CM and CT demonstrate a wide area of potential distribution for each taxon (Fig. 5). Except for parts of the southern Mediterranean Peninsulas (Iberian Peninsula, Italian Peninsula, Balkan area) and regions of Scandinavia, the European mainland exhibits suitable bioclimatic conditions. Moreover, model outputs for both taxa imply a mainly sympatric distribution. Our own sampling results yielded a sympatric occurrence of CM and CT at 24% of all localities. Beyond this, model runs suggest CM occurring more to the North and East of Europe (e.g. Baltic states), whereas CT can inhabit regions slightly more to the West (e.g. Brittany, Galicia).
Potential distribution in the ‘LGM-Europe’ models is restricted to several isolated regions (Fig. 5C, D). For CM, the borders of the Alps, Apennines and Pyrenees provided suitable conditions. The same suitable areas can be recognized for CT. However, the
potential distribution map for this taxon displays additional potential refugial areas. Suitable conditions have been modeled for the mountainous region of Wallonia, the upland area of the French Limousin region, and within the Dinaric Alps.
At this point, it should be highlighted that the potential distribution does not necessarily reflect the realized distribution. Hence, regions with positive model results should be regarded only as potential distribution areas including (micro-) habitats in which the taxa are able to survive.
Demographic History
Bayes factor (BF) tests of both datasets favor a scenario of constant population size over a scenario with exponential growth (BFCM= 2.099; BFCT= 6.482). The complete COI-dataset of CM
provides no indication for an event of past population expansion (Table 2). However, both neutrality tests for the complete dataset of CT and MOTU1 of both species are significantly negative. Haplotype lineages of CMMOTU4 and CTMOTU6 demonstrate
Figure 4. Spatial distribution of molecular operational taxonomic units (MOTUs) ofCarychium minimum(A) andC. tridentatum(B) in Europe. Size of localities is proportional to analyzed specimens per population.
significantly negative results for Tajima’s D only. We found no MOTU to be significantly negative for Fu’s FSonly. As shown by
the respective unimodal mismatch distributions, the observed data for CMMOTU1and CTMOTU1are not significantly different from
modeled distributions of population expansion (Fig. 6). Goodness-of-fit estimates are Hri = 0.095 (p = 0.327) and Hri = 0.265 (p = 0.407) for CMMOTU1 and CTMOTU1, respectively. The
McDonald-Kreitman test revealed 71 polymorphic synonymous (Ps), 4 polymorphic non-synonymous (Pn), 6 fixed synonymous (Ms) and no fixed non-synonymous differences (Mn). Due to the lack of Mn, the McDonald-Kreitman test does not indicate that differences have been subject to positive selection. However, the selective pressure could have operated upon linked genes within the (single-molecule) mitochondrial genome. Moreover, even a significant result for positive selection does not necessarily exclude population expansion, as these differences could have enabled population expansion in the first place.
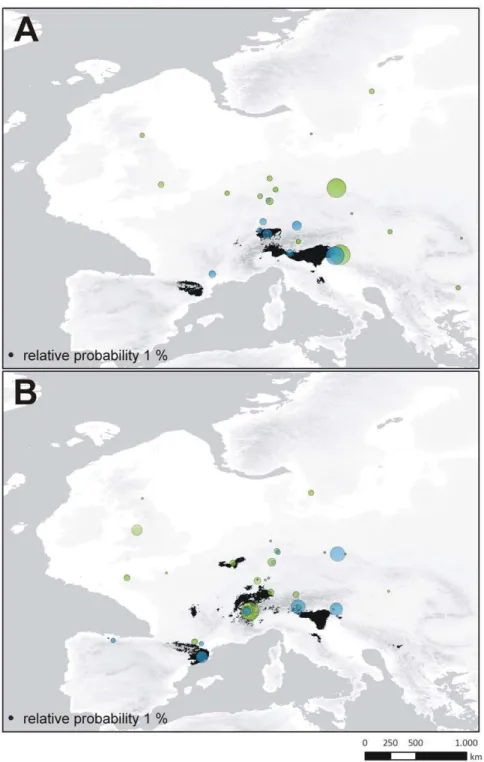
Identification of source populations of expanding lineages. The inference of the ancestral locality was conducted for a) the most widely distributed and potentially expanding haplotype lineages of CM (Fig. 4A; CMMOTU1) and CT (Fig. 4B;
CTMOTU1 and b) the second most widespread lineage of each
taxon providing sufficient occurrence data (CMMOTU4,
CTMOTU5). Results of the RLR approach reveal significant
relative probability scores (RPS) for three lineages (Fig. 7). For the CMMOTU1 lineage, a pooled locality in the Dinaric Alps
(RPSGA+TO: 38.7) and a pooled locality in the region of the
Sudetes (RPSBO+RE+SL: 35.9) possess maximal scores. The pooled
sample of PL+PO in the Dinaric Alps demonstrates the highest RPS (34.0) for the ancestral locality of CMMOTU4. A West-Alpine
pooled locality (LB+LC+LM+LT) demonstrates the maximal RPS (34.3) for CTMOTU1. In the case of CTMOTU5, no clear signal is
revealed with four localities showing comparable relative proba-bility scores (RPSBO+CE: 25.7; RPSAU+EP: 23.5; RPSLP: 19.7 and
RPSLA+SC: 18.4).
Discussion
Independent of individual responses: Alpine origin of genetic diversity
The generalness of hypotheses dealing with the location of glacial refugia, migration routes and the origin of suture zones is challenged by increased recognition of the individuality of species responses to past climatic changes [8]. Therefore, more recently Figure 5. Potential distribution models ofCarychium minimumandC. tridentatum.Shown are reconstructions for the bioclimatic conditions in present Europe (A, B) and during the European Last Glacial Maximum (LGM) approximately 21,000 years before present (C, D). Potential distribution is marked in black; triangles indicate the location of molecularly confirmed presence points obtained from this study.
performed phylogeographical studies on ‘refugia within refugia’ or ‘cryptic northern refugia’ provide even more evidence that individualistic patterns are far more diverse as initially expected [5,6,64–66]. Since gastropods are highly suitable for the study of phylogeographical patterns [14], we investigated the spatial-genetic structure of two closely related mostly sympatric European microgastropod species of the taxonCarychium. Our objective was to infer the presence of glacial refugia, events of postglacial recolonization and whether the Alpine Region (Alps+Dinaric Alps) constitutes an origin (‘hot-spot’) or crossroads (‘melting-pot’) of genetic diversity [11]. Individual responses as well as shared trends have been revealed by our study.
In general, genetically differentiated molecular operational taxonomic units (MOTUs) with limited geographical distribution can be identified for bothCarychiumtaxa (Figs. 3, 4). We expect these MOTUs to be results of allopatric populations inhabiting geographically isolated areas during the Pleistocene glaciations. Several of these geographically restricted haplotype lineages can be exclusively found or possess haplotypes specific to the Alps or to the peri-Alpine region and the Dinaric Alps hence, providing evidence for the Alpine Region ‘hot-spot’ scenario. Examples for endemic haplotypes are provided within CMMOTU3 (Alps),
CMMOTU5 (Southern Alps and Dinaric Alps), CTMOTU3
(Cen-tral+Eastern Alps and Dinaric Alps), CTMOTU7(Dinaric Alps) and
CTMOTU8(Eastern Alps and Dinaric Alps). Many of these areas
were likewise modeled as potential distribution for both taxa at the time of the Last Glacial Maximum (LGM) (Fig. 4C, D). This was expected under the Alpine Region ‘hot-spot’ hypothesis and thus, provides independent support for this scenario. Moreover, several postglacial expanding lineages provide evidence of ancestry within the Alps (Fig. 7), again favoring the Alpine Region ‘hot-spot’ hypothesis. In particular, the habitat heterogeneity of the Alps and Dinaric Alps could have significantly increased the possibility of persistence for several isolated lineages during glacial periods [30,67–69]. Microhabitats of only a few square meters in size would have been required for long term survival of these snail
species [70]. During our collecting activity in December 2008, we found active populations of CM and CT under layers of snow and ice at two localities (Fig. 1B: BA, ER). Cold-tolerant species are expected to demonstrate an even greater ability to resist the extreme climatic conditions during the LGM [13]. Finally, as several Carychium populations are known from North American caves [71–73] and specimens of CT were found in close proximity to the entrances of caves (Table 1: LP, TO), a retreat during glaciations into subterranean habitats could well have promoted glacial survival. Hence, and in congruence with former phylogeo-graphical studies [7,19,67–69,74,75], we expect the Alpine Region to exhibit potential LGM refugia forCarychiumlineages. Although the Carpathians are not modeled as a potential LGM refugium (Fig. 5C, D), the presence of specific MOTUs restricted to this area (Fig. 4: CMMOTU2 and CTMOTU4) and the independent
identification of this region in former phylogeographical studies dealing with other species (e.g. [66,75–77]) allows the assumption of an additional potential refugial area forCarychium. On the other hand, we were not able to assign MOTUs to other potentially suitable regions, such as the Pyrenees and the regions of Wallonia and Limousin (Fig. 5).
Despite overlapping potential distribution models for both taxa and time periods (Fig. 5), the genetic structure in CM is more prominent than is the case in CT (Fig. 3). A possible reason could originate from discrepancies in ecological tolerances these two taxa possess. CM is known to be a highly hygroscopic species preferably inhabiting marshes, swamps and riparian zones of permanent water systems. On the other hand, CT demonstrates a greater petrophilic affinity, is extremely tolerant of morphologically rich Figure 6. Tests of population expansion for the most widespread MOTU per taxon.Mismatch distributions and values for the neutrality tests of Fu’s FSand Tajima’s D are provided for the
haplotype lineages CTMOTU1 and CMMOTU1 (*** = p-value with
signifi-cance level ,0.00001). Solid and dotted lines indicate expected distributions after events of range expansion and the observed functions, respectively.
doi:10.1371/journal.pone.0037089.g006
Table 2.Tests for neutral molecular evolution.
taxon unit N H Tajima’s D Fu’s Fs
CM complete 325 39 20.975 26.461
MOTU1 160 17 21.784* 28.521*
MOTU2 13 2 0.782 7.801
MOTU3 28 5 0.644 1.034
MOTU4 105 9 21.656* 23.232
MOTU5 19 6 0.516 2.683
CT complete 417 39 21.587* 218.265*
MOTU1 270 14 21.977* 218.308*
MOTU2 5 2 20.817 0.090
MOTU3 18 4 20.110 1.143
MOTU4 22 4 1.115 2.312
MOTU5 70 7 20.216 20.889
MOTU6 24 4 21.279* 21.936
MOTU7 7 3 20.330 1.222
MOTU8 1 1 n. c. n. c.
Tajima’s D and Fu’s Fsneutrality tests for the complete COI-datasets and single molecular operational taxonomic units (MOTUs) ofCarychium minimum(CM) andC. tridentatum(CT). Significantly deviating values from zero are indicated in bold and marked by an asterisk; n. c. = not calculable.
and diverse mountainous terrain, and is in general, less ecologically restricted. In addition to these habitats, CT can be found in ephemeral populations inhabiting moderately moist leaf litter and sink holes [23,78–80]. These ecological differences in habitat preference and geomorphological demands could on the one hand, have led to enhanced isolation of CM populations and on the other, created a more continuous distribution area facilitating ongoing gene-flow between CT populations during glacial periods. Thus, accompanied by limited gene-flow in isolated habitats, genetic drift would have had a greater effect on
small population sizes and result in a more pronounced genetic differentiation as is revealed for CM [81]. In addition, the potential distribution models for CM and CT (Figs. 4A, B) demonstrate a significant overlap in their distribution, whereby sampling occurred sympatrically at only 24% of all localities. This discrepancy can be explained by one or more of: microhabitat differentiation as discussed above, coarse resolution of the bioclimatic variables serving as input for the potential distribution models, and the realized distributions of the taxa within their potential distributions.
Figure 7. Refugia localization reconstruction. Reconstructions for the ancestral region of potentially postglacial expanding (i.e. most widespread) lineages ofCarychium minimum(A; CMMOTU1in green; CMMOTU4in blue) andC. tridentatum(B; CTMOTU1in green; CTMOTU5in blue). The
Another significant observation is the postglacial recolonization of Northern Europe performed by a single MOTU per species with generally declining genetic diversity (Figs. 2, 4, 6). The MOTU1 of CM and CT for example, present interesting scenarios. In the case of CM, our findings suggest that the postglacial expansion of MOTU1 probably originated in the Eastern Alps (Fig. 7A). The observed pronounced genetic structure of sampling localities located in the Sudetes and a high relative probability score as an ancestral region for the latter, can be either ascribed to a comprehensive postglacial (vector-mediated) coloni-zation of this area or to the existence of cryptic microrefugia. Since our sampling within e.g. the region of the Danube valley between the Alps and the Sudetes is limited and will be subject to further investigation, both hypotheses will be discussed regarding new sampling data in subsequent work. However, our results further imply a southeast expansion of this MOTU with colonization of the Balkan area. The most widespread MOTU of CT, CTMOTU1,
most likely stretched from the Western Alps, and was able to expand and occupy previously uninhabitable areas in Northern, Western and Southwestern Europe (Figs. 5D, 7B). Further statistically non-significant range expansions are likely for two more lineages (Fig. 4). The actual peri-Alpine distribution of CMMOTU4can most likely be explained by a scenario with origin
in the Eastern Alps and postglacial expansion into the broader Alpine Region (Figs. 4A, 7A). The actual distribution of lineage CTMOTU5is highly irregular. We identified specimens assigned to
this haplotype lineage in far distant mountain ranges such as the Pyrenees, Alps and the Sudetes (Fig. 4B). Since CT generally possesses a weak genetic structuring (Fig. 3B) and CTMOTU5
demonstrates a patchy distribution, the ancestral area for this lineage could not be resolved (Fig. 7B).
Finally, we detected several regions and even sampling localities with high genetic diversity (p.0.005) that are composed of more
than one MOTU per species (Figs. 2, 4), i.e. demonstrating co-occurrences of deep intraspecific genetic lineages. TheseCarychium
populations could be either formed in zones of secondary contact between postglacial expanding MOTUs or they constitute mixed remnant populations comprising lineages from multiple intergla-cial expansion events which survived the last glaintergla-cial period in cryptic microrefugia [7–9]. The first scenario seems likely for regions along the Rhine River basin, with likely passive transportation of Carychiumlineages along the northward-flowing river system (Fig. 4). A high relative probability score for CMMOTU1and, in the case of CT, the occurrence of three highly
divergent MOTUs within the region of the Sudetes could be interpreted in terms of the location of cryptic microrefugia within this region (Figs. 4B, 7A).
To sum up, our results provide consistent, independent evidence for the Alpine Region (Alps+Dinaric Alps) serving as an origin of genetic diversity (Alpine Region ‘hot-spot’ hypothesis). This condition was most likely achieved through high habitat hetero-geneity and varying habitat suitability in this mountainous area [30]. During the postglacial period, accompanied by changing climatic conditions, several Alpine lineages of bothCarychiumtaxa were able to expand into surrounding areas to occupy previously unsuitable regions. The recolonization of northern Europe was only achieved by a single lineage in both taxa.
Anthropogenic impact on distribution and phylogeographical patterns
Since humanity has moved around the planet, ongoing globalization via migration, urbanization, and air and ship traffic has fostered homogenization of communities while simultaneously obliterating primal phylogeographical patterns [82–86]. Such
leveling was also observed in the case ofCarychium microgastro-pods. Originally endemic to Europe and Western Asia, popula-tions of CM and CT have been recorded from the Azores and from North America [29,87,88]. SinceCarychiummicrogastropods are prone to phenotypic plasticity and taxonomic identifications based on conchology alone are oftentimes inadequate for this taxonomic group [31,89], these findings hereby only compose the molecularly confirmed sampling localities of our study (Table 1). Besides additional sightings from North America [90–94], potential occurrence records have been made for North Africa [95], Israel [96] and the archipelago of Madeira [97]. As part of this study, we were able to provide the first molecular evidence of transatlantic CM and CT present on the Azores and in North America.
The high similarity or identity of haplotypes found on the Azores and in North America to European MOTUs of CM and CT suggest a recent origin (Table 1, Fig. 3). A mode of passive dispersal is most likely since neither the Azores nor North America exhibit geographical affinity to EuropeanCarychium populations. Moreover, these microgastropods are well-known entities of European greenhouses [98,99] and several studies exist where an anthropogenic introduction of European gastropods to North America has been suggested [82,83,94,100,101]. Such a scenario seems equally reasonable for the transatlantic populations of CM and CT. The transatlantic dispersal of CM populations can parsimoniously be ascribed to two separate events: Specimens found on the Azores, Portugal and in Ithaca, USA cluster within a single haplotype lineage (CMMOTU4), which otherwise is restricted
to the broader peri-Alpine region in Europe (Table 1, Figs. 3A, 4A). Although assigned to CMMOTU2, specimens obtained from
Pittsburgh, USA were genetically highly divergent from any other known European haplotype (Fig. 3A). Thus, a potential origin for this introduction could not be deduced so far. All three transatlantic localities of CT revealed haplotypes included in the most widespread and abundant European MOTU (CTMOTU1)
(Table 1, Fig. 4B), providing no further resolution but suggesting a single event of passive dispersal from Europe to the Azores with continuation to North America. If the invasion events of the Azores and North America are not linked between as well as within both species, we detect several events of passive transpor-tation. Finally, the patchy distribution of occurrence records of European Carychium species in North America (e.g. East Coast, Great Lakes region and the West Coast) potentially indicates a multitude of human-mediated passive dispersal events.
In conclusion, passive (anthropogenic) dispersal must be equally considered as a likely factor contributing to the formation of apparent phylogeographical patterns in Europe. However, we can not conclusively verify whether theCarychiumpopulations on the European mainland reached and expanded into their postglacial distributions by either actively migrating or passively dispersing via wind and water [20,102,103], large mammals, humans or birds [83,104]. Still, our data supports a mixture of scenarios in which
Carychium microgastropods actively migrated and were passively dispersed by wind (on a small scale), water (e.g. along the Rhine River), birds and large mammals including humans (most probable for postglacial recolonization of Northern Europe and the basis of transatlantic populations).
Supporting Information
[46], the results of log BF can be interpreted as substantial (K-1),
strong (1–2) and decisive evidence (.2) for a given hypothesis. (DOCX)
Table S2 Refugium localization reconstruction for expanding lineages ofCarychium minimum(CM) andCarychium tridentatum(CT). Locality abbreviations correspond to Table 1 and Fig. 1. The relative probability score (RPS) is provided for each character (i.e. locality, pooled localities) in a given lineage. MOTU = Molecular Operational Taxonomic Unit. Significant values are underlined and marked in bold.
(DOCX)
Acknowledgments
We are grateful to a large network of carychiid-savy field biologists, without whose keen eyes and perseverance, the comprehensive scope of this study
could not have been realized. We especially wish to thank Timothy Pearce for his generous help in providing material from the Carnegie Museum of Natural History’s collection as well as for collecting the Pittsburgh samples. Moreover, we highly appreciate the assistance of Claudia Steinke (Data Manager, Canadian Centre for DNA Barcoding) during the set-up of the BOLD-projects. We thank Anais Simon, Marie-Carolin Go¨tze and Claudia Nesselhauf for their help in the laboratory and Paul Sunnucks and an anonymous reviewer for their constructive comments on an earlier version of the manuscript.
Author Contributions
Conceived and designed the experiments: AW MP AJ AKK. Performed the experiments: AW MP. Analyzed the data: AW MP. Contributed reagents/materials/analysis tools: AW MP AJ AKK. Wrote the paper: AW MP AJ.
References
1. Hewitt GM (2000) The genetic legacy of the Quaternary ice ages. Nature 22:
907–913.
2. Hewitt GM (2004) Genetic consequences of climatic oscillations in the
Quaternary. Philos Trans R Soc London [Biol] 359: 183–195.
3. Avise JC (2000) Phylogeography: The history of formation of species.
Cambridge: Harvard University Press. 464 p.
4. Hickerson MJ, Carstens BC, Cavender-Bares J, Crandall KA, Graham CH,
et al. (2010) Phylogeography’s past, present, and future: 10 years after Avise, 2000. Mol Phylogenet Evol 54: 291–301.
5. Taberlet P, Fumagalli L, Wust-Saucy A-G, Cosson J-F (1998) Comparative
phylogeography and postglacial colonization routes in Europe. Mol Ecol 7: 453–464.
6. Hewitt GM (1999) Post-glacial re-colonization of European biota. Biol J Linn Soc 68: 87–112.
7. Stewart JR, Lister AM (2001) Cryptic northern refugia and the origins of the modern biota. Trends Ecol Evol 16: 608–613.
8. Stewart JR, Lister AM, Barnes I, Dale´n L (2010) Refugia revisited:
individualistic responses of species in space and time. Proc R Soc Lond [Biol] 277: 661–671.
9. Hewitt GM (2011) Quaternary phylogeography: the roots of hybrid zones.
Genetica 139: 617–638. DOI: 10.1007/s10709-011-9547-3.
10. Hewitt GM (1996) Some genetic consequences of ice ages, and their role in
divergence and speciation. Biol J Linn Soc Lond 58: 247–276.
11. Petit RJ, Aguinagalde I, de Beaulieu J-L, Bittkau C, Brewer S, et al. (2003) Glacial refugia: hotspots but not melting pots of genetic diversity. Science 300: 1563–1565.
12. Bennett KD, Provan J (2008) What do we mean by ‘refugia’? Quat Sci Rev 27: 2449–2455.
13. Bhagwat SA, Willis KJ (2008) Species persistence in northerly glacial refugia of Europe: a matter of chance or biogeographical traits? J Biogeogr 35: 464–482.
14. Pfenninger M, Posada D (2002) Phylogeographic history of the land snail
Candidula unifasciata(Helicellinae, Stylommatophora): fragmentation, corridor migration and secondary contact. Evolution 56: 1776–1788.
15. Cruzan MB, Templeton AR (2000) Paleoecology and coalescence:
phylogeo-graphic analysis of hypotheses from the fossil record. Trends Ecol Evol 15: 491–496.
16. Pfenninger M, Posada D, Magnin F (2003) Evidence for survival of Pleistocene climatic changes in northern refugia by the land snailTrochoidea geyeri(Soos 1926) (Helicellinae, Stylommatophora). BMC Evol Biol 3: 1–8.
17. Duda M, Kruckenhauser L, Haring E, Sattmann H (2010) Habitat
requirements of the pulmonate land snailsTrochulus oreinos oreinosandCylindrus obtususendemic to the Northern Calcareous Alps, Austria. Eco.mont 2: 5–12. DOI: 10.1553/eco.mont-2-2s5.
18. Gittenberger E, Piel WH, Groenenberg D (2004) The Pleistocene glaciations
and the evolutionary history of the polytypic snail speciesArianta arbustorum
(Gastropoda, Helicidae). Mol Phylogenet Evol 30: 64–73.
19. Pinceel J, Jordaens K, Pfenninger M, Backeljau T (2005) Rangewide
phylogeography of a terrestrial slug in Europe: evidence for Alpine refugia and rapid colonization after the Pleistocene glaciations. Mol Ecol 14: 1133–1150.
20. De´praz A, Hausser J, Pfenninger M (2009) A species delimitation approach in theTrochulus sericeus/hispiduscomplex reveals two cryptic species within a sharp contact zone. BMC Evol Biol 9: 171.
21. Ursenbacher S, Alvarez C, Armbruster G, Baur B (2010) High population
differentiation in the rock-dwelling land snail (Trochulus caelatus) endemic to the Swiss Jura Mountains. Conserv Genet 11: 1265–1271.
22. Duda M, Sattmann H, Haring E, Bartel D, Winkler H, et al. (2011) Genetic
differentiation and shell morphology ofTrochulus oreinos(Wagner, 1915) andT. hispidus(Linnaeus, 1758) (Pulmonata: Hygromiidae) in the northeastern Alps. J Mollus Stud 77: 30–40. DOI: 10.1093/mollus/eyq037.
23. Watson H, Verdcourt BJ (1953) The two British species ofCarychium. J Conchol 23: 306–324.
24. Morton JE (1954) Notes on the ecology and annual cycle ofCarychium tridentatum
at Box Hill. Proc malac Soc Lond 81: 30–46.
25. Culver DC, Pipan T (2009) The biology of caves and other subterranean
habitats. Oxford: Oxford University Press. 256 p.
26. Mu¨ller OF (1774) Vermivm terrestrium et fluviatilium, seu animalium
infusoriorum, helminthicorum, et testaceorum, non marinorum, succincta historia. Volumen alterum. Havniæ & Lipsiæ. 214 p.
27. Risso A (1826) Histoire naturelle des principales productions de l’Europe
me´ridionale et particulie`rement de celles des environs de Nice et des Alpes Maritimes. Tome quatrie`me. Paris: Levrault. 439 p.
28. Zimmermann F (1925) Untersuchungen u¨ber die Variabilita¨t einiger Arten des GenusCarychiumMu¨ller. Z Indukt Abstamm Vererbungsl 37: 291–342.
29. Bank RA, Gittenberger E (1985) Notes on Azorean and EuropeanCarychium
species (Gastropoda Basommatophora: Ellobiidae). Basteria 49: 85–100.
30. Garrick RC (2011) Montane refuges and topographic complexity generate and
maintain invertebrate biodiversity: recurring themes across space and time. J Insect Conserv 15: 469–478.
31. Weigand AM, Jochum A, Pfenninger M, Steinke D, Klussmann-Kolb A (2011)
A new approach to an old conundrum – DNA barcoding sheds new light on phenotypic plasticity and morphological stasis in microsnails (Gastropoda, Pulmonata, Carychiidae). Mol Ecol Resour 11: 255–265.
32. Ratnasingham S, Hebert PDN BOLD: the barcode of life data system (http://
www.barcodinglife.org). Mol Ecol Notes 7: 355–364.
33. Folmer O, Black M, Hoeh W, Lutz R, Vrijenhoek R (1994) DNA primers for
amplification of mitochondrial cytochrome c oxidase subunit I from diverse metazoan invertebrates. Mol Mar Biol Biotechnol 3: 294–299.
34. Hall TA (1999) BioEdit: a user-friendly biological sequence alignment editor and analysis program for Windows 95/98/NT. Nucl Acids Symp Ser 41: 95–98.
35. Thompson JD, Higgins DG, Gibson TJ (1994) Clustal-W – improving the
sensitivity of progressive multiple sequence alignment through sequence weighting, position-specific gap penalties and weight matrix choice. Nucleic Acids Res 22: 4673–4680.
36. Castresana J (2000) Selection of conserved blocks from multiple alignments for their use in phylogenetic analysis. Mol Biol Evol 17: 540–552.
37. Librado P, Rozas J (2009) DnaSP v5: a software for comprehensive analysis of DNA polymorphism data. Bioinformatics 25: 1451–1452. DOI: 1410.1093/ bioinformatics/btp1187.
38. Tamura K, Peterson D, Peterson N, Stecher G, Nei M, et al. (2011) MEGA5:
Molecular evolutionary genetics analysis using maximum likelihood, evolu-tionary distance, and maximum parsimony methods. Mol Biol Evol DOI: 10.1093/molbev/msr121.
39. Bandelt H-J, Forster P, Rohl A (1999) Median-joining networks for inferring intraspecific phylogenies. Mol Biol Evol 16: 37–48.
40. Clement M, Posada D, Crandall K (2000) TCS: a computer program to
estimate gene genealogies. Mol Ecol 9: 1657–1660.
41. Templeton AR, Crandall KA, Sing CF (1992) A cladistic analysis of
phenotypic associations with haplotypes inferred from restriction endonuclease mapping and DNA sequence data. III. Cladogram estimation. Genetics 132: 619–633.
42. Templeton AR (1998) Nested clade analyses of phylogeographic data: testing hypotheses about gene flow and population history. Mol Ecol 7: 381–397.
43. Drummond AJ, Rambaut A (2007) BEAST: Bayesian evolutionary analysis by
sampling trees. BMC Evol Biol 7: 214.
44. Rambaut A, Drummond AJ Tracer v1.5. Available from http://beast.bio.ed.
ac.uk/Tracer.
45. Wasserman L (2000) Bayesian model selection and model averaging. J Math
46. Jeffreys H (1961) Theory of probability (third edition). Oxford, UK: Oxford University Press, London.
47. McDonald JH, Kreitman M (1991) Adaptive protein evolution at the Adh
locus inDrosophila. Nature 351: 652–654.
48. Tajima F (1989) Statistical method for testing the neutral mutation hypothesis by DNA polymorphism. Genetics 123: 585–595.
49. Fu Y (1997) Statistical tests of neutrality of mutations against population growth, hitchhiking and background selection. Genetics 147: 915–925.
50. Rogers AR, Harpending H (1992) Population growth makes waves in the
distribution of pairwise genetic differences. Mol Biol Evol 9: 552–569.
51. Harpending HC (1994) Signature of ancient population growth in a
low-resolution mitochondrial DNA mismatch distribution. Hum Biol 66: 591–600.
52. Phillips SJ, Anderson RP, Schapire RE (2006) Maximum entropy modeling of
species geographic distributions. Ecol Model 190: 231–259.
53. Elith J, Phillips SJ, Hastie T, Dudı´k M, Chee YE, et al. (2011) A statistical explanation of MAXENT for ecologists. Divers Distrib 17: 43–57.
54. Hijmans RJ, Cameron SE, Parra JL, Jones P, Jarvis A (2005) Very high
resolution interpolated climate surfaces for global land areas. Int J Climatol 25: 1965–1978.
55. Waltari E, Hijmans RJ, Peterson AT, Nya´ri AS, Perkins SL, et al. (2007)
Locating Pleistocene refugia: comparing phylogeographic and ecological niche model predictions. PLoS ONE 2: e563. DOI: 10.1371/journal.pone.0000563. 56. Cordellier M, Pfenninger M (2009) Inferring the past to predict the future: climate modelling predictions and phylogeography for the freshwater gastropodRadix balthica(Pulmonata, Basommatophora). Mol Ecol 18: 534–544. 57. Phillips SJ, Dudı´k M (2008) Modeling of species distributions with Maxent:
new extensions and comprehensive evaluation. Ecography 31: 161–175.
58. Davies AJ, Guinotte JM (2011) Global habitat suitability for
framework-forming cold-water corals. PLoS ONE 6: e18483. DOI: 10.1371/journal. pone.0018483.
59. Fielding AH, Bell JF (1997) A review of methods for the assessment of
prediction errors in conservation presence: absence models. Environ Conserv 24: 38–49.
60. Pearce J, Ferrier S (2000) Evaluating the predictive performance of habitat models developed using logistic regression. Ecol Model 133: 225–245.
61. De´praz A, Cordellier M, Hausser J, Pfenninger M (2008) Postglacial
recolonization at a snail’s pace (Trochulus villosus): confronting competing refugia hypotheses using model selection. Mol Ecol 17: 2449–2462.
62. Pfenninger M (2002) Relationship between microspatial population genetic
structure and habitat heterogeneity in Pomatias elegans (OF Muller 1774) (Caenogastropoda, Pomatiasidae). Biol J Linn Soc 76: 565–575.
63. Maddison WP, Maddison DR Mesquite: a modular system for evolutionary
analysis. Version 2.75. http://mesquiteproject.org.
64. Avise JC, Arnold J, Ball RM, Bermingham E, Lamb T, et al. (1987)
Intraspecific phylogeography: The mitochondrial bridge between population genetics and systematics. Annu Rev Ecol Syst 18: 489–522.
65. Gomez A, Lunt DH (2006) Refugia within refugia: patterns of phylogeographic concordance in the Iberian Peninsula. In: Weiss S, Ferrand N, eds. Phylogeography in Southern European Refugia: evolutionary perspectives on the origins and conservation of European biodiversity. Springer: Kluwer Academic Publishers. pp 155–188.
66. Provan J, Bennett KD (2008) Phylogeographic insights into cryptic glacial
refugia. Trends Ecol Evol 23: 564–571.
67. Pauls SU, Lumbsch HT, Haase P (2006) Phylogeography of the montane
caddisflyDrusus discolor: evidence for multiple refugia and periglacial survival. Mol Ecol 15: 2153–2169.
68. Previsˇic´ A, Walton C, Kuc´inic´ M, Mitrikenski PT, Kerovec M (2009)
Pleistocene divergence of DinaricDrususendemics (Trichoptera, Limnephili-dae) in multiple microrefugia within the Balkan Peninsula. Mol Ecol 18: 634–647.
69. Schmitt T (2009) Biogeographical and evolutionary importance of the
European high mountain systems. Front Zool 6: 9.
70. Pfenninger M, Bahl A (1997) Influence of habitat size on the viability of
spatially structured populations of the land snailTrochoidea geyeri. Verh Ges Oekol 27: 469–473.
71. Hubricht L (1964) Land snails from the caves of Kentucky, Tennessee and
Alabama. Bull Natl Speleol Soc 26: 33–36.
72. Peck SB (1989) The cave fauna of Alabama: part I: the terrestrial invertebrates (excluding insects). Bull Natl Speleol Soc 51: 11–33.
73. Lewis JJ, Moss P, Tecic D, Nelson ME (2003) A conservation focused inventory of subterranean invertebrates of the southwest Illinois Karst. J Cave Karst Stud 65: 9–21.
74. Scho¨nswetter P, Stehlik I, Holderegger R, Tribsch A (2004) Molecular
evidence for glacial refugia of mountain plants in the European Alps. Mol Ecol 14: 3547–3555.
75. Mra´z P, Gaudeul M, Rioux D, Gielly L, Choler P, et al. (2007) Genetic
structure of Hypochaeris uniflora (Asteraceae) suggests vicariance in the
Carpathians and rapid post-glacial colonization of the Alps from an eastern Alpine refugium. J Biogeogr 34: 2100–2114.
76. Horsa´k M, Ha´jek M, Dı´te D, Tichy´ L (2007) Modern distribution pattern of snails and plants in the Western Carpathian spring fens: is it a result of historical development? J Mollus Stud 73: 53–60.
77. Ba´lint M, Ujva´rosi L, Theissinger K, Lehrian S, Me´sza´ros N, et al. (2011) The Carpathians as a major diversity hotspot in Europe. In: Zachos FE, Habel JE, eds. Biodiversity hotspots distribution and protection of conservation priority areas Part 2. pp 189–205.
78. Lozˇek V (1957) Die tschechoslowakischen Arten der GattungCarychiumMu¨ller (Mollusca, Basommatophora). Acta Soc Zool Bohemoslov 21: 225–232.
79. Doll W (1982) Beobachtungen u¨ber Lebensweise und Fortpflanzung von
Carychium tridentatumRisso im Oberrheingebiet (Pulmonata: Ellobiidae). Arch Moll 112: 1–8.
80. Egorov RV (2007) Cassidulidae, Leucophytiidae, Carychiidae. In: Egorov RV, ed. Treasure of Russian Shells, Volume 8: Ellobioidei. pp 13–28.
81. Hartl DL, Clark AG (1997) Principles of population genetics, 3rd edition.
Sunderland: Sinauer Associates, Incorporated. 519 p.
82. Lindroth CH (1957) The faunal connections between Europe and North
America. New York: Wiley. 344 p.
83. Ruiz GM, Carlton JT (2003) Invasion vectors: a conceptual framework for
management. In: Ruiz GM, Carlton JT, eds. Invasive species: vectors and management strategies. pp 459–504.
84. McKinney ML (2006) Urbanization as a major cause of biotic homogenization. Biol Cons 127: 247–260.
85. Olden JD (2006) Biotic homogenization: a new research agenda for
conservation biogeography. J Biogeogr 33: 2027–2039.
86. Jesse R, Vela E, Pfenninger M (2011) Phylogeography of a land snail suggests trans-Mediterranean Neolithic transport. PLoS One 6: e20734.
87. Weigand AM, Jochum A (2010) Mollusca, Gastropoda, Ellobioidea,Carychium
minimumO.F. Mu¨ller, 1774: filling gaps. New population record for the State of New York, northeastern United States. Check List 6: 517–518.
88. Pearce TA, Payne SL (2011) First record of the European land snailCarychium minimumin Pennsylvania, USA. Tentacle 19: 13–14.
89. Weigand AM, Go¨tze M.-C, Jochum A (2012) Outdated but established? !
Conchologically driven species delineations in microgastropods (Carychiidae,
Carychium). Org Divers Evol DOI: 10.1007/s13127-011-0070-2.
90. Clapp WF (1912)Carychium minimumMull. Nautilus 26: 24.
91. Roth B (1982) European land mollusks in the San Francisco Bay area,
California:Carychium minimumMu¨ller and theArion hortensiscomplex. Veliger 24: 342–344.
92. Forsyth RG (2004) Land snails of British Columbia. Victoria: Royal British Columbia Museum. 188 p.
93. Forsyth RG, Oldham MJ, Schueler FW (2008) Mollusca, Gastropoda,
Ellobiidae,Carychium minimum, and Ferussaciidae,Cecilioides acicula: distribution extension and first provincial records of two introduced land snails in Ontario, Canada. Check List 4: 449–452.
94. Grimm FW, Forsyth RG, Schueler FW, Karstad A (2009) Identifying land
snails and slugs in Canada: introduced species and native genera. Ottawa: Canadian Food Inspection Agency. 168 p.
95. Bourguignat JR (1864) Malacologie de l’Alge´rie: Histoire naturelle des
animaux mollusques terrestres et fluviatiles. Paris: Chalamelle Aine´. 380 p. 96. Heller J (2009) Land snails of the land of Israel: natural history and a field
guide. Sofia and Moscow: Pensoft Series Faunistica 83: 360.
97. Fauna Europaea Fauna Europaea version 2.4. Web Service available online at http://www.faunaeur.org.
98. Leiss A, Reischu¨tz PL (1996) Ein Beitrag zur Kenntnis der Molluskenfauna der Gewa¨chsha¨user in Wien und Niedero¨sterreich. Wiss Mitt Niedero¨sterr Landesmuseum 9: 173–184.
99. Horsa´k M, Dvorˇa´k L, Jurˇicˇkova´ L (2004) Greenhouse gastropods of the Czech Republic: current stage of research. Malakolo´giai Ta´je´koztato´ 22: 141–147. 100. Chapman JW, Carlton JT, Bellinger MR, Blakeslee AMH (2007) Premature
refutation of a human-mediated marine species introduction: The case history of the marine snailLittorina littoreain the Northwestern Atlantic. Biol Invasions 9: 737–750.
101. Brawley SH, Coyer JA, Blakeslee AMH, Olsen JL, Hoarau G, et al. (2009) Historical invasions of the intertidal zone of Atlantic North America associated with distinctive patterns of trade and emigration. Proc Natl Acad Sci U S A 106: 8239–8244.
102. Vagvolgyi J (1975) Body size, aerial dispersal, and origin of the Pacific land snail fauna. Syst Zool 24: 465–488.
103. Kirchner CH, Kratzner R, Welter-Schultes FW (1997) Flying snails: How far canTruncatellina(Pulmonata: Vertiginidae) be blown over the sea? J Moll Stud 63: 479–487.