0103 - 5053 $6.00+0.00
A
r
ti
c
le
* e-mail: [email protected]
Scanner Image Analysis in the Quantification of Mercury using Spot-Tests
Sidnei Paciornik,a Allegra V. Yallouz,b Reinaldo C. Campos*,c and Dani Gannermand
a
Departamento de Ciência dos Materiais e Metalurgia and cDepartamento de Química, PUC-Rio, R. Marques de Vicente, 225, Gávea, 22453-900 Rio de Janeiro-RJ
b
Departamento de Química Analítica, Centro de Tecnologia Mineral/CNPq, Av. Ipê, 900, Cidade Universitária, Ilha do Fundão, 21941-590 Rio de Janeiro-RJ
d
Departamento de Estatística, Instituto de Matemática e Estatística, Universidade Federal do Rio de Janeiro, Av. Brigadeiro Trompowsky s/no, Cidade Universitária, Ilha do Fundão, 21945-970 Rio de Janeiro-RJ
O presente trabalho apresenta um procedimento de análise digital de imagem para a quantificação de mercúrio, baseado no desenvolvimento de uma cor derivada de uma reação de “spot test”, utilizando-se um scanner comercial. A análise digital de imagem da cor desenvolvida foi usada para estabelecer uma relação quantitativa entre os componentes da cor e a concentração de mercúrio, sendo a sua intensidade relacionada à concentração na amostra original. Diferentes modelos de separação de cor foram comparados quanto à sensibilidade frente à variação da concentração de mercúrio. O modelo HLS (Hue-Lightness-Saturation) apresentou os melhores resultados, mostrando a relação linear mais sensível entre o valor da componente H (Hue) e a concentração de mercúrio. O procedimento, quando aplicado a amostras de peixes de exercícios interlaboratoriais, apresentou boa correspondência entre os valores encontrados e aqueles relatados. Os limites de detecção foram estimados em função dos intervalos de confiança das curvas analíticas obtidas, mostrando-se fortemente dependentes da faixa de calibração e apresentando um valor de 0,007 μg g-1 na amostra original (peso úmido), para um intervalo de
calibração de 100 a 600 ng.
A digital image analysis procedure for mercury quantification based on the analysis of the color developed in a spot-test derived reaction using a commercial scanner is described. The color intensity is related to the concentration in the original sample. Digital image analysis of the developed color was used to establish a quantitative relationship between the color components and the mercury concentration. Different color separation models were compared and their sensitivity to the variation of the mercury concentration was evaluated. The Hue-Lightness-Saturation (HLS) model provided the best results, showing a linear relationship between the Hue value and the mercury concentration. The procedure was used for the analysis of interlaboratorial fish samples and good concordance between found and reported values was found. The detection limits were estimated from the confidence bands of the analytical curves. For a calibration interval of 100 to 600 ng, a detection limit of 0.007 μg g-1 (wet weight) was found.
Keywords: Digital Image Analysis, mercury determination, spot-test, color models
Introduction
Digital Image Analysis (DIA) is a powerful and flexible tool with applications in many areas such as materials science, biology, medicine, and remote sensing, among
others.1,2 Once an image is digitized it can be enhanced
using various filtering techniques and analyzed to measure several parameters such as areas, shapes, color intensities,
etc. Commercial software is readily available running in personal computers with high efficiency. In many cases, quantification that would take hours or days of work using manual methods can be accomplished in minutes using DIA, allowing the user to collect much larger data sets
and obtain statistically sound results.3 When images are
Gray-scale image intensities will normally be quantized to a finite number of levels, typically 256. In this scale, zero represents pure black and 255 represents pure white. Color images can be represented in different ways and the present discussion will be limited to the
three models used in the current experiment.4 A common
scanner will normally decompose the color of each pixel intro three components: Red, Green and Blue in the RGB color model. This model mimics the color detection characteristics of the human eye, which has sensors roughly tuned to the Red, Green and Blue regions of the
spectrum. The RGB model is said to be additive because
a compound color is obtained through the linear combination of the three primary colors.
A second color model is based on a subtractive scheme
and uses the components normally employed in color printing, Cyan, Magenta and Yellow (CMY). It is called subtractive because the compound color is obtained by the successive absorption of light by the layers of paint.
The third color model is called HLS, from Hue, Lightness and Saturation. The main feature of this model is the representation of the cognitive color information in a single parameter: the Hue component. This component (see Figure 1) is represented as the angle around a circle where Red is represented by 0º, Yellow by 60º, Green by 120º, Cyan by 180º, Blue by 240º and Magenta by 300º. This representation is more straightforward in cognitive terms and it also helps to understand the relationship between primaries of the two other color models. The
primaries of the CMY model are combinations of the
primaries of the RGB model and vice-versa.
Spot-tests are selective and sensitive reactions where drops of a sample and a specific reagent are brought into
contact.5 The resulting chemical reaction generates a
specific signal, e.g. color, which will provide information
about the presence of a chemical component in the sample. The tests can be made semi-quantitative when the reaction takes place on a porous surface, such as a filter paper, where the higher contact surface allows distinction between different concentrations through the developed color intensity. Spot-tests are simple and cost-effective
methods to quantify chemical components and have been
commonly used, for example, in glucose and pregnancy tests and in the analysis of pharmaceutical preparations,
as well.6,7 Specially built low cost devices for spot test
quantitative analysis has also been proposed.8
Mercury is extremely hazardous to the environment and human health as brought to attention by the famous Minamata Bay disaster, in Japan, and has been widely used in gold
mining in third world countries.9,10 In the extraction process
mercury is used to amalgamate the fine gold particles. The excess of mercury is partially discharged into the land or rivers while the amalgam is heated releasing more mercury to the atmosphere. Oxidation and methylation processes occur, and methylmercury is accumulated and biomagnified
along the food chain.11 In particular, mercury is readily
accumulated in fish which is by far the largest contamination
source for humans.12 In Brazil, the strongest contamination
occurs in the Amazon region where many rivers have been affected and many fish species already show high mercury
content, especially those on the top of the food chain.13
Nevertheless, fish is still the main protein source of many Amazonian communities, and some kind of sanitary control seems necessary, although such control faces the lack of
appropriate laboratorial conditions in the region.14
In a previous work a non-instrumental semi-quantitative method for Hg determination in fish based on a spot test
reaction was described.15 The method aimed at be used in
isolated Amazonian communities where few facilities are
available and fish is the main protein source.16 However,
spot-tests are normally limited in their applicability because a human operator evaluates the color and only concentration ranges can be discriminated. Thus, the method proposed herein aims at eliminating this limitation by the use of a commercial scanner taking the advantages of DIA techniques in which the color is measured and digitally decomposed and analyzed with easily available software.
Experimental
Instrumentation
For comparison, the detecting papers were also analyzed by cold vapor atomic absorption spectrometry (CVAAS), using a modified VGA 76 mercury vapor generator (Varian) and a Varian AA6 atomic absorption
spectrometer.17 A Varian mercury hollow cathode lamp,
operating at 6 mA was used as line source, at 253.7 nm. All other instrumental parameters were set as recom-mended by the manufacturer.
Reagents and solutions
All chemicals used in the experiments were of analytical grade. Milli Q water was used throughout. Cuprous iodide was synthesized in the laboratory, using cupric sulfate, sodium sulfite and potassium iodide (all Merck, Darmstadt, Germany). The analytical solutions were freshly prepared from convenient dilutions of a 100
ng mL-1 working solution, conserved with 5% HNO
3 and
0.01% K2Cr2O7 (Merck, Darmstadt, Germany). This
working solution was daily prepared from a 1000 mg L-1
stock solution (Titrisol, Merck, Darmstadt, Germany). Vanadium pentoxide (BDH Chemicals LTD, Poole,
England), KMnO4, NH2OH.HCl, SnCl2 (all Merck,
Darmstadt, Germany) and HCl and H2SO4 (Vetec, Rio de
Janeiro, Brazil) were also used.
Detecting papers
The color development was based on the well-known reaction between mercury vapor and cuprous iodide. The detecting papers were prepared by a hand-made method of depositing the sensitive emulsion, similar to that of the silkscreen technique. The detecting emulsion was prepared mixing 5 g of cuprous iodide, 10 g of 3% carboxymetil-celulose and 1.5 g of magnesium chloride. A 3 MM Whatmann chromatography paper was used as support. More details on this preparation procedure are given
elsewhere.15,18 The covered papers were hermetically
stored in a container with controlled humidity (95%).
Preparation of samples for image analysis
Properly prepared detecting papers were exposed to the mercury vapor using the experimental setup shown in Figure 2. A controlled flow of compressed air carries the mercury vapor generated in the conical flask through the paper, forming the colored compound. The experimental conditions are shown in Table 1 and were optimized as
described elsewhere.15 For determining the relationship
between the amount of mercury passing through and trapped on the detecting paper, as well as the respective developed color characteristic and intensity, 20 mL of solutions containing increasing mercury masses (up to 6
μg of Hg) were used: SnCl2 was added as reductant and
the Hg0 formed aerated to the detecting paper. The papers
were then analyzed by DIA and, subsequently, by cold
vapor AAS, after digestion.
Digital Image - acquisition and analysis
The colored papers were scanned in an AGFA Studio Scan SI desktop scanner with 400 dpi optical resolution and 24 bits of color quantization (for a total of 16,777,216 colors). This type of scanner may use two different procedures to adjust its detection range to the minimum and maximum intensities of light reflected from the sample:
(i) a manual procedure in which the user chooses the
locations of maximum and minimum based on a preview
of the image or (ii) an automatic calibration in which the
rectangular area of the scanner bed that contains the sample is analyzed, the minimum and maximum intensities are obtained and the sensitivity range is adjusted.
The manual procedure was immediately discarded because it was too operator dependent to be reliable. Thus, the automatic procedure should perform better. However, because the paper sizes, shapes and positions in the scanner bed were not identical, it would still auto-calibrate to different ranges for different samples, making quantitative
Figure 2. Experimental Setup: 1, o-ring holder; 2, detecting paper; 3, external PVC tube; 4, internal PVC tube; 5, digestion vessel.
Table 1. Optimized conditions for mercury vapor capture by the detect-ing paper
Parameter Value
Detecting paper diameter, (mm) 20 Air flow, (mL min-1) 50
Collecting time, (min) 30
comparisons impossible. Thus, a normalization procedure was devised in which the same stable reference was scanned along with each sample, and its color components were used to normalize the color components of the samples. The reference used was a common colored card stock that was tested for color stability. The sample papers were scanned immediately after the chemical reaction took place to minimize the effect of color degradation of the
formed complex.18
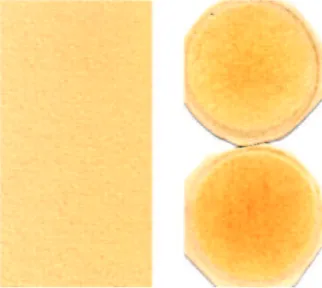
Figure 3 shows one of the scanned images that included the reference paper and two different samples. The color components were evaluated using the Digital Micrograph program [Gatan, Inc. – 5933 Coronade Lane, Pleasonton, California, USA, 1977] with a customized routine that was developed specifically for this work. The main steps of the routine were as follows: The scanned image was decomposed into seven images representing the six components of the RGB and CMY models and the Hue component of the HLS model. Based on the original color image, the mouse was used to select square areas of 120x120 pixels over the reference and the samples. The program then automatically calculated the average intensity value of each of the areas on all seven component images. The normalization was done dividing each component average value by the average value of the same component on the reference image. The normalized average values were then correlated to the mercury contained in the detecting paper.
Dissolution of the detecting paper for the comparative instrumental analysis
After the Hg collection and digital image acquisition the filter paper was transferred to a 250 mL conical flask,
followed by the addition of 20 mL of a H2SO4:HNO3 (1:1),
mixture containing 0.1% (m/v) vanadium pentoxide. The
digestion was performed on a hot plate, at 80 oC, using
cold finger stoppers. After the total sample dissolution, 2 mL of 5% potassium permanganate (Merck, Darmstadt, Germany) solution were added to complete oxidation. Just prior to the instrumental analysis, the excess of oxidant was reduced by the addition of sufficient volume of a 50%
(m/v) NH2OH.HCl. Freshly prepared 20% (m/v) SnCl2
solution in 50% v/v HCl was used to the mercury vapor chemical generation. Interlaboratory exercise fish samples (Canadian Food Agency, samples MQAP 301 and 302) were analyzed in the same way, using 10 g aliquots.
Results and Discussion
The first attempts used only the RGB model. The sensitivity to mercury mass variations was very low for all three components and this model was subsequently discarded.
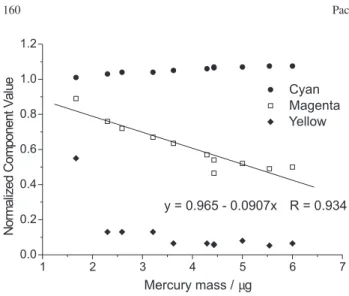
The CMY model provided much better results. Figure 4 shows the separation of primary colors in the CMY model for several samples with increasing mercury mass. It is easy to notice that the cyan component has a small contribution to the developed color and also shows low sensitivity to the mercury mass variation. The yellow component seems to saturate quickly with the increase of the mercury mass. The magenta component shows a higher sensitivity in a continuous color gradation. Figure 5 shows the variation of the normalized component values in relation to the mercury mass trapped on the corresponding paper and the plots confirm the visual observations. Regarding the construction of an analytical curve, the magenta component could be useful once it shows an approximately linear dependence with the mercury mass, with a correlation coefficient of 0.93 for a straight line fit.
As already discussed, the Hue concentrates the cognitive color information. Thus it is reasonable to expect that it would provide a more generic measurement regardless of the specific range of colors developed by the reaction. Figure 6 shows the plot for the normalized Hue value against the
Figure 3. Digitized image of two samples with the reference paper on the left-hand side. The squares indicate the measured area.
mercury mass. The Hue component shows a closer linear behavior (correlation coefficient = 0.96) and a larger slope and thus is a better candidate for the response variable in an analytical curve for mercury determination.
To test the stability of the method against equipment changes, another set of experiments was performed, using a Hewlett Packard ScanJet IIC scanner. In these experiments the true mercury mass in the indicating paper was not measured by CVAAS. Rather, the initial mercury mass in the analytical solution was used, considering 100% recovery. Again, a significant linear correlation (correlation coefficient = 0.98) between Hue and mercury mass was obtained, even though the line equations were different.
Analytical figures of merit
The limit of detection was calculated according to
Burdge et al.19 This procedure is based on the regression
approach that takes into account the confidence bands of
the analytical curve. In their original work, Burdge et al.
investigated the most usual case where the analytical response increases with the increase of the analyte concentration. However, the present case shows the inverse situation. Nevertheless, it is possible to prove that the same approach can be used, just changing the signal between the two terms of their equation and multiplying the final result by –1. Applying this modified equation to the data
displayed in Figure 6, a limit of detection of 2 μg was
estimated. Coefficients of variation (n=5) calculated for
Hg masses of 0.5, 3 and 6μg ranged from 3 to 1%. The
method was then used for the analysis of fish samples delivered for interlaboratory exercises by the Canadian Food Agency. The fish muscle samples (10 g) were digested as described for the detecting papers and their
mercury content aerated and trapped by the detecting papers whose color was digitally analyzed. In this case,
15 mL of 50% (m/v) SnCl2 should be used as reductant.15
The analytical curve was performed with aqueous analytical solutions containing 100, 200, 300, 400, 500 and 600 ng of mercury, and their correspondent color digitally analyzed as described. The papers were not digested, that is a 100% recovery was considered, and a correlation coefficient of 0.997 was observed. The values found by the proposed procedure were 0.31 ± 0.03 and
2.52 ± 0.25 μg g-1 (n=3), in good concordance to those
reported after the interlaboratory exercise, that is 0.37 ±
0.06 and 2.16 ± 0.43 μg g-1, respectively. Once lower
mercury masses were used for calibration in comparison to the data displayed in Figure 6, the absolute detection
limit dropped to 70 ng, corresponding to 0.007 μg g-1 (wet
weight) in the original fish samples. This influence of the analytical curve range on the limit of detection is expected due to the mathematical model used for its calculation.
Conclusions
Image analysis has been finding a number of
applications in different areas of chemistry.20-22 In the present
work Digital Image Analysis for color quantification using a commercial scanner converged with a spot test resulting a successful procedure for mercury determination. Color component separation, followed by average pixel intensity measurement proved to be a useful tool for mercury determination. Among the color separation models investigated, the CMY and HLS were the most useful. Both the Magenta (CMY model) and Hue (HLS model) components showed linear relationships with the mercury mass. The Hue component (HLS model) was more sensitive and showed a closer to linear correlation to mercury mass
Figure 5. Normalized Cyan (y), Magenta ( ) and Yellow () compo-nents against mercury mass. The equation in the insert is the best straight line fit (SLR) for the experimental measurements of the magenta compo-nent.
variation, thus becoming the recommended component for this procedure in future works. Compared to color evaluation by visual inspection, the method is advantageous because subjectivity is avoided. The normalization procedure using an internal color standard overcame discrepancies caused by the automatic calibration procedures of the scanners. Moreover, the results of the experiments with different scanners indicate that the linearity is an intrinsic characteristic of the procedure.
Although not presenting the same performance as the traditional instrumental methods for mercury determination (CVAAS, for instance), the proposed procedure is a simple and relatively inexpensive alternative for the determination of mercury. This was demonstrated for fish and can certainly be extended to other kind of samples. Fish contamination by mercury is an endemic problem in the Brazilian Amazon region, where lack of laboratorial conditions is recognized. Besides a personal computer and a scanner, all that is required is easily available glassware for the vapor generation setup, the indicating paper and common chemicals. Concerning the personal computer and the scanner, such facilities are much more available than any analytical instrumentation, including hand reflectometers. For a given experimental setup, it is necessary to plot a calibration curve for the specific scanner used. This can be easily done using solutions with known mercury concentration. The scanner stability should be checked regularly by using fresh calibration solutions.
References
1. Russ, J.C.; Image Processing Handbook, CRC Press: New York, 1992.
2. Sonka, M.; Image Processing, Analysis, and Machine Vision, PWD Publishing: New York, 1999.
3. Martins, A. R.; Paciornik, S; Pereira, J. A. S.; Proceedings of IMEKO 2000 - International Metrology Conference, Wien, Austria, vol. IX, pp.121-126, 2000.
4. Foley, J.; Computer Graphics: Principles and Practice, 2nd ed.,
Addison-Wesley Publishing Company: Massachusetts, 1990.
5. Feigl, F.; Spot Tests in Inorganic Analysis, 5th ed., Elsevier:
Amsterdam, 1958.
6. Jungreis, E.; Spot-Tests, Clinical, Environmental, Forensic, and Geochemical Applications, John Willey & Sons: New York, 1984.
7. Matias, F. A. A.; Vila, M. M. D. C; Tubino, M.; J. Braz. Chem. Soc, 2004, 15, 327.
8. Rossi, A.V.; He, X.W.; Tubino, M.; Anal. Lett. 2000, 33, 1885. 9. Harada, M.; Crit. Rev. Toxicol. 1995, 25, 1.
10. Marsden, J.; Hause, I.; The Chemistry of Gold Extraction, 1st
ed., Ellis Horwood: New York, 1993.
11. World Health Organization (WHO); Environmental Health Criteria 101, Methylmercury, Geneva, 1990.
12. Hacon, S. S.; Farias, E. A.; Campos, R. C.; Argento, R. R.; Rossi, A. P.; Caires, S. M.; Valente, J.; Wasserman, J.;
Environmental Sciences. 2003, 10, 121.
13. Malm, O.; Castro, M.B.; Bastos, W. R.; Branches, F. P.; Guimarães, J. R. D.; Zuffo, C. E.; Pfeiffer, W.C.; Sci. Total Environ. 1995, 175, 127.
14. Hacon, S.; Yakoo, E.; Valente, J.; Campos, R.C.; Silva, V. A.; de Menezes, A.C. C.; de Moraes, L. P.; Ignotti, E.; Environ. Res. 2000 A 84, 204.
15. Yalouz, A. V.; Campos, R. C.; Paciornik, S.; Fresenius’ J. Anal. Chem. 2000, 366, 461.
16. Bidone, E. D.; Castilhos, Z. C.; Cid de Souza, T.M.; Lacerda, L.D; Bull. Environ. Contam. Toxicol. 1997, 59, 194. 17. Limaverde Filho, A. M.; Campos, R. C.; Quim. Nova 1999, 22,
477.
18. Yallouz, A. V.; Ph.D. Thesis, Department of Chemistry, Pontifical Catholic University: Rio de Janeiro, Brazil, 1998. 19. Burdge, J.R.; Mac Targart, D.L.; Farwell, S.O.; J. Chem. Educ.
1999, 76, 434.
20. Geladi, P.; Wold, S.; Anal. Chim. Acta 1986, 191, 473. 21. Geladi, P.; Bengtsson, E.; Esbensen, K.; Grahn, H.; TrAC,
Trends Anal. Chem. 1992, 11, 41.
22. Geladi, P.; Bengtsson, E.; Esbensen, K.; Grahn, H.; TrAC,
Trends Anal. Chem. 1992, 11, 121. 23. Geladi, P.; Mikrochim. Acta 1995, 120, 211.
Received: November 8, 2005