PERSP CTIVES IN
FUN
ENTAL
ND
ApPLIED
RH
OLO Y
EDITED BY:
F.J.
RUBlO - HERNANDEZA.1.
GÓMEZ - MERINOC. DEL PINO
L.PARRAS
L. CAMPO - DEANO
EJ. GALINDO - ROSALES
“NOTICE: this is the author’s version of a work that was accepted for publication in the Book Perspectives in Fundamental and Applied Rheology. Changes resulting from the publishing process, such as peer review, editing, corrections, structural formatting, and other quality control mechanisms may not be reflected in this document. A definitive version is available in the Book Perspectives in Fundamental and Applied Rheology, Rubio-Hernández, F. J., et al. (Eds), Gráficas Fernando, 363-367, 2013.
Perspectives in Fundamental and Applied Rheology Part V: Non-Newtonian Fluid Mechanics
CHAPTER 7
Visualization of the cell-free layer (CFL) in a PDMS
microchannel with a micro-stenosis
Diana Pinho1,2, Tomoko Yaginuma 2, Vera Faustino1,2, Elmano Pinto1,2, Raquel O. Rodrigues2, Diana Cidre 2, Ana I. Pereira2,3, Rui Lima1,2
1CEFT, Faculdade de Engenharia da Universidade do Porto (FEUP),Portugal 2ESTiG, Polytechnic Institute of Bragança, Portugal
3Algoritmi, Universidade do Minho, Portugal
Introduction
Red blood cells (RBCs) are responsible for the supply of oxygen and nutrients to the body and removal of carbon dioxide and metabolic wastes from tissues. The blood flow behaviour in microcirculation depends on several combined effects such as cell deformability, flow shear rates and geometry of the microvessel, as well as biochemical and biophysical factors which may also affect the rheological characteristics of blood [1-5].
propose a combination of image analysis techniques able to measure automatically the CFL thickness before and after micro-stenosis is used.
This paper is organized as follows. The section Experimental consists of Working fluids and microchannel geometry, Experimental Set-Up and Image Analysis. In the section Results and Discussion, it is presented and discussed the results.
Experimental
Working fluids and microchannel geometry
The fluid used in this study was dextran 40 (Dx40) containing about 9% (i.e. Hematocrit, Hct = 9) by volume of human RBCs. The samples of blood were collected from a healthy adult volunteer and heparin was added in order to prevent coagulation. The RBCs were washed twice with a physiological saline (PS) solution and diluted with Dx40 to make up the required RBC concentration. All blood samples were stored hermetically at 4ºC until the experiments were performed at controlled temperature of approximately 37ºC. All procedures in this work were carried out in compliance with the Ethics Committee on Clinical Investigation of Tohoku University.
The microchannels tested in this study were fabricated using common soft-lithography
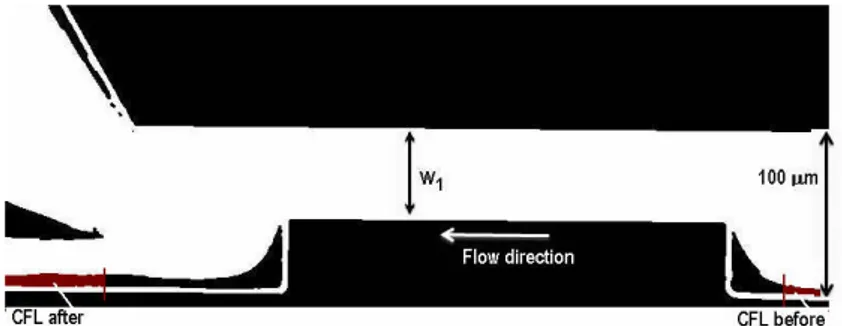
techniques and consist in a straight channels with 100 m of wide and with a micro-stenosis
regions of 25 m and 50 m of wide (W1), Figure 1.
Figure 1. Schematic view to represent the areas where the data was taken, before and after the artificial micro-stenosis.
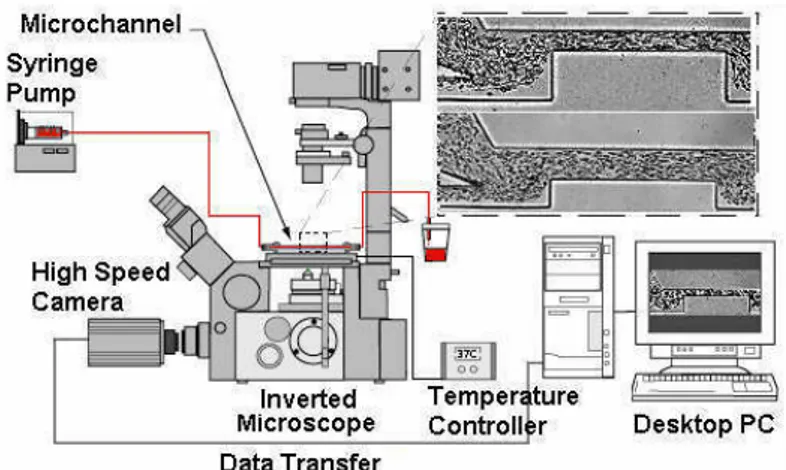
Experimental set-up
Figure 2. High-speed video microscopy system.
Image analysis
The image sequence were captured at the centerplane of the microchannels with a resolution of 800304 pixels, at a rate of 8000 frames/s and an exposure time of 0.125 ms, then all videos were transferred to the computer and evaluated in Image J (NIH) [6].
First, the captured videos were converted to a sequence of static images (stack) and then, for each pixel, the maximum intensity of all the images in the stack was selected using the “Z project”, a function from ImageJ.
The results image has a region of RBCs core brighter than the background. To obtain the data it is necessary to apply a level of threshold to convert the grey scale images into binary images. An example of a binary image obtained after image processing is presented in Figure 3 b).
Results and Discussion
In this section the results of flow visualizations are presented and discussed and the effect of a micro-stenosis on the CFL thickness is evaluated.
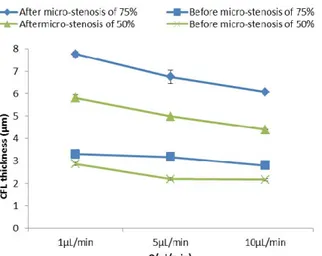
In Figure 4 it is possible to observe the data obtained using the image analysis techniques already described in the section Image analysis.
Figure 4. CFL thickness before and after the micro-stenosis for different flow rates.
Figure 4 shows visibly that for both micro-stenosis, 75% and 50%, the CFL thicknesses are enhanced. Moreover, it is also clear that the enhancement is more pronounced for the channel with a contraction of 75% than that for the micro-stenosis of 50%. In the next figure it is possible to observe better this conclusion.
Figure 5 represents the difference between the CFL thickness after and before, CFL(after)-CFL(before), for the both geometries studied in this work. As seen in the previous figure, the biggest contraction leads to a bigger difference between after and before CFL thickness.
The results suggest that the CFL thickness increases for larger contraction ratio. This way we expect to deeply understand the effect of the constrictions on the CFL thickness and consequently use these results to design and optimize a biochip able to perform in one single
channel both cell separation and deformation measurement
.
Acknowledgments
The authors acknowledge the financial support provided by: BEB/108728/2008, PTDC/SAU-BEB/105650/2008, PTDC/EME-MFE/099109/2008 and PTDC/SAU-ENB/116929/2010 from FCT (Science and Technology Foundation), COMPETE, QREN and European Union (FEDER).
References
1. Caro, C., Pedley, T., Schroter, R. and Seed, W. (1978). Oxford University Press.
2. Lima, R., Ishikawa, T., Imai, Y. and Yamaguchi, T. (2012). In Single and two-Phase Flows on Chemical and Biomedical Engineering, (Dias et al. Eds.), pp. 513-547, Bentham Science.
3. Lima, R., Ishikawa, T., Imai, Y., Takeda, M., Wada, S. and Yamaguchi, T. (2009). Annals of Biomedical Engineering. 37, 1546-59.
4. Fujiwara, H., Ishikawa, T., Lima, R., Matsuki, N., Imai,Y., Kaji, H., Nishizawa, M. and Yamaguchi, T. (2009). Journal of Biomechanics 42, 838-843.
5. Lima, R., Oliveira, M.S.N., Ishikawa, T., Kaji, H., Tanaka, S., Nishizawa, M. and Yamaguchi, T., (2009) Biofabrication, 1, 1-7.
6. Faivre, M., Abkarian, M., Bickraj, K. and Stone, H. (2006). Biorheology 43, 147-159.