Demography
This article analyses population changes in North-West regions of Russia (the former Northwestern economic zone and the Kalinin-grad region) and the Baltics at the level of urban districts and municipalities. The cohort component method is used to analyze the youth population dynamics in the administra-tive territorial units of this level, which makes it possible to estimate the international (int-raregional) migration of this population group. This method is used quite rarely, yet it is more accurate in studying the shifts in dist-ribution of this group of population than current statistics. The article uses the data of the last two censuses (2000 and 2010), name-ly, the population size and the age and gen-der composition. In orgen-der to demonstrate the core-periphery relationship, the authors iden-tified the core ATUs (national and regional capitals and capital areas), whereas the other units were grouped by their remoteness from the center. The analysis shows that in the countries and regions studied, population concentrates in the capitals and capital areas, whereas the periphery loses popula-tion at a fast rate. The centripetal movement is especially pronounced with the youth; mo-reover, it affects not only the size but also its structure of population in the core and peri-phery areas, which aggravates the processes of depopulation and ageing.
Key words: population, migration, city, district, youth, core-periphery
The demographics and spatial geo-graphy of the Russian North-West and the Baltics have a lot in common. Over the last two decades (see table 1) both re-gions have seen natural decrease of the population in urban and rural areas. The population is ageing and changes in the age structure become significant to the negative trends in population develop-ment. In fact, the Baltics and the Russian North-West are quite similar in that ne-gative demographic dynamics.
THE BALTICS AND RUSSIAN NORTH-WEST: THE CORE
AND THE PERIPHERY IN THE 2000S
N. Mkrtchyan
*L. Karachurnia
**
Higher School of Economics National Research University.
20 Myasnitsky St., Moscow, 101000, Russia
Submitted on March 10, 2014.
doi: 10.5922/2079-8555-2014-2-4
Table 1
Natural Growth and Migration the Russian North-West and the Baltics in 2000 and 2010 (per 1000 people)
Natural growth Net migration Region, country
2000 2010 2000 2010
Kaliningrad region –7.4 –2.8 5.5 6.2
Leningrad region –12.8 –6.1 7.8 15.0
Novgorod region –12.4 –8.7 1.8 –2.1
Pskov region –14.7 –10.7 1.1 –5.0
Saint Petersburg –9.5 –2.0 2.5 15.7
Estonia –3.9 0.0 0.2 0.0
Latvia –5.0 –4.9 –2.4 –3.6
Lithuania –1.4 –3.7 –5.8 –23.7
Sources:Rosstat data 2002, 2012; Eurostat. URL: evrostat. eu
The slowdown of natural growth and its gradual transformation into natural decrease moves the migration issue in the population dynamics and territorial distribution to the top of the agenda. Migration, however, can both aggravate the negative trends in population growth and mitigate its conse-quences. Age structure and settlement selectiveness that were characteristic to the migration patterns in the Soviet period [4] are still observed today.
General differences in the migration patterns in individual regions of the Russian North-West and the Baltics can be quite dramatic (see table 1). Es-tonia, Latvia, and Lithuania have been showing a negative net migration rate ever since the countries regained their independence. Russian north-western regions, on the other hand, have demonstrated both a negative (Pskov region) and positive (Kaliningrad region) migration rate. On the whole, due to their geopolitical location these regions have been able to benefit from the “western drift” and have generally enjoyed a rather favourable migration si-tuation. Yet the traditionally “attractive” Leningrad region and Latvia with its negative net migration rate have been characterised by both pull and push
effects and considerable internal differences of migration patterns over the recent years.
Overall demographic situation affects interactions between urban and ru-ral population distribution [3, p. 3]; the features of differential urbanisation stage become more prominent [23], while its very nature is undergoing cri-tical transformations.
indivi-dual behavioural strategies, work-life balance and personal growth. Against the high level of urban development, post-industrial trends were observed in the Baltic Sea states as early as the late Soviet period. Rural-urban migration halted in 1982 in Estonia and in 1983 in Latvia; while the period from 1984 to 1989 was characterised by an influx of the population to the rural areas in most Estonian counties. According to K. Katus and L. Sakkeus, this phenomenon can be viewed as “direct evidence of an increasing wave of deurbanisation that followed the long-term process of the concentration of population in urban areas… This new trend emerged before the economic transition and social transformation in Estonia” [7, p.173].
Another serious obstacle to the development of an urbanistic system of the Western European type — from urbanisation and concentration during active industrialisation to suburbanisation and deconcentration in the post-industrial period [22—24] — was the systemic economic crisis of the 1990s. In particular, the crisis in agriculture, lack of funding in rural municipalities, and restructuring of social support institutions had an adverse effect on this process. Yet there is a significant number of Estonians expressing the wish to live in private suburban houses while citing lack of opportunity to do so. [27]. In Russia with its vast territory and the ensuing need to travel long distances a new type of “dacha” suburbanisation [14; 17] came about, whe-rein people would often leave for the suburbs temporarily (for a weekend or for holidays) but would do so without changing their permanent place of re-sidence, which, of course, hampered the proper development of suburban areas. As a result, population deconcentration under the influence of subur-banisation has not taken place yet.
Moreover, one of the currently observed features is the concentration of population in central cities of regions, as well as those situated in the zones of economic attraction of rural administrative districts [5], i.e. “ the struggle between centres and peripheries” [10]. This struggle is one of the reasons behind centralisation of power and such distribution of funds where a town with a higher level of development has, potentially, more chances for rele-vant prosperity [11]. Of crucial importance is the position of a village, or a small town, relative to the central town — or that of “periphery” relative to the “core”. The differences between the core and the periphery develop for other reasons than those that had been formulated in the classical core-periphery theory; yet the very fact of their existence corresponds to the mechanisms described by Friedmann [21] and his followers [2; 9; 29; 30]. The centres grow stronger and richer at the expense of the periphery that loses its population to the centres.
Sources and Methodology
The source of information for this study is the data on the size and age and sex structure of population of towns and districts of selected regions of the Russian North-West (Saint Petersburg, Leningrad, Novgorod, Pskov, and Kaliningrad regions) and the Baltics based on the censuses taken in 2002 and 2010 in Russia, 2000 and 2011 in Latvia, 2001 and 2011 in Lithuania, and 2000 and 2012 in Estonia. The results of these censuses are available on the official websites of corresponding national statistical agencies.
In Russia, the data was accumulated at the level of administrative districts and towns, in Latvia at that of districts and town, in Lithuania — at the level of municipalities, in — at the county Estonia level. Russia and Lithuania saw a range of administrative reforms between their censuses, which we had to account for in our conducting this study. In Russia, for example, the level of administrative districts and towns was replaced with that of urban and municipal districts according to Federal Law No 1311. To obtain comparable data, the 2010 census results were standardised to fit the 2002 format. A similar problem arose with Latvia, where, as a result of the 2009 administrative reform, the country’s territory was divided into 110 mu-nicipalities instead of the earlier 26 districts; that also required some adjust-ment on our part. In total, we have analysed data on 197 comparable territorial units.
Administrative units (AUs) under analysis correspond to the NUTS-3 le-vel according to the international nomenclature of territorial statistics. Despite the fact that the recent censuses were carried out by the state and are, for all intents and purposes, official, there are a number of issues that cause concern. They have to do with both the method (for instance, the 2011 Latvian census was conducted with a several month interval as a result of the faulty personal data protection and ensuing procedural problems) and the pool of respondents, which some consider insufficient.
We aim to study the population of AUs of comparable levels; analyse its size and dynamics both directly (through an analysis of increase/decrease rates) and indirectly (through the age and sex structure). At the level of each AU, the aggregated data makes it possible not only to understand the trends in population size dynamics, but also to observe possible changes in the population distribution network.
The method of the study involved using the core-periphery concept as a mechanism for analysing the connection between demographics and migration and population distribution. Here we assumed that at all stages of the core-periphery system, the dynamics of population size would be diffe-rent between the cores and the periphery. However, the periphery is not ho-mogenous — there is “adjacent” and “remote” periphery depending on its re-lation to the core.
The central AUs (core) include the capital (in Russia, regional centres) and the central, metropolitan district or districts — in case a large city bor-ders several administrative districts.
1
Each country (region) only has one centre. However, apart from the ca-pital, they can have other large cities that will be analysed in the context of their position relative to the centre. These cities, as it will be shown below, can also serve as local cores.
The peripheral AUs relationship to the centre can be described in terms of the distance from the centre (km)2. It is also possible to rank periphery re-gions according to their remoteness from the centre. In this case, the pe-riphery districts will be divided into seven groups.
The two classifications complement each other. The distance criterion, for example, is less susceptible to differences in the sizes and configurations of AUs in densely and sparsely populated areas making it possible to delineate more specific groups. The rank criterion makes it possible to take into account the varying degrees of connection to the centre that characterize adjacent and remote districts (especially in the case of vast areas) and, therefore, different possibilities for commuting, holiday making and social and labour relations.
To analyse the migration of people aged 18—22 between the core and peripheral AUs we applied the cohort component method. The population group in question has often been the focus of migration studies. The works of V.I. Perevedentsev published in the late 1980s identified three major groups of young people migrating from rural to urban areas: 15—16 year olds3, or secondary school graduates; 17—18 year olds, or high school gra-duates; and 20—21 year olds, or those who have just completed their army service [18]. Today, the age of increased mobility for young people coinci-des with that of graduation from college and/or vocational school.
Thus, the cohort component method can show how many of the children aged 6 to 10 that had been registered by the census in 2000, say, in the Estonian Ida-Viru Country, resided in the same territory in 2012 (2012 census would in this example account for the age group of 18 to 22 year olds). For us it means that we can make migration estimates within the cohort, and identify the role of migration in the dynamics of the age structu-re. The cohort component method4 requires a number of necessary simplifi-cations: it does not take into account survival rate within the cohort; pro-jections can only be made for a pre-set number of years (12, for instance), although the gap between the censuses can be smaller or larger. Besides, cen-sus data itself is not perfect. In Russia, for example, information about young people is often given by their parents still living at the same residence.
General Population Dynamics in the 00s in the Russian North-West and the Baltics
In the 00s, changes in the population depended on the AU’s position in the system of core-periphery relations. Regardless of the general dynamics that differed across the analysed territories, the population of the centres
2
Calculated according to [1]. In some cases, data of open web sources were used. 3
Migration of population aged 15—16 is almost absent in modern Russia. At this age, young people usually live with their parents and are not predisposed to inde-pendent migration.
4
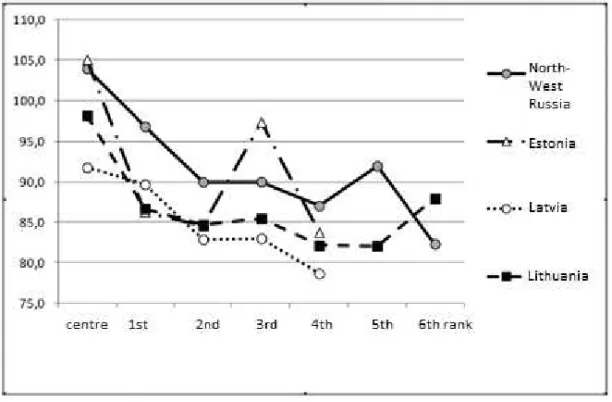
exhibited better statistics (fig. 1). However, the negative ratio of population growth to the growth of distance from the core — as observed for Russia and Latvia — did not reoccur in Lithuania or Estonia. It did not matter whether the peripheral territory was 50, 100, or 150 km away from the centre; the distance factor did not affect the population growth data (however, it does not necessary hold true for the other factors).
It is interesting, in case of Estonia, there are zones of almost zero po-pulation decrease (fig. 1) at a significant distance from the centre. Tartu — the second most populated and significant city of the republic is situated in one of these zones. By contrast, in Lithuania the population size of periphe-ral areas decreases at a constant rate regardless of their remoteness from the centres, and the losses in the most remote AUs are lower than those in the most adjacent territories (which can in part be explained by the fact that coastal areas with recreational facilities attract most migrants, as does Klaipeda County, for example). It is also worth noting that the second largest city of Lithuania — Kaunas — is losing population but at a slower rate than the national average. In Latvia, a decrease in Riga’s population is counter-weighed only by an increase in the population of the capital’s suburbs: in the 00s, this area showed a positive net migration rate as a result of su-burbanisation [25]. There are no other population growth poles in the country, despite the presence of relatively large towns — Daugavpils, Lie-pāja, and Jelgava.
Fig. 1. Population Size of the Lower-level AUs Vs. Distance from the Centres of Countries (Regions) in the 00s,% from the Beginning of the Period
NB: data on Russia as of 2003—2010, Latvia 2000—2010, Lithuania 2001— 2010, Estonia 2000—2011.
Sources: Rosstat databases, Lietuvos Statistikos Departamentas, Latvijas
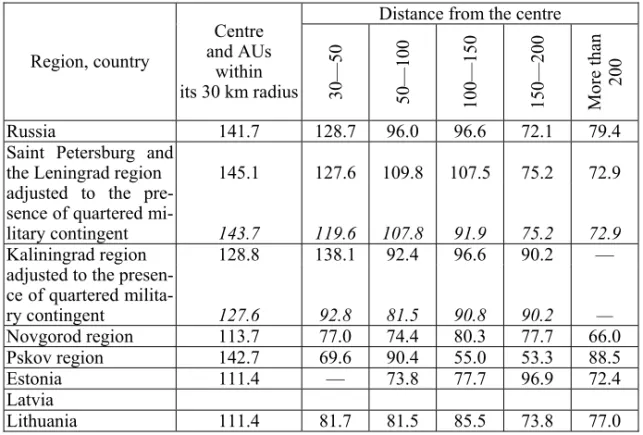
When estimating the distance from the centre in kilometres, rather than in terms of neighbourhood, the trends do not change (table 2).
Table 2
Population Size in the Lower-level AUs Vs. the Distance from Regional Centres in the 00s, % from the Beginning of the Period
Distance from the centre, km
Region, country
Centre and the AUs within
its 30 km radius
30
—5
0
5
0
—100
10
0—
1
50
15
0—
2
00
Mo
re
th
an 2
00
Russia, North-West,
average 103.9 99.6 94.8 94.5 87.0 88.6
Saint Petersburg and
the Leningrad region 104.8 105.8 104.0 98.8 90.5 90.4
Kaliningrad region 101.3 90.8 92.3 94.9 99.6 —
Novgorod region 98.1 88.3 86.5 86.3 88.4 85.2
Pskov region 99.0 83.9 82.1 78.8 78.4 87.9
Estonia 105.1 — 86.7 88.9 88.6 84.6
Latvia 91.8 94.6 85.1 83.2 83.7 80.4
Lithuania 97.8 87.1 83.7 86.0 82.0 85.2
Sources: Rosstat databases; Lietuvos Statistikos Departamentas; Latvijas
Stati-stika; Statistics Estonia.
Comments: data on Russia as of 2003—2010, Latvia 2000—2010, Lithuania
2001—2010, Estonia 2000—2011.
In the 00s, the most dramatic population decrease was observed on the remote periphery of the Pskov region, where the population of many AUs declined by more than 20%, and this was only due to local migration5. Rather, it is a result of a sustainable (decade-long) migration from the peri-phery to large cities, which has deformed the age structure of population. Now, even by the low standards of European Russia, these territories have the oldest population [8].
It is evident that Saint Petersburg, being one of the largest centres, has a powerful effect on the periphery even the periphery that is situated at a distance of more than 100 km from the city. A similar and sometimes even stronger effect is exerted on the periphery by Moscow, since the population stabilisation and increase observed in the Moscow region is explained by its “metropolitan” position. Of course, the Baltic capitals cannot be compared to Moscow and Saint Petersburg, whose power of attraction spreads far beyond adjacent regions.
Youth and Migration
A comparison of the age structure of population based on the results of censuses taken in the 2000s and 2010s shows that all Baltic countries were losing young population. The smallest loss of population aged 18—22 was observed in Estonia; by 2012, this cohort reduced by 6% in comparison to the number of children of the corresponding age reported by the 2000 census. In Latvia the loss was 11%, in Lithuania — 14.5%. As to the Russian regions under consideration, Pskov region lost 3% of young population in comparison to the number of children of the corresponding age reported by the 2002 census, and Novgorod region lost 10%. In Saint Petersburg and the Leningrad region the number of young people increased by 11.5%, in Kaliningrad region — by 20%.
Migration of Soviet youth from the rural areas of the non-chernozem regions triggered depopulation in certain districts as early as the 1980s [3], whereas, in large cities, it ensured a constant increase in population. In the beginning of this century, migration of young population was still driven by a centripetal momentum, and that affected the age structure of the population of both source and target territories.
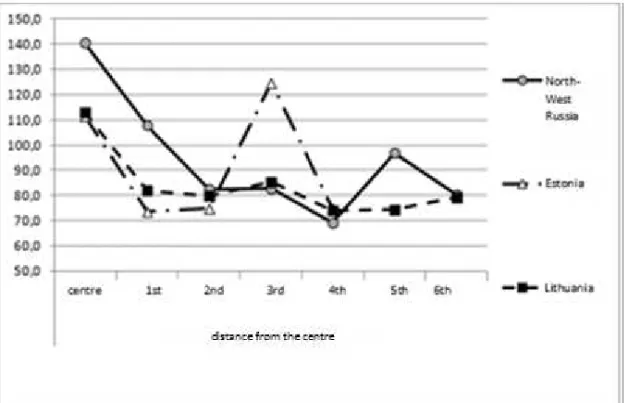
As figure 2 shows, in the 2000s, younger cohorts exhibited greater ac-tivity than the general population in terms of the centre-periphery processes (compare with fig. 1). It is explained almost exclusively by the geographical mobility, since the events of natural population changes have an insignificant effect on the population dynamics in this age group (mortality accounts for 0.5—1.5% of the cohort reduction, regardless of the country and sex).
5
Fig. 2. Number of People Aged 18—22 in 2010—2012 Vs. Number of Children of Corresponding Ages in 2000—2002; Territories Ranked
by the Distance from the Centre, %
Comment: the data on Latvia was not calculated due to the absence of
compa-rable information on the AUs of the analysed level.
Sources: Rosstat databases, Lietuvos Statistikos Departamentas, Latvijas
Stati-stika, Statistics Estonia.
As for Latvia, which is not represented in either figure 2 or table 3, we have only managed to calculate rates for six larger regions. According to the calculation, even Riga and the metropolitan areas do not show any increase in younger population (most probably, this dynamics is balanced out by emigration). The periphery lost 15—20% of younger population, the most significant losses were observed in Latgale. It suggests that the outflow from the Latvian periphery is comparable to that from Lithuanian periphery. Yet Riga, being the largest city in the Baltics, does not constitute a centre of attraction for younger people. Probably, Latvia is losing the most significant percentage of young people who move abroad to study or work.
Table 3
Population Aged 18—22 in 2010—2012 Vs. Number of Children of Corresponding Age in 2000—2002, by the Distance from the Centre (km), %
Distance from the centre
Region, country
Centre and AUs
within
its 30 km radius 30
—5
0
5
0
—100
10
0—
1
50
15
0—
2
00
Mo
re t
h
an
20
0
Russia 141.7 128.7 96.0 96.6 72.1 79.4
Saint Petersburg and
the Leningrad region 145.1 127.6 109.8 107.5 75.2 72.9 adjusted to the
pre-sence of quartered
mi-litary contingent 143.7 119.6 107.8 91.9 75.2 72.9
Kaliningrad region 128.8 138.1 92.4 96.6 90.2 — adjusted to the
presen-ce of quartered
milita-ry contingent 127.6 92.8 81.5 90.8 90.2 —
Novgorod region 113.7 77.0 74.4 80.3 77.7 66.0
Pskov region 142.7 69.6 90.4 55.0 53.3 88.5
Estonia 111.4 — 73.8 77.7 96.9 72.4
Latvia
Lithuania 111.4 81.7 81.5 85.5 73.8 77.0
Sources: Rosstat databases; Lietuvos Statistikos Departamentas; Latvijas
Sta-tistika; Statistics Estonia.
In Russia, an increase in younger population was observed over the inter-census period in almost third of AUs of the Leningrad region and almost half of the AUs of the Kaliningrad region, which affected the relatively insignificant losses on the periphery of these regions. Behind it is the regions’ attractiveness for migrants and a significant presence of the military contingent quartered there. The caveat is that within the 2010 national census, military conscripts were reported as residing at the home base, while in 2002 they were reported as residing at the place of conscription. In some cities and regions, it resulted in a distorted data about the number of young people [19], which can be discovered through analysing the male-female ratio in these age groups. In 2010, there were 103 men per 100 women aged 18—22. Of course, within a limited population group this ratio can differ but, obviously, not by much.
Similarly, the presence of military contingent distorts the data for Lenin-grad region, however, it affects a smaller amount of AUs and therefore, its effects are negligible. The other two Russian regions that we analysed, these distortions did not affect the overall numbers at all, but we should still point out a higher proportion of men than women reported in the city of Pskov and Pskov region.
Some AUs showed an influx of younger populations against the back-ground of general negative dynamics of younger contingents on the periphe-ry. For example, in Estonia the number of young people increased by 40% in Tartu and only by 16% in the capital city of Tallinn. It is a result of the pull effect of the popular University of Tartu. So Tartu, unlike other Esto-nian AUs and some larger and medium-sized towns of the Baltics6, did not experience a decrease in population in the inter-census period is explained by the influx of younger population. The Tartu situation is the major factor accounting for such a small decline of population on the periphery situated at a considerable distance from Tallinn (see fig. 1, table 2). In Lithuania, an inf-lux of younger population is only observed in Vilnius; even Kaunas is not attractive for this age group, although Kaunas’ losses are lower than those of surrounding territories.
In the Russian North-West, centres of attraction for younger population include Vyborg in Leningrad region (even after the adjustment to the military contingents) and Velikiye Luki in Pskov region — a city situated at a significant distance from Pskov, which was a reason behind its emergence as a centre of attraction for younger population from adjacent territories. In Russia, a second-tier centre of attraction can develop at a significant distance from regional capitals [12, p. 29]. Of course, there are zones of attraction in the vicinity of such powerful centre as Saint Petersburg. Their status, howe-ver, is only attributed to the proximity to the “Northern capital” rather than by the features of the cities themselves. Overall, in Russia, there are few cen-tres of attraction except regional capital and the resources of depopulated pe-riphery are only sufficient for regional centres.
Figure 3 shows the effect of migration on the age and sex structure of population. It shows age and sex pyramids for selected AUs of Russia and the Baltics that lose or attract younger population. For example, the Tartu County is a territory characterised by an influx of younger population, whe-reas the Plyussa district7 of Pskov region has been losing younger population for decades — over the last inter-census period, the its population decreased by 21% (50% as to the youth). Other peripheral districts of Pskov and Novgorod region were losing 30—40% of the youth, which inevitably re-sults in a decrease in the birth rate and, due to accelerated ageing of popula-tion, to an increase in the mortality rate, i.e. aggravates the demographic problems of territories.
6
According to Estonian statics, Tartu experienced a population outflow in 2005 and 2010, which included the young cohorts. It seems that censuses present more accu-rate data on student migration that the current statistical documentation. This prob-lem was described by K. Katus and L. Sakkeus for the period of the early 1990s [7]. 7
30 000 20 000 10 000 0 10 000 20 000 30 000 0–4 5–9 10–14 15–19 20–24 25–29 30–34 35–39 40–44 45–49 50–54 55–59 60–64 65–69 70–74 75–79 80–84 85+ ж м
600 400 200 0 200 400 600
0–4 5–9 10–14 15–19 20–24 25–29 30–34 35–39 40–44 45–49 50–54 55–59 60–64 65–69 70–74 75–79 80–84 85+ ж м
Kaliningrad, 2010 Plisse district of Pskov region, 2010
10 000 5 000 0 5 000 10 000
0–4 5–9 10–14 15–19 20–24 25–29 30–34 35–39 40–44 45–49 50–54 55–59 60–64 65–69 70–74 75–79 80–84 85+ ж м
15 000 10 000 5 000 0 5 000 10 000 15 000 0–4 5–9 10–14 15–19 20–24 25–29 30–34 35–39 40–44 45–49 50–54 55–59 60–64 65–69 70–74 75–79 80–84 85+ ж м
Tartu County, Estonia, 2012 Latgale, Latvia, 2011
Fig. 3. Age and Sex Structure of Population in Selected Russian, Estonian, and Latvian AUs, number of people
Sources: Rosstat databases; Lietuvos Statistikos Departamentas; Latvijas
Stati-stika; Statistics Estonia.
Conclusion
The analysis of population dynamics in the Russian North-West and the Baltics at NUTS-3 level shows a similarity in trends. This is manifested in the concentration of population in the regional/national centres, larger towns and their suburbs. In the 2010s, the national (regional) periphery was losing population at a rather high rate; only second-tier centres represented by a limited number of larger and medium-sized towns could retain population in these areas.
dec-reases at an accelerated rate. Moreover, social situation can deteriorate as a result of negative selection — the outflow of most socially active people. As the experience of Western countries shows, it can be remedied through coun-ter-migration of people of artistic occupations and retired representatives of the urban middle class to the periphery (see, for example, [28]). However, in the countries of the region under consideration such migration has not gained sufficient momentum yet.
The study was conducted in the framework of the Basic Research Pro-gramme of the National Research University Higher School of Economics in 2014.
References
1. Administrativno-territorial'noe delenie sojuznyh respublik SSSR na 1 janvarja
1987 goda [Administrative-territorial division of the Soviet republics on January 1,
1987], 1987, Moscow.
2. Gritsay, O., Ioffe, G., Treyvish, A. 1991, Centr i periferija v regional'nom
ra-zvitii [Center and periphery in regional development], Мoscow.
3. Zayonchkovskaya, J.A. 1991, Demograficheskaja situacija i rasselenie [De-mographic situation and the resettlement]. Moscow, 133 p.
4. Zayonchkovskaya, J.A. Veldanova, I. Yu. 1982, Migracija sel'skogo nase-lenija SSSR v goroda [Migration of the rural population of the USSR in the city]. In:
Rasselenie naselenija i razmeshhenie proizvodstva [Resettlement of the population
and the location of production], Moscow, p. 108—129.
5. Karachurina, L.B., Mkrtchyan, N.V. 2013, Izmenenie chislennosti naselenija administrativnyh rajonov i gorodov Rossii (1989—2010 gg.): centro-periferijnye vzaimodejstvija [Changes in the population of administrative districts and cities of Russia (1989—2010): Center-periphery interaction], Voprosy geografii [Questions of geography], T. 135 (Geography of Population and Social Geography), p. 82—107.
6. Karachurina, L.B., Mkrtchyan, N.V. 2012, Migracionnaja podvizhnost' mo-lodezhi i sdvigi v vozrastnoj strukture naselenija gorodov i rajonov Rossii (1989— 2002) [Migration mobility of young people and changes in the age structure of the population of cities and regions of Russia (1989—2002)]. In: Polyan, P.M., Trey-vish, A.I. (comp.), 2012, Geograficheskoe polozhenie i territorial'nye struktury:
pa-mjati I.M. Maergojza [Geographical location and territorial structures: memory
I.M. Maergoiz], Moscow, p. 688—707.
7. Catus, K., Sakkeus, L. 1999, Urbanizacija, migracija i regional'noe razvitie naselenija Jestonii [Urbanization, migration and regional development of the Es-tonian population]. In: Zayonchkovskaya, J.A. (ed.), Zayonchkovskaya, J.A. 1999,
Migracija i urbanizacija v 90 gody [Migration and urbanization in the 90s],
Mos-cow, p. 159—183.
8. Kashnitsky, I. 2014, Chto v vozraste tebe moem? At the age of my writing?],
Demoscope Weekly, no. 581—582, available at: http://demoscope.ru/weekly/2014/
0581/demoscope581.pdf (accessed: 17.01.2014).
10. Leyzerovich, E.E. 2008, Hod koncentracii naselenija v central'nyh chastjah subektov RF posle 1990 goda [Behavior of the concentration of the population in the central parts of the subjects of the Russian Federation since 1990]. In: Artobolevsky, S.S., Sintserov, L.M. (eds.), 2008, Transformacija rossijskogo prostranstva:
soci-al'no-jekonomicheskie i prirodno-resursnye faktory (polimasshtabnyj analiz)
[Trans-formation of the Russian space: socio-economic and natural resource factors (full analysis)], collection of reports XXV session MARS, Moscow, p. 173—181.
11. Lexin, V.N. 2009, Goroda vlasti: administrativnye centry Rossii [City government: administrative centers of Russia], Mir Rossii [World of Russia], no. 1, p. 3—33.
12. Mkrtchyan, N.V. 2013, Migracija molodezhi v regional'nye centry Rossii v konce XX—XXI vekov [Migration of young people in regional centers in Russia at the end of XX-XXI centuries], Izvestija Rossijskoj Akademii nauk, Seria
Geogra-ficheskaja [Bulletin of the Russian Academy of Sciences, Ser. Geography], no. 6,
p. 17—30.
13. Rakhmanova, G. 1992, Vozrastnye profili netto-migracii v nekotoryh res-publikah byvshego SSSR (1979—1989 gg.) [The age profiles of net migration in so-me republics of the forso-mer Soviet Union (1979—1989)], Byvshij SSSR: vnutrennjaja
migracija i jemigracija. Programma po issledovaniju migracii [Former Soviet
Union: internal migration and emigration. Program for Migration Research], no. 1 Moscow, p. 217—246.
14. Makhrova, A.G. 2013, Transformacija rasselenija v Moskovskom regione v postsovetskij period [Transformation of settlement in the Moscow region in the post-Soviet period], Voprosy geografii [Questions of geography], T. 135 (Geogra-phy of Population and Social Geogra(Geogra-phy), Moscow, p. 245—269.
15. , A.G. (ex. Ed.), 2013, Naselenie Rossii 2010—2011 [The po-pulation of Russia 2010—2011], 18th—19th annual demographic report, Moscow.
16. Nefedova, T.G. 2011, Rossijskie dachi kak social'nyj fenomen [Russian da-cha as a social phenomenon], SPERO.Social'naja politika: jekspertiza,
rekomen-dacii, obzory [SPERO. Social policy: expertise, recommendations, reviews], no. 15,
p. 161—172.
17. Nefedova, T.G., Treyvish, A.I. 1998, «Sil'nye» i «slabye» goroda Rossii ["Strong" and "weak" places in Russia], In: Lipets, Yu.G. (ed.), 1998, Poljusa i
cen-try rosta v regional'nom razvitii [Poles and growth centers in regional development],
Moscow, p. 135—143.
18. Perevedentsev, V.I. 1990, Molodezh' i social'no-demograficheskie problemy SSSR [Young people and social and demographic problems of the USSR], Moscow.
19. Pyankova, A. 2013, Dannye perepisej na municipal'nom urovne: ograniche-nija i problemy analiza na primere Moskovskoj oblasti [Census data at the municipal level: limitations and problems of the analysis as an example of the Moscow Re-gion], Demoscope Weekly, no. 575—576, available at: http://demoscope.ru/weekly/ 2013/0575/analit03.php (accessed: 201.10.2013).
20. Berry, B.J.L. (ed.), 1976, Urbanization and Counterarbanization, Beverly Hills.
21. Friedmann, J. 1972, A general theory of polarized development. In Growth
centers in regional economic development, N. Y.
22. Geyer, H. S., Kontuly, T. 1993, A Theoretical Foundation for the Concept of Differential Urbanization, International Regional Science Review, Vol. 15, no. 2, p. 157—177.
23. Gibbs, J. 1963, The evolution of population concentration, Economic
24. Hall, P., Hay, D. 1980, Growth Centres in the European Urban System, L. 25. Krisjane, Z., Berzins, M. 2012, Post-socialist Urban Trends: New Patterns and Motivations for Migration in the Suburban Areas of Riga, Latvia Urban Studies, Vol. 49, no. 2, p. 289—306.
26. Plane, D.A., Henrie, C.J., Perry, M.J. 2005, Migration up and down the urban hierarchy and across the life course, Proceedings Of The National Academy
Of Sciences, Vol. 102, no. 43, p. 15313—15318.
27. Raagmaa,G. 2003, Centre-Periphery model explaining the regional
deve-lopment of the informational and transitional society, 43rd Congress of the European
regional science association (ERSA) Jyvaskyla, Finland, August 27—30, 2003, available at: https://www.jyu.fi/ersa2003/cdrom/papers/503.pdf (accessed: 11.12.2013).
28. Bijker, R.A., Haartsen, T. 2012, More than Counter-urbanisation: Migration to Popular and Less-popular Rural Areas in the Netherlands, Рopulation, Space and
Place, no. 18, p. 643—657.
29. Richardson, H.W. 1973, Regional growth theory, N.Y.
30. Todd, D. 1974, An appraisal of the development pole concept in regional analysis, Environment and Planning, p. 291—306, №A6.
About the authors
Dr Nikita Mkrtchyan, Leading Research Fellow, Institute of
Demo-graphy, Higher School of Economics National Research University, Russia. E-mail:Mkrtchan2002@rambler.ru
Dr Liliya Karachurnia, Associate Professor, Deputy Head of the
Depart-ment of Demography, Higher School of Economics National Research Uni-versity, Russia.