www.atmos-meas-tech.net/9/4471/2016/ doi:10.5194/amt-9-4471-2016
© Author(s) 2016. CC Attribution 3.0 License.
Intercomparison of stratospheric nitrogen dioxide columns retrieved
from ground-based DOAS and FTIR and satellite DOAS
instruments over the subtropical Izana station
Cristina Robles-Gonzalez1,a, Mónica Navarro-Comas1, Olga Puentedura1, Matthias Schneider3, Frank Hase3, Omaira Garcia2, Thomas Blumenstock3, and Manuel Gil-Ojeda1
1Atmospheric Research and Instrumentation Branch. National Institute for Aerospace Technology (INTA),
Ctra. Ajalvir s/n, Torrejón de Ardoz, 28850 Madrid, Spain
2Izaña Atmospheric Research Center (IARC), Meteorological State Agency (AEMET), Tenerife, Spain 3Institute of Meteorology and Climate Research – Atmospheric Trace Gases and Remote Sensing,
Karlsruhe Institute of Technology, Karlsruhe, Germany
acurrently at: Meteorological State Agency (AEMET), Madrid, Spain
Correspondence to:Cristina Robles-Gonzalez ([email protected])
Received: 7 February 2016 – Published in Atmos. Meas. Tech. Discuss.: 21 March 2016 Revised: 18 July 2016 – Accepted: 8 August 2016 – Published: 9 September 2016
Abstract. A 13-year analysis (2000–2012) of the NO2
vertical column densities derived from ground-based (GB) instruments and satellites has been carried out over the Izaña NDACC (Network for the Detection of the Atmo-spheric Composition Change) subtropical site. Ground-based DOAS (differential optical absorption spectroscopy) and FTIR (Fourier transform infrared spectroscopy) instruments are intercompared to test mutual consistency and then used for validation of stratospheric NO2from OMI (Ozone
Mon-itoring Instrument) and SCIAMACHY (SCanning Imaging Absorption spectroMeter for Atmospheric CHartographY). The intercomparison has been carried out taking into ac-count the various differences existing in instruments, namely temporal coincidence, collocation, sensitivity, field of view, etc. The paper highlights the importance of considering an “effective solar zenith angle” instead of the actual one when comparing direct-sun instruments with zenith sky ones for a proper photochemical correction. Results show that NO2 vertical column densities mean relative difference
be-tween FTIR and DOAS instruments is 2.8±10.7 % for a.m. data. Both instruments properly reproduce the NO2
sea-sonal and the interannual variation. Mean relative differ-ence of the stratospheric NO2derived from OMI and DOAS
is −0.2±8.7 % and from OMI and FTIR is −1.6±6.7 %. SCIAMACHY mean relative difference is of 3.7±11.7 and
−5.7±11.0 % for DOAS and FTIR, respectively. Note that the days used for the intercomparison are not the same for all the pairs of instruments since it depends on the availability of data. The discrepancies are found to be seasonally depen-dent with largest differences in winter and excellent agree-ment in the spring months (AMJ). A preliminary analysis of NO2trends has been carried out with the available data
se-ries. Results show increases in stratospheric NO2columns in
all instruments but larger values in those that are GB than that expected by nitrous oxide oxidation. The possible reasons for the discrepancy between instruments and the positive trends are discussed in the text.
1 Introduction
Nitrogen dioxide (NO2)is both a natural and anthropogenic
constituent of the terrestrial atmosphere. In the stratosphere it plays an important role in the equilibrium of ozone through autocatalytic cycles (Crutzen, 1970) and by deactivating other ozone-depleting substances into their reservoir forms. In remote unpolluted regions, the most important contribu-tion to the NO2 vertical column densities (VCDs) comes
(GB) differential photometry and spectroscopy (Brewer et al., 1973; Kerr and McElroy, 1976; Noxon, 1975). The mea-surements by differential optical absorption spectrometry (DOAS) at zenith, or DOAS technique (Platt and Stutz, 2008) have since been used in remote locations for NO2
long-term monitoring. Using the infrared spectral domain, Fourier transform infrared spectroscopy (FTIR) instrumentation was deployed in order to analyse atmospheric trace gases (Hen-drick et al., 2012). A few decades ago, both instrumental techniques were joined together in the NDACC (Network for the Detection of Atmospheric Composition Change) (http: //www.ndsc.ncep.noaa.gov), a network developed to provide accurate and standardized long-term measurements of atmo-spheric trace gases.
The recent needs of having reliable data in near-real time to feed the forecasting models such as MACC-II (http: //www.gmes-atmosphere.eu/about/project/) makes the com-parison of observations performed by using different tech-niques and the validation of satellite data using GB obser-vations a valuable tool to assure the quality of both GB and satellite data and thus improve the model performance.
However, the intercomparison of remote-sensing instru-ments collected by independent instrumentation is not straightforward. A deep knowledge of the representative-ness of the scanned air masses provided by each instrumen-tal technique is required. Over the last years, a number of studies have focused on the comparison of satellite NO2
ob-servations with GB instruments (FTIR and DOAS) in or-der to identify and quantify potential discrepancies. Gil et al. (2008) published a climatology of the stratospheric NO2
over the NDACC subtropical station Izaña and a prelim-inary comparison with SCIAMACHY satellite instrument, finding good agreement between them (1.1 % differences). Dirksen et al. (2011) compared more than 5 years (Oc-tober 2004 to May 2010) of OMI (Ozone Monitoring In-strument) stratospheric NO2 from the OMI standard
prod-ucts (SP) and from the DOMINO algorithm with NDACC remote stations GB measurements, finding a mean differ-ence of 13 %. Lambert et al. (2011) reported an agree-ment between GOME-2 and NDACC/UV–vis network over the Northern Hemisphere within 8–20 %, depending on the season and latitude. Adams et al. (2012) presented an in-tercomparison of GB and satellite NO2 columns at a
Po-lar Canadian station (PEARL). The satellite data they used were OSIRIS, ACE-FTS v2.2 and ACE-FTS v3.0, which agreed with GB measurements within 20 %. However, very few publications include FTIR data in their comparisons. Wetzel et al. (2007) presented the validation of MIPAS-ENVISAT NO2data. They showed that the mean deviation
between the FTIR measurements and MIPAS from July 2002 until March 2004 remains within 10 % in Kiruna (68◦N) and over Harestua (60◦N) a mean negative bias of 15 % have been presented for MIPAS UV–vis daytime compar-isons. Hendrick et al. (2012) compared stratospheric NO2
datasets from the DOAS-based instrument SAOZ and
FTIR-based instrument Bruker with satellite DOAS instruments, namely GOME, SCIAMACHY and GOME-2, at northern midlatitudes over Jungfraujoch from 1990 to 2009. They observed FTIR minus GB DOAS mean relative differences of about−7.8±8.2 % and satellite minus GB DOAS mean relative differences of 0.9±8.8 % for GOME, 1.9±11.5 % for SCIAMACHY and 2.3±11.6 % for GOME-2. Recently, Belmonte Rivas et al. (2014) revised the stratospheric NO2
data retrieved from satellite instruments. They found discrep-ancies in stratospheric NO2 obtained on nadir mode when
compared with the “limb” ones. Globally, SCIAMACHY was underestimated by 0.5×10¹⁵molec cm−2whereas OMI data were found to be 0.6×10¹⁵molec cm−2too large. They also found a temperature dependence affecting the retrieval via the air mass factor (AMF). Therefore, in order to be able to explain such differences, Marchenko et al. (2015) and van Geffen et al. (2015) carried out a thorough revision of the al-gorithms used to retrieve NO2from OMI data. These studies
proposed improved descriptions of the wavelength calibra-tion and reference spectra in the DOAS spectral fitting. Tem-perature variability in the subtropical stratosphere is small as compared to higher latitudes. The amplitude of the seasonal wave in the mid-stratosphere is 4 K peak to peak (Gil et al., 2008), thus minimizing the temperature-dependence impact on the satellite retrieval.
The goal of this paper is to extend the previous GB to satel-lite intercomparisons to lower latitudes, including DOAS and FTIR GB techniques. Thirteen years of data, 2000 to 2012, from the Izaña NDACC subtropical station have been used for this purpose. Once the agreement of GB instruments is proven, their measurements are used for the validation of OMI and SCIAMACHY satellite observations. In this work a new correction method with a high impact on photochemical active species is also introduced and applied to minimize the effect of the different scanned air mass when different kind of observations are used.
The use of two GB independent measurements techniques is also helpful for long-term studies since confidence is gained when searching trends, which are usually small com-pared with the seasonal cycle. Additionally, extra informa-tion can be obtained on the heights where trends are observed if the vertical sensitivity of the instruments is not identical, as is the case with DOAS and FTIR. Previous studies on NO2
trends are not conclusive.
Gruzdev and Elokhov (2009) found a hemispherical de-pendence on the sign of the stratospheric NO2trend. A
posi-tive trend was found over the middle latitudes of the Southern Hemisphere, in good agreement with expectations, whereas the trend over the Northern Hemisphere was negative, in dis-agreement with the increase of emissions of nitrous oxide (N2O), which is a precursor of NO2. Hendrick et al. (2012)
display a positive trend whereas trends are negative in the southern latitudes. The picture is consistent with MIPAS trends analysis for O3(i.e. Eckert et al., 2014). At present,
this subject is under debate.
The work is organized as follows: Sects. 2 and 3 present the DOAS and FTIR techniques, respectively, their advan-tages and limitations as well as the basics of the algorithms used to extract NO2column abundances. Section 4 gives a
brief review of the satellite instruments SCIAMACHY and OMI and the algorithms whose results have been used along this work. In Sect. 5 the main characteristics of the Izaña Ob-servatory are highlighted. The procedure for the intercom-parison is explained in Sect. 6 and the results and discussion can be found in Sect. 7.
2 DOAS: technique and instrument
As previously mentioned, the DOAS technique (Platt and Stutz, 2008) has been extensively used in last decades to measure stratospheric NO2 since the pioneering works of
Noxon (1975) and Syed and Harrison (1981). The technique is based on the analysis of the absorption of sky radiation by the gas under consideration, providing that the magnitude of the absorption structure varies with the wavelength. For species of interest with the load of mass located in the strato-sphere, the spectrum of the sky is taken during the twilight to enhance the effect of the stratospheric absorption and mini-mize the tropospheric contribution. The analysis is based on a linear fit of the log ratio of the sky background intensity spectrum with respect to a reference (non-absorbing) spec-trum. In practice a spectrum obtained with the same ground instrument at high sun is used as a reference spectrum. Then the NO2content in this spectrum is estimated by a
Langley-plot method (Platt and Stutz, 2008).
INTA (National Institute for Aerospace Technology, http:// www.inta.es/atmosfera/33/menu.aspx) started measurements of NO2 at the Izaña Atmospheric Observatory (IZO),
man-aged by the Meteorological State Agency (Agencia Estatal de Meteorologia, AEMET, Spain, http://izana.aemet.es/), in 1993 and in the framework of NDACC in 1998. Since then, two DOAS instruments have been covering the period of measurements at Izaña Observatory. During the period 1998 to 2010, the RASAS spectrometer was in operation. The in-strument is based on an EGG&1453A 1024 photodiode ar-ray detector controlled by an EGG 1461 on a Jarrel-Ash Monospec 18 spectrograph. Scattered light at zenith was col-lected by a baffled cylinder through a quartz fibre bundle. A diffraction grating of 600 grooves mm−1provided a spectral range of 340–600 nm for NO2and O3observations with an
average full width at half maximum (FWHM) resolution of 1.3 nm. The spectrograph and detector were housed in a ther-mostatized hermetic container, keeping the spectrograph at a constant temperature maintaining the alignment of the spec-tra with time.
A 3-year overlapping period was used to ensure the series continuity. However, no corrections to the data were needed since the agreement between instruments was excellent (see Gil et al., 2008). A more detailed description of the instru-ment can be found in Gil et al. (2008).
Data from RASAS instrument from day number 186/2006 through day number 129/2010 are corrected from a continu-ous degradation of the PDA detector, which resulted in an ap-parent decrease of 4.3 % per year. Correction was performed thanks to the alternative measurements of the scanning spec-trometer (first instrument in the field), in operation since the beginning of the measurements, and the overlapping with RASAS-II, in operation since day 15/2010.
Since 2010 the instrument was replaced by a MAX-DOAS (Multi Axis Differential Optical Absorption Spec-troscopy) capability spectrometer (RASAS-II). The spectral range is 415–530 nm, thus covering the largest NO2spectral
bands. It is based on a Shamrok SR-163i spectrograph and a 1024×255 pixel DU420A-BU Andor Idus CCD camera. A detailed description of RASAS II instrument can be found in Puentedura et al. (2012) and Gomez et al. (2014).
The analysis of the spectra was performed using software developed at INTA based on the standard DOAS technique. A detailed explanation of the analysis routine can be found in Gil et al. (2008). DOAS settings for NO2column retrieval
follow NDACC UV/Vis Working Group recommendations (Hendrick et al., 2012; Van Roozendael et al., 2012). A set of six reference spectra has been included: O3, NO2, H2O and
O4. The Raman scattering cross section was generated by
the Win-DOAS package (Fayt and Van Roozendael, 2001) from the Raman theory. Finally, the inverse of the reference spectrum was included as a pseudo cross section to account for stray light inside the spectrograph and detector resid-ual dark current. The AMF used for the conversion of NO2
slant columns to vertical columns is the NDACC NO2
stan-dard AMF available on the NDACC UV–vis web page (http: //ndacc-uvvis-wg.aeronomie.be/) and based on the Lambert et al. (1999) climatology of NO2 profiles. This
climatol-ogy consists of a Fourier harmonic decomposition of UARS HALOE v19 and SPOT-4 POAM-III v2 NO2 profile data
records (Van Roozendael and Hendrick, 2012). Further de-tails are shown in Table 1.
3 FTIR: technique and instrument
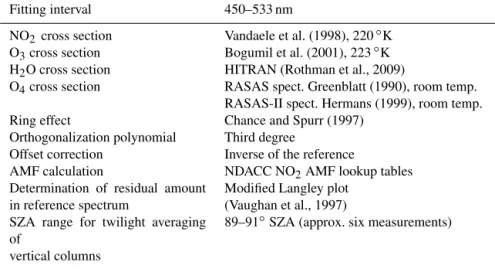
Table 1.DOAS spectrometers settings.
Fitting interval 450–533 nm
NO2cross section Vandaele et al. (1998), 220◦K
O3cross section Bogumil et al. (2001), 223◦K
H2O cross section HITRAN (Rothman et al., 2009)
O4cross section RASAS spect. Greenblatt (1990), room temp.
RASAS-II spect. Hermans (1999), room temp.
Ring effect Chance and Spurr (1997)
Orthogonalization polynomial Third degree
Offset correction Inverse of the reference
AMF calculation NDACC NO2AMF lookup tables
Determination of residual amount in reference spectrum
Modified Langley plot (Vaughan et al., 1997) SZA range for twilight averaging
of
vertical columns
89–91◦SZA (approx. six measurements)
transmission spectra are recorded in the spectral range of 2.4 to 13.5 µm using InSb and MCT detectors. In order to im-prove the signal-to-noise ratio, the NDACC optical filter set is used. The instrumental line shape (ILS) is monitored on a regular basis using cell measurements and LINEFIT software (Hase et al., 1999). Spectra are analysed using PROFFIT re-trieval code (Hase et al., 2004). PROFFIT includes a forward calculation model and an inversion tool to retrieve profiles and column amounts of trace gases from atmospheric spec-tra. The NDACC harmonized retrieval scheme is applied. As spectroscopic data the HITRAN 2008 line parameters (Roth-man et al., 2009) are used. Daily NCEP data are used for pressure and temperature. Profiles and column amounts of trace gases like H2O, HDO, CH4, N2O, CFC-11, CFC-12,
O3, HNO3, ClONO2, HCl, HF, NO and NO2 can be
de-rived from the infrared spectra. For NO2a spectral
microwin-dow, providing weak NO2 lines superimposed to a strong
broadband methane absorption, of around 2914.5 cm−1is fit-ted. The NO2total column retrieved using this algorithm is
mainly sensitive to the stratospheric abundance.
4 Satellite instrumentation 4.1 SCIAMACHY
SCIAMACHY was a satellite imaging spectrometer on board ENVISAT platform in operation from March 2002 to April 2012. It measured backscattered, transmitted or re-flected radiation from the Earth surface and atmosphere with a moderately high resolution (0.2 to 1.5 nm) in the wave-length range of 240 and 1700 nm for global remote sensing of trace gases, aerosols and clouds. It measured in nadir, limb and occultation modes (Bovensmann et al., 1999; Burrows and Chance, 1991) with a swath of 960 km across track with a resolution of 30×60 km2in the nadir mode. Detailed in-formation about operation characteristics of SCIAMACHY
can be found at http://www.sciamachy.org/. The stratospheric NO2is retrieved by using the DOAS technique in the spectral
region of 425–450 nm. The data used in this paper have been generated by the Institute of Environmental Physics (IUP) of the University of Bremen algorithm v2.0 (http://www.iup. uni-bremen.de/doas/scia_no2_data_acve.htm) (Sussman et al., 2005) based on the work of Richter and Burrows (2002), for GOME NO2. SCIAMACHY stratospheric NO2 values
within 200 km around the station are included in the dataset. NO2 cross sections used in the analysis are those by
Van-daele et al. (1998), which are also used for DOAS retrieval. SCIAMACHY data have not been corrected for cross-section temperature dependence. Assuming a dependence of 0.3 to 0.5 % K−1 (Bucsela et al., 2013; Boersma et al., 2004) for the Izaña latitude, the maximum error due to this effect is 1.2 to 2 %.
4.2 OMI
OMI is a hyperspectral imaging instrument (Levelt et al., 2006) on board AURA that measures the backscattered Earth radiation in the UV–vis spectral range (from 264 to 504 nm) with a spectral resolution between 0.42 and 0.63 nm. It has a spatial resolution of 13 km along track by 24 km cross track for the nadir pixels. The swath width is about 2600 km, pro-viding daily global coverage.
The OMI stratospheric NO2 data have been computed
with the NASA Standard Product OMNO2 algorithm (ver-sion 2) (Bucsela et al., 2013), applying the DOAS tech-nique in the spectral range of 405 to 465 nm (Boersma et al., 2002; Bucsela et al., 2006). As in the case of SCIAMACHY, OMI stratospheric NO2 values within 200 km around the
station are included in the dataset. The cross sections used in the analysis are NO2 from Vandaele et al. (1998), O3
are from Burrows et al. (1999) and H2O from Harder and
applied to the NO2absorption cross sections similarly to the
factors used by Boersma et al. (2002, 2004). For more in-formation about the stratospheric NO2 scientific algorithm
see Bucsela et al. (2013). Recently, thorough revisions of the spectral fitting algorithms were presented in Marchenko et al. (2015) and van Geffen et al. (2015). Here we use datasets available to us in the beginning of 2013, so without the up-dates presented in those papers. The studies from Marchenko and van Geffen suggest that the improved NO2slant column
densities and, consequently, the stratospheric NO2columns
are reduced by 10–35 % relative to data used in our study.
5 Izaña Atmospheric Observatory
The IZO is a high mountain NDACC station located on Tenerife island in the subtropical North Atlantic Ocean (28.3◦N, 16.5◦W; 2370 m a.s.l.), where DOAS and FTIR instruments are in operation since 1993 and 1999, respec-tively. IZO is run by the Izaña Atmospheric Research Cen-tre (IARC, www.izana.aemet.es), belonging to State Agency of Meteorology of Spain (Agencia Estatal de Meteorología, AEMET).
IZO is located above a quasi-permanent temperature in-version layer established between 800 and 1500 m a.s.l. as-sociated to the trade-winds regime. The inversion layer sep-arates the moist marine boundary layer from the dry free troposphere and works as a natural barrier for local and re-gional pollution (Cuevas et al., 2015, and references therein). Thereby, the NO2VCD can be considered as dominated by
stratospheric NO2 with relatively minor contribution from
the troposphere.
6 Comparison methodology
The signal of remote-sensing instruments using direct or dif-fuse solar radiation as a source is a weighted average of rays crossing the entire atmosphere through different paths. The averaging kernel (AVK) matrix defines the relation between the retrieved quantities and the true atmospheric state (Eskes and Boersma, 2003; Rodgers, 2004) and it can be viewed as the sensitivity of the instrument to the trace gas in the differ-ent layers.
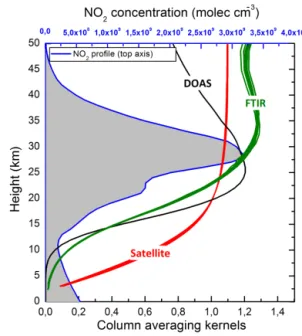
Large differences in AVK profiles between DOAS, FTIR and satellite techniques would lead to uncertainties difficult to quantify and could result in a more complicated intercom-parison (Adams et al., 2012; Dirksen et al., 2011; Hendrick et al., 2012; Peters et al., 2012; Sussmann et al., 2005, among others). This, however, is not the case. Figure 1 shows how all considered instruments have their maximum sensitivity in the stratosphere and how the tropospheric effect is minimum. AVKs are plotted for the diurnal period of measurements of each instrument, DOAS at solar zenith angle (SZA) of 89– 91◦, FTIR for SZA 50◦a.m. to 50◦p.m. and satellites around noon. The DOAS tropospheric response is almost zero since
-Figure 1.Typical averaging kernels of DOAS (black line), FTIR (green line) and satellite (red line) instruments for the diurnal period of measurements. The shaded area represents a NO2vertical profile (top axis) over Izaña obtained from the American Standard Atmo-sphere (US Standard AtmoAtmo-sphere, 1976, US Government Printing Office, Washington, DC, 1976) for the tropics.
at twilight the effective scattering height, which is the height where the rays are scattered downward to the instrument, is located in the lower stratosphere. The contribution of the lower layers of the troposphere to the nadir satellites signal is also small since scattering is still large at 440 nm. In any case, satellite algorithms take into account the effect of the tropo-sphere to eliminate it from the stratospheric NO2results to
avoid potential pollution episodes. The NO2signatures used
by the FTIR retrieval are rather weak. Therefore, the retrieval approach of a scaling a priori profile is used. Due to the fact that the absorption contribution of stratospheric NO2is less
pressure-broadened, it has per molecule a larger impact on the least-squares fit than a tropospheric contribution. In addi-tion, the NO2signatures are surrounded by strong CH4lines,
and the imperfect spectroscopic description of the wings gen-erated by these lines requires the fit of additional empirical background parameters, which results in a further decrease of the retrieval sensitivity with respect to tropospheric NO2.
Therefore all intercompared instruments are highly sensitive at the altitude range where the NO2bulk is located and
mini-mize the potential differences near the surface that may occur due to pollution events. The AVK assessment suggests that NO2columns measured by nadir satellites, DOAS and FTIR
can be directly compared. Being the station in a remote lo-cation in the free troposphere at 2370 m a.s.l., well above the major source of pollution, the column data are representative of the stratospheric NO2. For that reason, the satellite product
The algorithms to generate atmospheric products from DOAS and FTIR instruments require an “a priori” NO2
pro-file. DOAS employs the NO2 climatology obtained from a
Fourier harmonic decomposition of UARS HALOEv19 and SPOT-4 POAM-IIIv2 profiles data (Lambert et al., 1999), whereas FTIR utilizes the output of the WACCM climatic model. To test the influence of the profile used on the final products, DOAS AMFs have been obtained by means of the WACCM profile for a case study. Results of the comparison show that the selection of the profiles has a maximum impact of 6 % on the retrieved columns.
The importance of a proper collocation when intercompar-ing instruments from different platforms and techniques has recently been recognized. The spatial coincidence, the field of view, the data vertical and horizontal smoothing as well as the location of the effective air mass have to be taken into ac-count. The instruments should observe the same air mass in the atmosphere (spatial coincidence). This requirement is not always easy to fulfil when comparing instruments based on different techniques. In cases where the spatial coincidence is not possible, the comparison of the instruments can be per-formed, taking into account the impact of such differences on the data. The “effective location” is the surface projection of the studied air parcel. For instance, DOAS instruments mea-sure scattered light at zenith during twilight. As the strato-spheric NO2layer is centred at about 25–30 km height
(or-ange layer in Fig. 2a), the effective stratospheric NO2mass
measured by the instrument is about 300 km toward the sun direction. Two effects are observed from this figure: the first one is that when satellite nadir data are to be compared with DOAS, the selection of the ground pixel for collocation must be done by taking into account the location of the DOAS ef-fective air mass. Figure 2b shows the surface projection of the central point of the effective air masses for DOAS and FTIR. DOAS zenith sky scans 300 km towards the east and west in morning and dusk, respectively, whereas FTIR direct-sun measurements are representative of the stratosphere in the surroundings of the station. There is also dependence on the season: about 300 km in latitude change from summer to winter solstices. The size of the air masses scanned by each instrument is also a factor affecting the degree of agreement. While FTIR scans a narrow field of view, satellite footprints cover an area of few decades to hundreds of squared kilo-metres and for comparison all measurements falling within a given area are considered. In our study a circle of about 300 km around IZO has been considered.
At the tropical–subtropical latitudes the NO2spatial
vari-ability in the stratosphere is low and the impact of these effects on the intercomparisons is small. From tests car-ried out over the area with SCIAMACHY data it has been found almost no zonal gradients and meridional gradients of 2.0×10¹³molec cm−2per degree, in subtropical unpolluted areas, representing 0.84 % per latitude degree of the column. Therefore the impact of the changing scanned volume with season might have a maximum effect of 3 % of the column.
Around the Canary Archipelago there are small longitudinal differences associated to coastal pollution that will be dis-cussed in Sect. 7.
The second effect is that the effective solar zenith angle at the effective air mass area is about 3◦lower than the actual SZA at the station (local SZA). Figure 2c shows the local and the effective SZA (ESZA) of the observed stratospheric NO2
layer (in grey colour). In photochemically active species such as NO2a SZA-dependent correction has to be applied to
cor-rect for the diurnal variation in the column and refer the mea-surements to a common time. This effect was already men-tioned by Gil et al. (2008). In addition, Adams et al. (2012) observed that over polar areas the SZA-dependent correction is particularly significant in spring and fall. As previously mentioned, the effective DOAS NO2 air mass is located in
sun direction and the ESZA at the working latitude is 86.8◦ for a.m. and p.m. measurements. The ESZA has been ob-tained as the SZA corresponding to the intersection point of the effective ray at 90◦ with the height of the maximum NO2concentration in the annual mean profile. The effective
ray, defined as the single ray equivalent to the integration of all rays arriving at the instrument, was computed by the INTA ray-tracing radiative transfer model in single scattering and spherical mode with no refraction included (Sarkissian et al., 1995). The mean vertical distribution above 17 km was obtained by annual averaging of mean morning profiles from the HALOE and POAM-II data (Lambert et al., 1999) whereas for lower altitudes the output of the SLIMCAT box model was used (Denis et al., 2005). No tropospheric NO2
has been considered. In the northern subtropical region the “effective height” does not vary much and neither does the “effective SZA”. In Fig. 2c the effect of the height assump-tion on the effective SZA is shown. A change of 5 km in height of the bulk of the layer (25 to 30 km) at SZA 90◦over the station makes the “effective SZA” to change from 86.4 to 87.2◦. The error due to such a change would be±0.4◦, which means 1.4–1.5 % in the column, depending on the season. We estimate this error as the upper limit. In Fig. 3 the theoretical NO2photochemical behaviour over Izaña is shown together
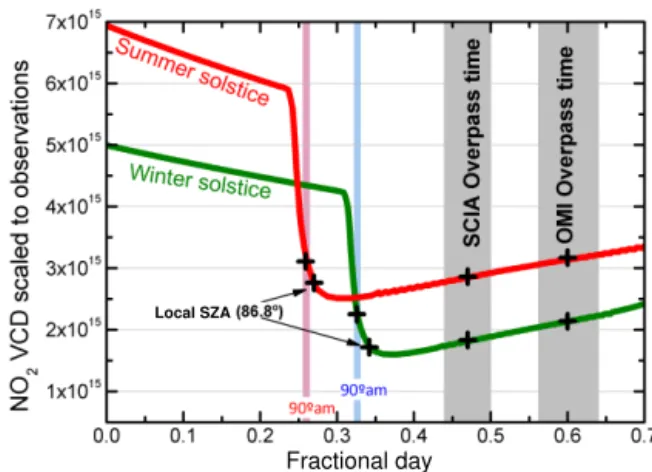
with the time overpasses of the OMI and SCIAMACHY in-struments. As the NO2VCD varies along the day, densities
measured at different times must be corrected to be referred to a common time. In the early morning NO2is strongly
re-duced until it reaches a new daytime NO–NO2equilibrium.
Then, it increases during the daytime in a nearly linear way mainly due to N2O5photodissociation. At Tenerife, the NO2
VCD at 86.8◦a.m. is 19 % lower than at 90◦a.m. The day-time increase is of about 1×10¹⁴molec cm−2h−1. For that
reason the NO2VCD at mean OMI overpass time is 9.8 and
6.5 % larger than SCIAMACHY overpass time for winter and summer, respectively. In our work the stratospheric NO2
from FTIR a.m. data (up to 12:00 UTZ), SCIAMACHY and OMI instruments has been photochemically corrected to the DOAS a.m. measurement time, while FTIR p.m. data (after 12:00 UTZ) have been corrected to the DOAS p.m. using the
Fractional day Local SZA
Figure 3.Example of the NO2photochemical behaviour from the SLIMCAT box model over Izaña. Red and green lines are the NO2 VCD daily variation at the summer and winter solstices, respec-tively. Grey areas are the time overpasses of SCIAMACHY and OMI instruments (adapted from Gil et al., 2008).
BIRA-IASB (Belgian Institute for Space Aeronomy) stacked box photochemical model PSCBOX (Hendrick et al., 2004, 2012), daily initialized with SLIMCAT 3-D CTM chemi-cal and meteorologichemi-cal fields (Chipperfield, 2006) extracted for (30◦N, 0◦E) for the 2000–2009 period. Based on these simulations, a climatology of NO2VCD diurnal variation is
built and correction factors appropriate for the photochemi-cal matching between FTIR and DOAS observations are ex-tracted from it. The ESZAs have been used for this purpose. Another potential source of discrepancy might arise from the local meteorology diurnal variation. FTIR takes measure-ments in the hours around noon, when the mountain anabatic winds transport air masses from the marine boundary layer to the level of the station, as can be seen from “in situ” measure-ments (Gil-Ojeda et al., 2015). However, since the upwelling takes place in a shallow layer near the surface, the impact on the overall column seems to be very low. The DOAS in-strument measures during twilight, when a breeze, should one exist, is minimal. In summary, we expect the diurnal up-welling to have a negligible impact in the comparison.
7 Results
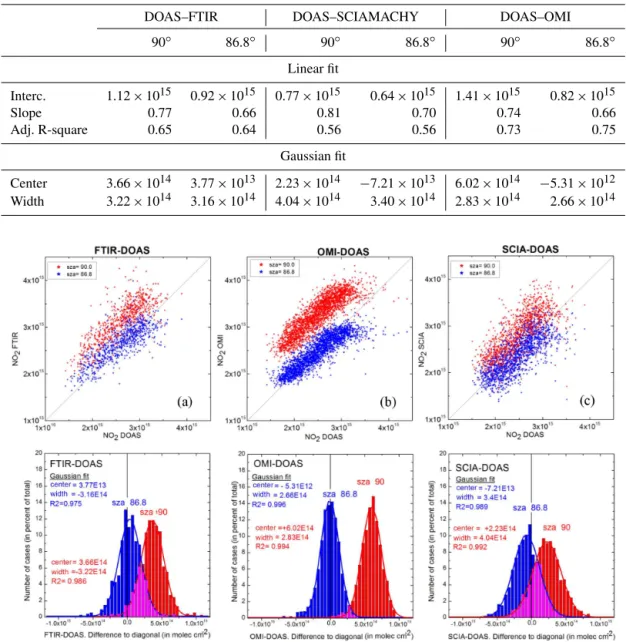
Figure 4 displays the cross-correlation of FTIR (a.m. data), SCIAMACHY and OMI data vs. DOAS by considering the SZA over the station and the ESZA for the collocation cri-teria correction described in previous sections. The figures show that in all three cases the agreement strongly improves when the photochemical correction due to temporal collo-cation is referred to the ESZA, where the bulk of the NO2
Table 2.Results of the linear fit of DOAS vs. FTIR, OMI and SCIAMACHY NO2VCD for SZA=90◦and ESZA=86.8◦.
DOAS–FTIR DOAS–SCIAMACHY DOAS–OMI
90◦ 86.8◦ 90◦ 86.8◦ 90◦ 86.8◦
Linear fit
Interc. 1.12×10¹⁵ 0.92×10¹⁵ 0.77×10¹⁵ 0.64×10¹⁵ 1.41×10¹⁵ 0.82×10¹⁵
Slope 0.77 0.66 0.81 0.70 0.74 0.66
Adj. R-square 0.65 0.64 0.56 0.56 0.73 0.75
Gaussian fit
Center 3.66×10¹⁴ 3.77×10¹³ 2.23×10¹⁴ −7.21×10¹³ 6.02×10¹⁴ −5.31×10¹²
Width 3.22×10¹⁴ 3.16×10¹⁴ 4.04×10¹⁴ 3.40×10¹⁴ 2.83×10¹⁴ 2.66×10¹⁴
Figure 4.Upper panel: scatter plot of the NO2measured by DOAS instrument (xaxis) and(a)FTIR,(b)OMI and(c)SCIAMACHY in theyaxis. The effective SZA=90◦is presented in red stars and effective SZA=86.8◦in blue stars. Solid diagonal represents the ideally perfect agreement. Lower panel: frequency distribution of the distance of each cross-correlation point to the diagonal considering for the photochemical correction the local SZA at 90◦(red) and the effective SZA at 86.8◦(blue). See text for details.
comparison. In Fig. 4 (lower panel) the frequency analysis of the distance from the pointP (X, DOAS) to the 1:1 line is represented, whereX is all other instruments. In Table 2 the parameters of the Gaussians and the linear fits are shown. The mean distance with respect to the 1:1 line of the FTIR– DOAS represented by the Gaussian frequency distribution improves from 3.66×10¹⁴ to 3.77×10¹³molec cm−2, the OMI–DOAS from 6.02×10¹⁴ to −5.31×10¹² and the SCIAMACHY–DOAS from 2.23×10¹⁴to−7.21×10¹³.
From now on, stratospheric NO2 converted to 90◦ is not
used any more in this work. All following results have been computed with the ESZA correction.
The FTIR NO2photochemically corrected data are
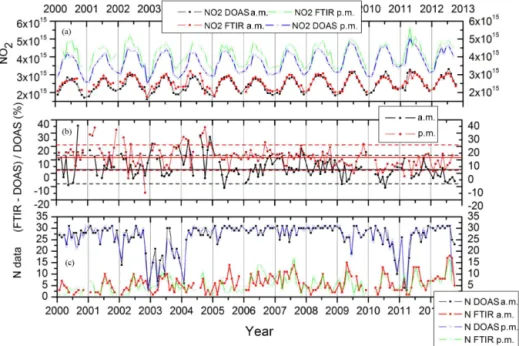
aver-aged to have one value per twilight. Figure 5a presents the monthly mean variation of the NO2measured by the DOAS
and the FTIR instruments. The lower values on the plot cor-respond to a.m. values whereas the higher ones are p.m. NO2
Figure 5. (a)Monthly mean evolution of NO2VCD from DOAS (black dots for a.m. and blue for p.m.) and FTIR (red dots for a.m. and green for p.m.).(b)Relative differences: solid line presents the mean relative difference and the dash lines represent the mean relative difference plus and minus the standard deviation in black for a.m. and in red for p.m. values.(c)Shows the number of days used to compute the monthly mean.
afternoon, high-NO2boundary layer air masses are upwelled
by the forced heating of the surface (upslope breeze) and can be seen by the direct-sun FTIR, even though its response to tropospheric pollution is small. Additionally, air masses lo-cated to the west, in mid-Atlantic, are representative of the background condition, whereas the eastern ones have slightly more NO2 in the troposphere, contributing to 3–4 % larger
columns (Fig. 6). The treatment of the NO2 diurnal
varia-tion in the box model used for the correcvaria-tion might have a contribution as well, specifically the N2O5photodissociation
rate. These results show the limitations existent when com-paring remote-sensing data obtained with independent tech-niques sampling non-identical air masses at non-identical times. Figure 5b also shows a change in the FTIR–DOAS behaviour at the beginning of 2005 both in a.m. and p.m. data. In that year the FTIR instrument was switched from a Bruker IFS 120M to a Bruker IFS 120/5HR, which is less noisy than its predecessor. The improvement is observed by a decrease in the relative differences between instruments. It is also observed that FTIR NO2values are, in general, higher
than DOAS NO2values. Dirksen et al. (2011) found similar
results over Izaña, in contrast to Hendrick et al. (2012) who found FTIR measurements lower than DOAS SAOZ instru-ment by 7.8±8.2 % on average over the NDACC Jungfrau-joch station. Such differences are attributed to uncertainties related to the respective spectroscopic parameters and differ-ences in sensitivity profiles. Adams et al. (2012) compared FTIR results with SAOZ and PEARL (Polar Environment Atmospheric Research Laboratory) GB instruments
operat-ing in the UV and the visible. They found that FTIR measures less NO2than the DOAS instruments by 12.2±19.2 %.
Figure 7 shows the OMI comparison with DOAS and FTIR measurements. OMI stratospheric NO2 data located
300 km around the Izaña station were used. Figure 7b shows the relative differences in percent of satellite minus GB NO2values. In general, the results compare extremely well
within −0.2±8.7 % for the OMI–DOAS validation and −1.6±6.9 % for the OMI–FTIR (see Table 3). Dirksen et al. (2011) validated OMI NO2 with independent GB
mea-surements from October 2004 to May 2010. Over Izaña, they presented OMI vs. FTIR relative differences from 4 to 7 %, which are similar to the present paper’s results, while for the OMI–DOAS relative differences are larger, in the range of 26 to 29 %. A possible reason for that difference is the photochemical correction applied to the NO2 DOAS
data to be compared with the OMI data. FTIR measurements used in this study, however, were close in time to the OMI overpass and no corrections to the data were made. Bel-monte Rivas et al. (2014) found that OMI stratospheric NO2
columns were higher than those obtained with the SCIA-MACHY and GOME-2 instruments. They claim that the bias of the OMI NO2slant columns are due to ancillary data used
Figure 6. Areas where DOAS (grey rectangles) and FTIR (blue rectangle) are scanning the stratosphere. A complete year of SCIA-MACHY NO2 vertical column density (VCD) with values above 3.3×10¹⁵molec cm−2is shown (red crosses). The value is arbi-trarily selected to provide a hint of the pollution influence over the area.
Table 3.Statistics of the relative difference of the stratospheric NO2 from ground-based and satellite instruments in percent.
No. Mean Standard
deviation
FTIR–DOAS (a.m.) 746 2.8 10.7
FTIR–DOAS (p.m.) 698 11.7 9.5
OMI–DOAS 2355 −0.2 8.7
OMI–DOAS (EAM text)∗ 1298 0.2 8.6
SCIA–DOAS 1326 −3.7 11.7
OMI–FTIR 540 −1.6 6.9
SCIA–FTIR 314 −5.7 11.0
∗EAM is effective air mass.
(Marchenko et al., 2015; van Geffen et al., 2015). Marchenko et al. (2015) showed a reduction of the stratospheric NO2
VCD of 20–30 %. Van Geffen et al. (2015) found a reduction of the root mean square of about 32 %. Remarkably, in this work such discrepancies were not found. This issue is still open and further work is required to understand the discrep-ancies.
Even though the results shown in our paper agree well with the literature, a test exercise has been carried out to
im-prove the quality of the validation exercise. Following the recommendation made in Sect. 6 about the effective air mass (EAM) for the OMI–DOAS validation, instead of using all the OMI data retrieved 200 km around the station, we have only selected the data whose centre longitude falls in be-tween the station and the sun (a.m. values). In that way the OMI measurements closer to the effective DOAS air mass are included in the validation. The new result of the validation is 0.2±8.6 %, which presents a minor improvement of the val-idation (see in Table 3), proving that this effect is not crucial for the stratospheric NO2 because its longitudinal variation
is small. Therefore this test exercise has not been applied to SCIAMACHY data that are presented next.
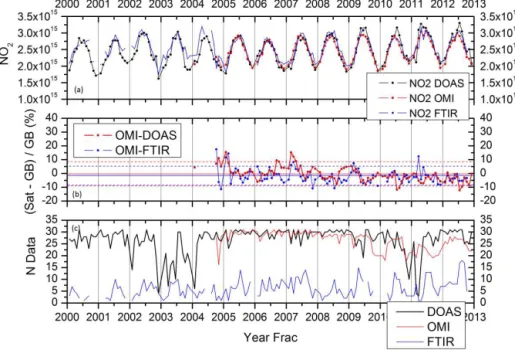
The stratospheric NO2 dataset from SCIAMACHY has
been compared with DOAS and FTIR data as well. The monthly mean interannual variation is presented in Fig. 8a. The relative mean difference in percent of the stratospheric NO2 from SCIAMACHY, DOAS and FTIR instruments is
shown in Fig. 8b. Results show that SCIAMACHY agrees within−3.7±11.7 % with DOAS and within−5.7±11.0 % for the comparison with FTIR results. A summary of the re-sults are shown in Table 3. Note that the days used for the intercomparison are not the same for all the pairs of instru-ments since the intercomparison depends on the availability of data. Results are reasonable, even though SCIAMACHY generates lower values than the GB instruments, in con-trast with previous studies. Gil et al. (2008) reported SCIA-MACHY minus DOAS differences of 1.1 % over Izaña, but with SCIAMACHY being higher than DOAS values. Hen-drick et al. (2012) also report higher SCIAMACHY NO2
val-ues than SAOZ over Jungfraujoch of 1.9±11.5 %. The most probable reason for the discrepancies is related to the photo-chemical correction carried out to the SCIAMACHY results. In the present study, the ESZA has been used for the correc-tion, leading to lower values of stratospheric NO2than those
obtained using the local SZA in previous analysis. Taking into account the differences in techniques and time of mea-surements, SCIAMACHY and GB data are in good agree-ment.
The agreement of the different instruments is found to be seasonally dependent (Fig. 9). There is little scattering and differences around zero on spring months (AMJ), whereas discrepancy increases towards the winter months. All ments remain within 10 % or better. Surprisingly, GB instru-ments behave differently than the satellite ones. OMI and SCIAMACHY show the seasonal maximum in June, quite in phase with the solar radiation. Ground-based instruments, in contrast, display the maximum in July and large columns are found in September as well. Gil et al. (2008) found the NO2
column over Izaña for the period 1994–2005 to be modulated by the middle-stratospheric temperature. However, the max-imum of the secondary NO2cycle is located in March and
Figure 7.Same as Fig. 5 but for OMI vs. DOAS and FTIR (only a.m. data). Note that the scale in the top plot is different from Fig. 5.
Figure 8.Same as Fig. 5 but for SCIAMACHY vs. DOAS and FTIR (only a.m. data). Note that the scale in the top plot is different from Fig. 5.
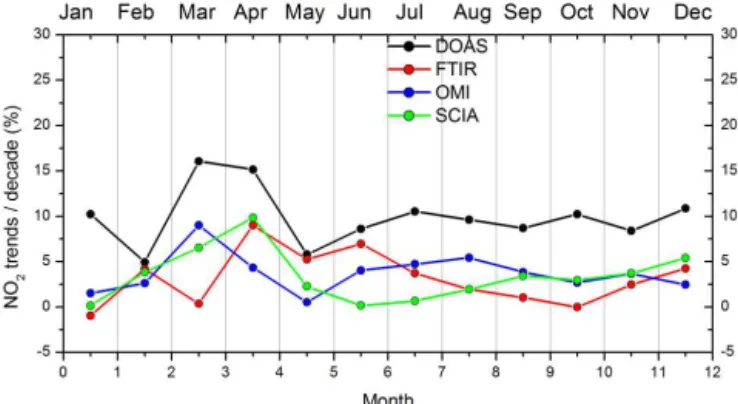
A preliminary estimation of stratospheric NO2 VCD
trends has been made by means of a linear regression cal-culation. In order to avoid the NO2seasonal dependence, the
calculation has been performed for each month (see Fig. 10). In the study, neither the influence of the solar cycle (quasi-biennial oscillation) nor that of the stratospheric temperature is included. Over our study station the evolution of the NO2
is dominated by the seasonal waves; therefore, the omission
of the quasi-biennial oscillation and the stratospheric tem-perature has a minor effect. A more detailed study on NO2
trends is ongoing in order to improve the preliminary trends presented here and to better understand the results.
All instruments show positive trends in NO2stratospheric
NO VCD (molec cm )
2
-2
Figure 9. (a) Seasonal variation of NO2 derived from DOAS (black), FTIR (red), OMI (blue) and SCIAMACHY (blue-green).
(b) NO2relative difference from the instruments with respect to DOAS.
Figure 10.NO2monthly trends from year 2000 to 2012.
while FTIR, OMI and SCIAMACHY trends show values up to 10 % decade−1on individual months, but lower on average and with small confidence levels. The preliminary results of the FTIR trend is significant at the 60 % of confidence level, OMI trend at the 80 % and SCIAMACHY at the 60 % of con-fidence level. On the annual mean, DOAS trend is larger by a factor of 3 than the rest of the instruments. These posi-tive trends exceed by far those expected by the nitrous ox-ide oxidation. N2O is increasing at a nearly steady rate of
2.5 % decade−1(Liley et al., 2000). It is also of opposite sign to those found over the Jungfraujoch station in the Swiss Alps (Hendrick et al., 2012). The observed trend could be slightly biased if a trend in the stratospheric temperature has occurred during the analysed period. A recent report based on the most extensive satellite data to date found little or no trend in global lower stratospheric temperature from 1995 to
2013 (Seidel et al., 2015). ERA-Interim data at 10 hPa exam-ined by the authors show a nonsignificant negative trend of 0.2K/decade, which should have no impact on the calculated NO2trend.
The observed increase at tropical–subtropical latitudes is in agreement with the analysis of the MIPAS global NOydata
for the period 2002 to 2012 and the output of the WACCM model for the same period of time (Funke et al., 2015). Since the global NOy remains almost constant, the observed
in-crease has been attributed to a displacement of the subtrop-ical barrier as a consequence of stratospheric temperature changes (Eckert et al., 2014). The maximum trend occurs in late winter and beginning of spring, supporting the dynamic explanation.
8 Conclusions
NO2total columns derived from two GB independent
tech-niques, DOAS and FTIR, from the NDACC network over Izaña (28◦N, 16◦ W; 2370 m a.s.l.) have been intercom-pared for the period 2002–2012. Once mutual consistency has been proven, GB data have been used for OMI and SCIA-MACHY validation of NO2 stratospheric product. The
lower stratosphere where the increase of dynamical origin seems to have been taking place.
9 Data availability
The data used in this work are publicly available: DOAS and FTIR data are available from the NDACC web page (http://www.ndsc.ncep.noaa.gov/); the SCIAMACHY data from http://www.iup.uni-bremen.de/doas/scia_no2_ data_acve.htm and OMI data are available from http: //avdc.gsfc.nasa.gov/index.php?site=666843934&id=13.
Acknowledgements. This publication has been funded by the
AVATAR project of the Spanish national funding Agency (MINECO: CGL2014-55230-R ). This work has been carried out in the frame of the NORS (Demonstration Network of Ground-Based Remote Sensing Observations in support of the Copernicus Atmo-spheric Service) project (funded by the European Community’s Seventh Framework Programme (FP7/2007–2013) under grant agreement no. 284421; http://nors.aeronomie.be/) and has been partially supported by AMISOC project funded by the Spanish national funding Agency (CGL2011-24891). Authors acknowledge F. Hendrick from the BIRA-IASB Institute for making available the photochemical correction used in this paper, the Institute of Environmental Physics of the University of Bremen for the SCIAMACHY NO2 data and the Goddard Space Flight Center from NASA for the OMI NO2data. Comments from the editor, Folkert Boersma, significantly improved the paper. We also ac-knowledge Emilio Cuevas for the temperature data series he sent us.
Edited by: F. Boersma
Reviewed by: two anonymous referees
References
Adams, C., Strong, K., Batchelor, R. L., Bernath, P. F., Brohede, S., Boone, C., Degenstein, D., Daffer, W. H., Drummond, J. R., Fogal, P. F., Farahani, E., Fayt, C., Fraser, A., Goutail, F., Hen-drick, F., Kolonjari, F., Lindenmaier, R., Manney, G., McElroy, C. T., McLinden, C. A., Mendonca, J., Park, J.-H., Pavlovic, B., Pazmino, A., Roth, C., Savastiouk, V., Walker, K. A., Weaver, D., and Zhao, X.: Validation of ACE and OSIRIS ozone and NO2 measurements using ground-based instruments at 80◦ N, Atmos. Meas. Tech., 5, 927–953, doi:10.5194/amt-5-927-2012, 2012. Aura Validation Center: EOS Aura OMI OMNO2
(Collec-tion 3), available at: http://avdc.gsfc.nasa.gov/index.php?site= 666843934&id=13, 2016.
Belmonte Rivas, M., Veefkind, P., Boersma, F., Levelt, P., Eskes, H., and Gille, J.: Intercomparison of daytime stratospheric NO2 satellite retrievals and model simulations, Atmos. Meas. Tech., 7, 2203–2225, doi:10.5194/amt-7-2203-2014, 2014.
Blumenstock, T.: FTIR Izaña Total Clolumn, available at: ftp://ftp. cpc.ncep.noaa.gov/ndacc/station/izana/ames/ftir/, 2005–2008. Boersma, K. F., Bucsela, E. J., Brinksma, E. J., and Gleason, J. F.:
NO2, in: OMI Algorithm Theoretical Basis Document, 4, OMI Trace Gas Algorithms, ATB-OMI-04, Version 2.0, 20 edited by:
Chance, K., 13–36, NASA Distrib. Active Archive Cent., Green-belt, MD, USA, August 2002.
Boersma, K. F., Eskes, H. J., and Brinksma, E. J.: Error analysis for tropospheric NO2retrieval from space, J. Geophys. Res.-Atmos., 109, D04311, doi:10.1029/2003JD003962, 2004.
Bogumil, K., Orphal, J., Flaud, J. M., and Burrows, J. P.: Vibra-tional progressions in the visible and near ultraviolet absorption spectrum of ozone, Chem. Phys. Lett., 349, 241–248, 2001. Bovensmann, H., Burrows, J. P., Buchwitz, M., Frerick, J., L, S.
N., Rozanov, V. V., Chance, K. V., and Goede, A. P. H.: SCIA-MACHY – Mission objectives and measurement modes, J. At-mos. Sci., 56, 125–150, 1999.
Brewer, A. W., Mcelroy, C. T., and Kerr, J. B.: Nitrogen Diox-ide Concentrations in the Atmosphere, Nature, 246, 129–133, doi:10.1038/246129a0, 1973.
Bucsela, E. J., Celarier, E. A., Wenig, M. O., Gleason, J. F., Veefkind, J. P., Boersma, K. F., and Brinksma, E. J.: Algorithm for NO2vertical column retrieval from the Ozone Monitoring In-strument, IEEE Trans. Geosci. Remote S., 44, 1245–1258, 2006. Bucsela, E. J., Krotkov, N. A., Celarier, E. A., Lamsal, L. N., Swartz, W. H., Bhartia, P. K., Boersma, K. F., Veefkind, J. P., Gleason, J. F., and Pickering, K. E.: A new stratospheric and tropospheric NO2retrieval algorithm for nadir-viewing satellite instruments: applications to OMI, Atmos. Meas. Tech., 6, 2607– 2626, doi:10.5194/amt-6-2607-2013, 2013.
Burrows, J. P. and Chance, K. V.: Scanning imaging absorp-tion spectrometer for atmospheric chartography, 1490, 146–154, 1991.
Burrows, J. P., Richter, A., Dehn, A., Deters, B., Himmelmann, S., Voigt, S., and Orphal, J.: Atmospheric remote sensing reference data from GOME – 2. Temperaturedependent absorption cross-sections of O3in the 231–794 nm range, J. Quant. Spectrosc. Ra., 61, 509–517, 1999.
Chance, K. V. and Spurr, R. J. D.: Ring effect studies: Rayleigh scattering, including molecular parameters for rotational Raman scattering, and the Fraunhofer spectrum, Appl. Optics, 36, 5224– 5230, 1997.
Chipperfield, M. P.: New version of the TOMCAT/SLIMCAT off-line chemical transport model: Intercomparison of stratospheric tracer experiments, Q. J. Roy. Meteor. Soc., 132, 1179–1203, doi:10.1256/qj.05.51, 2006.
Crutzen, P. J.: The influence of nitrogen oxides on the atmo-spheric ozone content, Q. J. Roy. Meteor. Soc., 96, 320–325, doi:10.1002/qj.49709640815, 1970.
Meteoro-logical Organization, Geneva, Switzerland, NIPO:281-15-004-2, WMO/GAW Report No. 219, 2015.
Denis, L., Roscoe, H. K., Chipperfield, M. P., Van Roozendael, M., and Goutail, F.: A new software suite for NO2 vertical profile retrieval from ground-based zenith-sky spectrometers’, J. Quant. Spectrosc. Ra., 92, 321–333, 2005.
Dirksen, R. J., Boersma, K. F., Eskes, H. J., Ionov, D. V., Bucsela, E. J., Levelt, P. F., and Kelder, H. M.: Evaluation of stratospheric NO2retrieved from the Ozone Monitoring Instrument: Intercom-parison, diurnal cycle, and trending, J. Geophys. Res.-Atmos., 116, D08305, doi:10.1029/2010JD014943, 2011.
Eckert, E., von Clarmann, T., Kiefer, M., Stiller, G. P., Lossow, S., Glatthor, N., Degenstein, D. A., Froidevaux, L., Godin-Beekmann, S., Leblanc, T., McDermid, S., Pastel, M., Stein-brecht, W., Swart, D. P. J., Walker, K. A., and Bernath, P. F.: Drift-corrected trends and periodic variations in MIPAS IMK/IAA ozone measurements, Atmos. Chem. Phys., 14, 2571– 2589, doi:10.5194/acp-14-2571-2014, 2014.
Eskes, H. J. and Boersma, K. F.: Averaging kernels for DOAS total-column satellite retrievals, Atmos. Chem. Phys., 3, 1285–1291, doi:10.5194/acp-3-1285-2003, 2003.
Fayt, C. and Van Roozendael M.: WinDOAS 2.1 Software User Manual, 2001.
Funke, B., Lopez-Puertas, M., Stiller, G., von Clarmann, T. and Ga-cia, R.: Stratospheric NOy: global budget and vaiability in 2002– 2012 from MIPAS observations, in: Regional SPARC workshop, Granada, Spain, 13–16 January 2015.
García, O. E., Schneider, M., Redondas, A., González, Y., Hase, F., Blumenstock, T., and Sepúlveda, E.: Investigating the long-term evolution of subtropical ozone profiles applying ground-based FTIR spectrometry, Atmos. Meas. Tech., 5, 2917–2931, doi:10.5194/amt-5-2917-2012, 2012.
Gil, M.: UV/VIS Izaña Total Column, available at: ftp://ftp.cpc. ncep.noaa.gov/ndacc/station/izana/ames/uvvis/, 2008–2013. Gil, M., Yela, M., Gunn, L. N., Richter, A., Alonso, I., Chipperfield,
M. P., Cuevas, E., Iglesias, J., Navarro, M., Puentedura, O., and Rodríguez, S.: NO2climatology in the northern subtropical re-gion: diurnal, seasonal and interannual variability, Atmos. Chem. Phys., 8, 1635–1648, doi:10.5194/acp-8-1635-2008, 2008. Gil-Ojeda, M., Navarro-Comas, M., Gómez-Martín, L., Adame, J.
A., Saiz-Lopez, A., Cuevas, C. A., González, Y., Puentedura, O., Cuevas, E., Lamarque, J.-F., Kinninson, D., and Tilmes, S.: NO2seasonal evolution in the north subtropical free troposphere, Atmos. Chem. Phys., 15, 10567–10579, doi:10.5194/acp-15-10567-2015, 2015.
Gisi, M., Hase, F., Dohe, S., and Blumenstock, T.: Camtracker: a new camera controlled high precision solar tracker sys-tem for FTIR-spectrometers, Atmos. Meas. Tech., 4, 47–54, doi:10.5194/amt-4-47-2011, 2011.
Gomez, L., Navarro-Comas, M., Puentedura, O., Gonzalez, Y., Cuevas, E., and Gil-Ojeda, M.: Long-path averaged mixing ra-tios of O3and NO2in the free troposphere from mountain MAX-DOAS, Atmos. Meas. Tech., 7, 3373–3386, doi:10.5194/amt-7-3373-2014, 2014.
Greenblatt, G. D., Orlando, J. J., Burkholder, J. B., and Ravis-hankara, A. R.: Absorption Measurements of Oxygen Between 330 and 1140 nm, J. Geophys. Res., 95, 18577–18582, 1990. Gruzdev, A. N. and Elokhov, A. S.: Validating NO2measurements
in the vertical atmospheric column with the OMI instrument
aboard the EOS Aura satellite against ground-based measure-ments at the Zvenigorod Scientific Station, Izv. Atmospheric Ocean. Phys., 45, 444–455, doi:10.1134/S0001433809040057, 2009.
Harder, J. W. and Brault, J. W.: Atmospheric measurements of water vapor in the 442-nm region, J. Geophys. Res., 102, 6245–6252, doi:10.1029/96JD01730, 1997.
Hase, F., Blumenstock, T., and Paton-Walsh, C.: Analysis of the instrumental line shape of high-resolution Fourier transform IR spectrometers with gas cell measurements and new retrieval soft-ware, Appl. Opt., 38, 3417, doi:10.1364/AO.38.003417, 1999. Hase, F., Hannigan, J. W., Coffey, M. T., Goldman, A., Höpfner, M.,
Jones, N. B., Rinsland, C. P. and Wood, S. W.: Intercomparison of retrieval codes used for the analysis of high-resolution, ground-based FTIR measurements, J. Quant. Spectrosc. Ra., 87, 25–52, doi:10.1016/j.jqsrt.2003.12.008, 2004.
Hendrick, F., Barret, B., Van Roozendael, M., Boesch, H., Butz, A., De Mazière, M., Goutail, F., Hermans, C., Lambert, J.-C., Pfeilsticker, K., and Pommereau, J.-P.: Retrieval of nitro-gen dioxide stratospheric profiles from ground-based zenith-sky UV-visible observations: validation of the technique through correlative comparisons, Atmos. Chem. Phys., 4, 2091–2106, doi:10.5194/acp-4-2091-2004, 2004.
Hendrick, F., Mahieu, E., Bodeker, G. E., Boersma, K. F., Chipper-field, M. P., De Mazière, M., De Smedt, I., Demoulin, P., Fayt, C., Hermans, C., Kreher, K., Lejeune, B., Pinardi, G., Servais, C., Stübi, R., van der A, R., Vernier, J.-P., and Van Roozendael, M.: Analysis of stratospheric NO2trends above Jungfraujoch using ground-based UV-visible, FTIR, and satellite nadir observations, Atmos. Chem. Phys., 12, 8851–8864, doi:10.5194/acp-12-8851-2012, 2012.
Hermans, C., Vandaele, A. C., Carleer, M., Fally, S., Colin, R., Jenouvrier, A., Coquart, B., and Mérienne, M. F., Absorption Cross-Sections of Atmospheric Constituents: NO2, O2and H2O, Environ. Sci. Poll. Res., 6, 151–158, doi:10.1007/BF02987620, 1999.
Kerr, J. B. and McElroy, C. T.: Measurement of stratospheric nitro-gen dioxide from the AES stratospheric balloon program, Atmo-sphere, 14, 166–171, 1976.
Lambert, J.-C., Granville, J., Van Roozendael, M., Sarkissian, A., Goutail, F., and Muller, J.: A climatology of NO2profile for im-proved Air Mass Factors for ground-based vertical column mea-surements, in Fifth European workshop on stratospheric ozone, 3–6, Saint Jean de Luz, France, 1999.
Lambert, J.-C., Pinardi, G., Granville, J., Clemer, K., Del-cloo, A., Valks, P., and Hao, N.: GOME-2 NO2 total col-umn validation report, SAF/O3M/IASB/VR/NO2/095, available at: http://o3msaf.fmi.fi/docs/vr/Validation_Report_NTO_OTO_ NO2_Feb_2011.pdf (last access: 9 September 2016), Febru-ary 2011.
Levelt, P. F., van den Oord, G. H., Dobber, M. R., Malkki, A., Visser, H., de Vries, J., Stammes, P., Lundell, J. O. V., and Saari, H.: The ozone monitoring instrument, IEEE T. Geosci. Remote, 44, 1093–1101, 2006.
Marchenko, S., Krotkov, N. A., Lamsal, L. N., Celarier, E. A., Swartz, W. H., and Bucsela, E. J.: Revising the slant column den-sity retrieval of nitrogen dioxide observed by the Ozone Mon-itoring Instrument. J. Geophys. Res.-Atmos., 120, 5670–5692, doi:10.1002/2014JD022913, 2015.
Noxon, J. F.: Nitrogen dioxide in the stratosphere and troposphere measured by ground-based absorption spectroscopy, Science, 189, 547–549, doi:10.1126/science.189.4202.547, 1975. Peters, E., Wittrock, F., Großmann, K., Frieß, U., Richter, A.,
and Burrows, J. P.: Formaldehyde and nitrogen dioxide over the remote western Pacific Ocean: SCIAMACHY and GOME-2 validation using ship-based MAX-DOAS observations, Atmos. Chem. Phys., 12, 11179–11197, doi:10.5194/acp-12-11179-2012, 2012.
Platt, U. and Stutz, J.: Differential optical absorption spectroscopy: principles and applications, Springer, Berlin, ISBN-13: 978-3-540-75776-4, 2008.
Puentedura, O., Gil, M., Saiz-Lopez, A., Hay, T., Navarro-Comas, M., Gómez-Pelaez, A., Cuevas, E., Iglesias, J., and Gomez, L.: Iodine monoxide in the north subtropical free troposphere, At-mos. Chem. Phys., 12, 4909–4921, doi:10.5194/acp-12-4909-2012, 2012.
Richter, A.: Stratospheric NO2data, available at: http://www.iup. uni-bremen.de/doas/scia_no2_data_acve.htm, 2007.
Richter, A. and Burrows, J. P.: Retrieval of tropospheric NO2from GOME measurements, Adv. Space Res., 29, 1673–1683, 2002. Rodgers, C. D.: Inverse methods for atmospheric sounding: theory
and practice, Reprinted, World Scientific, Singapore, ISBN-13: 978-9810227401, 2004.
Rothman, L. S., Gordon, I. E., Barbe, A., Benner, D. C , Bernath, P. F., Birk, M., Boudon, V., Brown, R., Campargue, A., Champion, J.-P., Chance, V, Coudert, L. H., Dana, V., Devi, V. M., Sally, S., Flaud, J.-M., Gamache, R. R., Goldman, A., Jacquemart, D., Kleiner, I., Lacome, N., Lafferty,W. J., Mandin, J.-Y., assie, S. T., Mikhailenko, S. N., Miller, C. E., Moazzen-Ahmadi, N., Nau-menko, O. V., Nikitin, A. V., Orphal, J., Perevalov, V. I., Perrin , A., Predoi-Cross, A., Rinsland, C. P., Rotger, M., Simeckova, M., Smith, M. A. H., Sung, K., Tashkun, S. A., Tennyson J., Toth, R. A., Vandaele, A. C., and Vander Auwera, J.: The HITRAN 2008 molecular spectroscopic database, J. Quant. Spectrosc. Ra., 110, 533–572, 2009.
Sarkissian, A., Roscoe, H. K., Fish, D., Van Roozendael, M., Gil, M., Chen, H. B., Wang, P., Pommereau, J.-P., and Lenoble, J.: Ozone and NO2 air-mass factors for zenith-sky spectrometers: Intercomparison of calculations with different radiative transfer models Geophys. Res. Lett., 22, 1113–1116, 1995.
Schneider, M., Blumenstock, T., Chipperfield, M. P., Hase, F., Kouker, W., Reddmann, T., Ruhnke, R., Cuevas, E., and Fischer, H.: Subtropical trace gas profiles determined by ground-based FTIR spectroscopy at Izaña (28◦N, 16◦W): Five-year record, error analysis, and comparison with 3-D CTMs, Atmos. Chem. Phys., 5, 153–167, doi:10.5194/acp-5-153-2005, 2005.
Seidel, D. J., Li, J., Mears, C., Moradi, I., Nash, J., Randel, W. J., Saunders, R.,Thompson, D. W. J., and Zou, C. Z..: Stratospheric temperature changes during the satellite era, J. Geophys. Res.-Atmos., 121, 664–681, doi:10.1002/2015JD024039, 2016.
Sussmann, R., Stremme, W., Burrows, J. P., Richter, A., Seiler, W., and Rettinger, M.: Stratospheric and tropospheric NO2 vari-ability on the diurnal and annual scale: a combined retrieval from ENVISAT/SCIAMACHY and solar FTIR at the Permanent Ground-Truthing Facility Zugspitze/Garmisch, Atmos. Chem. Phys., 5, 2657–2677, doi:10.5194/acp-5-2657-2005, 2005. Syed, M. Q. and Harrison, A. W.: Seasonal trend of
strato-spheric NO2 over Calgary, Can. J. Phys., 59, 1278–1279, doi:10.1139/p81-166, 1981.
Vandaele, A. C., Hermans, C., Simon, P. C., Carleer, M., Colin, R., Fally, S., Mérienne, M. F., Jenouvrier, A., and Coquart, B.: Measurements of the NO2 absorption cross-section from 42 000 cm−1 to 10 000 cm−1 (238–1000 nm) at 220 K and 294 K, J. Quant. Spectrosc. Ra., 59, 171–184, doi:10.1016/S0022-4073(97)00168-4, 1998.
van Geffen, J. H. G. M., Boersma, K. F., Van Roozendael, M., Hen-drick, F., Mahieu, E., De Smedt, I., Sneep, M., and Veefkind, J. P.: Improved spectral fitting of nitrogen dioxide from OMI in the 405–465 nm window, Atmos. Meas. Tech., 8, 1685–1699, doi:10.5194/amt-8-1685-2015, 2015.
Van Roozendael, M. and Hendrick, F.: Recommendations for NO2 column retrieval from NDACC zenith-sky UV-VIS spectrom-eters, NDACC 2012, available at: http://uv-vis.aeronomie.be/ groundbased/NDACC_UVVIS-WG_NO2settings_v3.pdf, (last access: 14 July 2016), 2012.
Van Roozendael, M., Spurr, R., Loyola, D., Lerot, C., Balis, D., Lambert, J.-C., Zimmer, W., van Gent, J., van Geffen, J., Koukouli, M., Granville, J., Doicu, A., Fayt, C., and Zehner, C.: Sixteen years of GOME/ERS-2 total ozone data: The new direct-fitting GOME Data Processor (GDP) ver-sion 5 – Algorithm description, J. Geophys. Res., 117, D03305, doi:10.1029/2011JD016471, 2012.
Vaughan, G., Roscoe, H. K., Bartlett, L. M., O’Connor, F., Sarkissian, A., Van Roozendael, M., Lambert, J.-C., Simon, P. C., Karlsen, K., Kaestad Hoiskar, B. A., Fish, D. J., Jones, R. L., Freshwater, R., Pommereau, J.-P., Goutail, F., Andersen, S. B., Drew, D. G., Hughes, P. A., Moore, D., Mellqvist, J., Hegels, E., Klupfel, T., Erle, F., Pfeilsticker, K., and Platt, U.: An intercom-parison of ground-based UV-visible sensors of ozone and NO2, J. Geophys. Res., 102, 1411–1422, 1997.