ACPD
12, 12357–12389, 2012Analysis of stratospheric NO2
trends above Jungfraujoch
F. Hendrick et al.
Title Page
Abstract Introduction
Conclusions References
Tables Figures
◭ ◮
◭ ◮
Back Close
Full Screen / Esc
Printer-friendly Version
Interactive Discussion
Discussion
P
a
per
|
Dis
cussion
P
a
per
|
Discussion
P
a
per
|
Discussio
n
P
a
per
|
Atmos. Chem. Phys. Discuss., 12, 12357–12389, 2012 www.atmos-chem-phys-discuss.net/12/12357/2012/ doi:10.5194/acpd-12-12357-2012
© Author(s) 2012. CC Attribution 3.0 License.
Atmospheric Chemistry and Physics Discussions
This discussion paper is/has been under review for the journal Atmospheric Chemistry and Physics (ACP). Please refer to the corresponding final paper in ACP if available.
Analysis of stratospheric NO
2
trends
above Jungfraujoch using ground-based
UV-visible, FTIR, and satellite nadir
observations
F. Hendrick1, E. Mahieu2, G. E. Bodeker3, K. F. Boersma4,5, M. P. Chipperfield6, M. De Mazi `ere1, I. De Smedt1, P. Demoulin2, C. Fayt1, C. Hermans1, K. Kreher7, B. Lejeune2, G. Pinardi1, C. Servais2, R. St ¨ubi8, R. van der A4, J.-P. Vernier9,10, and M. Van Roozendael1
1
Belgian Institute for Space Aeronomy (BIRA-IASB), Brussels, Belgium
2
Institute of Astrophysics and Geophysics of the University of Li `ege, Li `ege, Belgium
3
Bodeker Scientific, Alexandra, New Zealand
4
Royal Netherlands Meteorological Institute (KNMI), De Bilt, The Netherlands
5
Eindhoven University of Technology, Eindhoven, The Netherlands
6
School of Earth and Environment, University of Leeds, Leeds, UK
7
National Institute of Water and Atmospheric Research, Omakau, Central Otago, New Zealand
8
MeteoSwiss, Payerne, Switzerland
9
Science Systems and Applications, Inc., Hampton, Virginia, USA
10
ACPD
12, 12357–12389, 2012Analysis of stratospheric NO2
trends above Jungfraujoch
F. Hendrick et al.
Title Page
Abstract Introduction
Conclusions References
Tables Figures
◭ ◮
◭ ◮
Back Close
Full Screen / Esc
Printer-friendly Version
Interactive Discussion
Discussion
P
a
per
|
Dis
cussion
P
a
per
|
Discussion
P
a
per
|
Discussio
n
P
a
per
|
Received: 15 March 2012 – Accepted: 3 May 2012 – Published: 15 May 2012
Correspondence to: F. Hendrick ([email protected])
ACPD
12, 12357–12389, 2012Analysis of stratospheric NO2
trends above Jungfraujoch
F. Hendrick et al.
Title Page
Abstract Introduction
Conclusions References
Tables Figures
◭ ◮
◭ ◮
Back Close
Full Screen / Esc
Printer-friendly Version
Interactive Discussion
Discussion
P
a
per
|
Dis
cussion
P
a
per
|
Discussion
P
a
per
|
Discussio
n
P
a
per
|
Abstract
The trend in stratospheric NO2column at the NDACC (Network for the Detection of At-mospheric Composition Change) station of Jungfraujoch (46.5◦N, 8.0◦E) is assessed using ground-based FTIR and zenith-scattered visible sunlight SAOZ measurements over the period 1990 to 2009 as well as a composite satellite nadir data set con-5
structed from ERS-2/GOME, ENVISAT/SCIAMACHY, and METOP-A/GOME-2 obser-vations over the 1996–2009 period. To calculate the trends, a linear least squares re-gression model including explanatory variables for a linear trend, the mean annual cycle, the quasi-biennial oscillation (QBO), solar activity, and stratospheric aerosol loading is used. For the 1990–2009 period, statistically indistinguishable trends of 10
−3.7±1.1 %/decade and −3.6±0.9 %/decade are derived for the SAOZ and FTIR NO2column time series, respectively. SAOZ, FTIR, and satellite nadir data sets show a similar decrease over the 1996–2009 period, with trends of −2.4±1.1 %/decade,
−4.3±1.4 %/decade, and −3.6±2.2 %/decade, respectively. The fact that these de-clines are opposite in sign to the globally observed+2.5%/decade trend in N2O, sug-15
gests that factors other than N2O are driving the evolution of stratospheric NO2 at northern mid-latitudes. Possible causes of the decrease in stratospheric NO2columns have been investigated. The most likely cause is a change in the NO2/NO partitioning in favor of NO, due to a possible stratospheric cooling and a decrease in stratospheric chlorine content, the latter being further confirmed by the negative trend in the ClONO2 20
column derived from FTIR observations at Jungfraujoch. Decreasing ClO concentra-tions slows the NO+ClO → NO2+Cl reaction and a stratospheric cooling slows the NO+O3→NO2+O2 reaction, leaving more NOx in the form of NO. The slightly posi-tive trends in ozone estimated from ground- and satellite-based data sets are also con-sistent with the decrease of NO2 through the NO2+O3→NO3+O2 reaction. Finally, 25
ACPD
12, 12357–12389, 2012Analysis of stratospheric NO2
trends above Jungfraujoch
F. Hendrick et al.
Title Page
Abstract Introduction
Conclusions References
Tables Figures
◭ ◮
◭ ◮
Back Close
Full Screen / Esc
Printer-friendly Version
Interactive Discussion
Discussion
P
a
per
|
Dis
cussion
P
a
per
|
Discussion
P
a
per
|
Discussio
n
P
a
per
|
1 Introduction
Nitrogen dioxide (NO2) plays an important role in controlling ozone abundances in the stratosphere (Solomon, 1999), either by destroying ozone through the NOx(NO+NO2) catalytic destruction cycles, or by mitigating ozone destruction by converting ac-tive chlorine, hydrogen, and bromine into their reservoir forms (ClONO2, HNO3, and 5
BrONO2, respectively). The primary source of NOx is the oxidation of nitrous oxide (N2O) in the middle stratosphere. N2O is an important greenhouse gas and its emis-sions in the troposphere are known to be increasing by 2.5–3 % per decade (Liley et al., 2000), mainly due to agricultural activity. Monitoring long-term changes in stratospheric NO2is essential for attributing observed changes in stratospheric ozone. However, few 10
studies of the long-term evolution of stratospheric NO2 have been published to date. Liley et al. (2000) reported an increase in stratospheric NO2of about 5 %/decade from ground-based zenith-scattered visible sunlight measurements at Lauder, New Zealand (45◦S, 170◦E) between 1981 and 1999. Recently, Dirksen et al. (2011) further con-firmed an increase of NO2 of 5 %/decade over this station for the 1981–2010 period 15
also from ground-based UV-visible data. Using 3-D-Chemical Transport Model calcu-lations, McLinden et al. (2001) suggested that the 5 %/decade NO2 trend from 1981 to 1999 results from a 2.5 %/decade increase due to rising N2O emissions and further 2.5 %/decade increase resulting from a decrease in stratospheric ozone. The abun-dance of NO2in the stratosphere can be affected by ozone through the following reac-20
tion (Fish et al., 2000):
NO2+O3→NO3+O2 (R1)
Gruzdev (2009) investigated the latitudinal structure of the stratospheric NO2 trend using ground-based zenith-sky UV-visible and FTIR observations from a selection of 23 sites within the Network for the Detection of Atmospheric Composition Change 25
mid-ACPD
12, 12357–12389, 2012Analysis of stratospheric NO2
trends above Jungfraujoch
F. Hendrick et al.
Title Page
Abstract Introduction
Conclusions References
Tables Figures
◭ ◮
◭ ◮
Back Close
Full Screen / Esc
Printer-friendly Version
Interactive Discussion
Discussion
P
a
per
|
Dis
cussion
P
a
per
|
Discussion
P
a
per
|
Discussio
n
P
a
per
|
latitude sites. Cook and Roscoe (2009) inferred trends in stratospheric NO2from mea-surements obtained during the 1990–2007 period from a zenith-sky UV-visible spec-trometer in the Antarctic. The NO2trend strongly depends on the period, with a positive trend of ∼10 %/decade from 1990 to 2000, a negative trend of ∼20 %/decade from 2000 to 2007, and no overall trend for the full time period. These studies show that 5
the trend in stratospheric NO2 has a complicated structure which does not always fol-low the evolution of its main source (N2O) and displays a strong dependence on the location and time period considered for the trend analysis.
Trends in stratospheric NO2 at the Jungfraujoch NDACC station in the Swiss Alps (46.5◦N, 8.0◦E) are quantified and interpreted below. Ground-based UV-visible 10
SAOZ (Syst `eme d’Analyse par Observation Z ´enithale) and Fourier Transform Infra-Red (FTIR) spectrometers have been operating continuously at this station since 1990 and 1985, respectively, providing more than two decades of measurements. A com-bination of stratospheric NO2columns retrieved from the ERS-2/GOME (1996–2003), ENVISAT/SCIAMACHY (2003–2009), and METOP-A/ GOME-2 (2007–2009) satellite 15
nadir instruments is also included in this study, permitting, for the first time, a thorough analysis of the long-term evolution of stratospheric NO2from three (two ground-based and one satellite) independent measurement techniques at this site. The paper is di-vided into 4 sections. Section 2 provides a description of the ground-based and satel-lite data sets. The consistency between the different data sets is investigated in Sect. 3 20
ACPD
12, 12357–12389, 2012Analysis of stratospheric NO2
trends above Jungfraujoch
F. Hendrick et al.
Title Page
Abstract Introduction
Conclusions References
Tables Figures
◭ ◮
◭ ◮
Back Close
Full Screen / Esc
Printer-friendly Version
Interactive Discussion
Discussion
P
a
per
|
Dis
cussion
P
a
per
|
Discussion
P
a
per
|
Discussio
n
P
a
per
|
2 Data sets
2.1 SAOZ observations
The SAOZ instrument is a broad-band (300–600 nm), medium resolution (∼1 nm) diode-array spectrometer that measures zenith scattered sunlight (Pommereau and Goutail, 1988). Between 1990 and 2009 two different versions of the SAOZ instrument 5
were used. The first (NMOS) described in Van Roozendael et al. (1994) is based on a Jobin-Yvon spectrometer (model CP200) coupled to a 512 diode Hamamatsu NMOS detector. In December 1998, the system was upgraded to a 1024 diode Hamamatsu detector. This second version (SAM) provides low sun spectra with a better resolution and a higher signal to noise ratio that the NMOS version.
10
Zenith radiance spectra are analyzed using the DOAS (Differential Optical Absorp-tion Spectroscopy) technique (Platt and Stutz, 2008). NO2 is retrieved in the 425– 490 nm wavelength range, taking into account the spectral signatures of NO2, O3, H2O, O4, and the filling-in of the solar Fraunhofer bands by the Ring effect (Grainger and Ring, 1962). The NO2 absorption cross-sections at 220 K are from Vandaele 15
et al. (1997). A third-order polynomial is used to fit the low frequency spectral structure due to molecular and Mie scattering.
NO2 vertical column densities are derived from vertical profiles retrieved by apply-ing a profilapply-ing technique to sunrise and sunset NO2 differential slant column densities (DSCDs) which are the direct product of the DOAS analysis. The profiling algorithm is 20
based on the Optimal Estimation Method (OEM; Rodgers, 2000) and is described in Hendrick et al. (2004). In brief, a profile⌢x is retrieved given an a priori profilexa, the measurementsy(here, twilight NO2DSCDs as a function of solar zenith angle (SZA)), their respective uncertainty covariance matrices (Saand Sε), and the matrixKof the
weighting functions. Since NO2 is an optically thin absorber, the OEM for the linear 25
case can be considered:
⌢
ACPD
12, 12357–12389, 2012Analysis of stratospheric NO2
trends above Jungfraujoch
F. Hendrick et al.
Title Page
Abstract Introduction
Conclusions References
Tables Figures
◭ ◮
◭ ◮
Back Close
Full Screen / Esc
Printer-friendly Version
Interactive Discussion
Discussion
P
a
per
|
Dis
cussion
P
a
per
|
Discussion
P
a
per
|
Discussio
n
P
a
per
|
withK=∂y
∂x andK
T
is the transpose ofK.
The weighting functions indicate the sensitivity of the measurements to a change in the vertical profile. The matrix K is determined by consecutively perturbing each layer of the a priori profile and recalculating the set of measurements using the so-called forward model which describes the physics of the measurements. Here, the 5
forward model consists of the stacked photochemical box model PSCBOX coupled to the radiative transfer model (RTM) UVSPEC/DISORT (see Hendrick et al., 2004, 2006 for further details about both models). The photochemical model, initialized daily with chemical and meteorological fields from the SLIMCAT 3-D-CTM (Chipperfield et al., 2006), is able to simulate the rapid variation of NO2 at twilight. The model also pro-10
vides a priori profiles to the profiling algorithm and is used to photochemically convert the retrieved profiles, which are representative of twilight conditions, to the mean SZA corresponding to the FTIR and satellite nadir observations. The DSCDs are analyzed using daily reference spectra and the effective residual amounts of NO2 in the ref-erence spectra are directly fitted by the profiling algorithm. Combining this with an a 15
priori tropospheric NO2 content close to zero leads to retrieved vertical profiles and corresponding vertical columns mainly representative of the stratosphere (Hendrick et al., 2004, 2008). Performing the DOAS analysis with daily reference spectra also minimizes the potential impact of any long-term degradation of the instrument on the NO2vertical column time series, which is important for calculating robust trends. NO2 20
profile retrievals are quality-checked based on the retrieval fit residual (RMS of the difference between measured SCDs and those calculated using the retrieved pro-files; see Hendrick et al., 2004). In practice, all retrievals with a residual larger than 3.5×10¹⁵molec cm−2are rejected. This method of selection excludes measurements contaminated by tropospheric NO2 which usually display short-term variability incon-25
ACPD
12, 12357–12389, 2012Analysis of stratospheric NO2
trends above Jungfraujoch
F. Hendrick et al.
Title Page
Abstract Introduction
Conclusions References
Tables Figures
◭ ◮
◭ ◮
Back Close
Full Screen / Esc
Printer-friendly Version
Interactive Discussion
Discussion
P
a
per
|
Dis
cussion
P
a
per
|
Discussion
P
a
per
|
Discussio
n
P
a
per
|
the total relative uncertainty on the retrieved stratospheric NO2 columns is about 8 % on average. High aerosol loading can also perturb UV-visible measurements by modi-fying the scattering geometry. During the period considered in this study (1990–2009), the Mount Pinatubo eruption in June 1991 injected large amounts of aerosols into the stratosphere. In the years immediately following this event (1991–1994), an extinc-5
tion profile corresponding to a volcanic aerosol loading was selected from the aerosol model of Shettle (1989) and included in the UVSPEC/DISORT RTM for the calculation of the weighting functions needed for the OEM-based profile retrieval. Before and after the 1991–1994 period, a background aerosol extinction profile was used. Sensitivity tests have shown that the use of an aerosol extinction profile corresponding to volcanic 10
conditions has an impact of up to 10 % on the retrieved stratospheric NO2 columns. Aerosol loading changes due to the Mount Pinatubo eruption are also implemented in the SLIMCAT model through the use of monthly zonal mean time series of surface sulfate area density created from different satellite data sets (more details are avail-able at http://homepages.see.leeds.ac.uk/∼lecmc/sparc/Forcings/SPARC Forcings 15
WMO2011.html).
2.2 Ground-based FTIR observations
In the early 1950s, M. Migeotte performed pioneering atmospheric infrared observa-tions at the Jungfraujoch. Since then, the University of Li `ege has operated state-of-the-art instruments at that site to record high-resolution spectra allowing production of 20
atlases of the solar spectrum and monitoring of the state of the Earth’s atmosphere (Zander et al., 2008 and references therein). This long-term commitment has allowed the collection of a unique observational data base in terms of quality, time extension and measurement density. FTIR high-resolution solar absorption spectra have been recorded regularly under clear-sky conditions since 1985 with a homemade instru-25
ACPD
12, 12357–12389, 2012Analysis of stratospheric NO2
trends above Jungfraujoch
F. Hendrick et al.
Title Page
Abstract Introduction
Conclusions References
Tables Figures
◭ ◮
◭ ◮
Back Close
Full Screen / Esc
Printer-friendly Version
Interactive Discussion
Discussion
P
a
per
|
Dis
cussion
P
a
per
|
Discussion
P
a
per
|
Discussio
n
P
a
per
|
For this study, all available observations since 1990 have been fitted with the V3.91 of the SFIT-2 algorithm, using pressure and temperature information provided by the National Centers for Environmental Prediction (NCEP, see http://www.ncep.noaa.gov) and assuming the HITRAN 2004 spectroscopic line parameter compilation, including the August 2006 updates (Rothmann et al., 2004, see also http://www.cfa.harvard. 5
edu/hitran). The SFIT-2 code also implements the OEM (Rodgers, 2000), enabling the derivation of the vertical distributions of most of the FTIR target gases (e.g., Pougatchev and Rinsland, 1995; Rinsland et al., 2003a). In the present case, two mi-crowindows ranging from 2914.6 to 2914.7 cm−1and from 2915 to 2915.11 cm−1have been fitted; a priori vertical profiles for fitted (H2O, CH4 and O3 scaled during the re-10
trieval process) and simulated interferences (e.g. H2CO) were based on predictions obtained with the version 5 of the WACCM model (Whole-Atmosphere Community Cli-mate Model, see Chang et al., 2008). For NO2, we used 12 monthly profiles based on the same PSCBOX/SLIMCAT modeled a priori profile data set as for the SAOZ profile retrieval (see Sect. 2.1). The forward model was characterized by a diagonal covari-15
ance of 40 % per km and, with extra-diagonal elements based on a Gaussian half-width for interlayer correlation of 4 km. Regarding the error budget, estimates reported in Ta-ble 2 of Rinsland et al. (2003a) remain valid (total random and systematic errors of 11 % and 36 %, respectively), although they can be considered as conservative.
2.3 Satellite nadir observations
20
GOME, SCIAMACHY, and GOME-2 stratospheric NO2 columns are retrieved using the KNMI/BIRA TEMIS NO2 algorithm (Boersma et al., 2004, 2007; Dirksen et al., 2011). For this study, we use versions TM4NO2A v1.04 for GOME and TM4NO2A v1.10 for SCIAMACHY and GOME-2, and the periods covered by the different instru-ments are 1995–2003, 2002–2009, and 2007–2009, respectively. The TEMIS algo-25
ACPD
12, 12357–12389, 2012Analysis of stratospheric NO2
trends above Jungfraujoch
F. Hendrick et al.
Title Page
Abstract Introduction
Conclusions References
Tables Figures
◭ ◮
◭ ◮
Back Close
Full Screen / Esc
Printer-friendly Version
Interactive Discussion
Discussion
P
a
per
|
Dis
cussion
P
a
per
|
Discussion
P
a
per
|
Discussio
n
P
a
per
|
The purpose of the assimilation is to regularly update the TM4 simulation with avail-able measurements such that the model simulation of the stratospheric NO2column is closely constrained by the satellite measurements. In step 1, the DOAS analysis is per-formed in the following wavelength ranges: 425–450 nm for GOME and GOME-2 and 426.5–451.5 nm for SCIAMACHY. Absorption by NO2, ozone, water vapor, the Ring 5
effect, and a third-order polynomial that describes the residual broadband features due to Rayleigh and Mie scattering are taken into account. The NO2 cross-sections set at 220 K from Vandaele et al. (1997) is used. A correction for the difference between 220 K and the effective temperature of NO2 along the light path is applied to the NO2 absorption cross-sections. The stratospheric NO2 vertical columns are calculated by 10
dividing the assimilated stratospheric slant columns by a simple geometrical airmass factor depending only on the SZA and viewing angle (Boersma et al., 2004). The esti-mated error on TEMIS stratospheric NO2columns is about 0.2–0.3×10
15
molec cm−2 (Boersma et al., 2004; Dirksen et al., 2011).
For this study, all pixels falling within a radius of 300 km around Jungfraujoch were 15
selected and no filtering based on the cloud fraction was applied.
3 Evaluation of data consistency
3.1 FTIR and SAOZ data set comparison
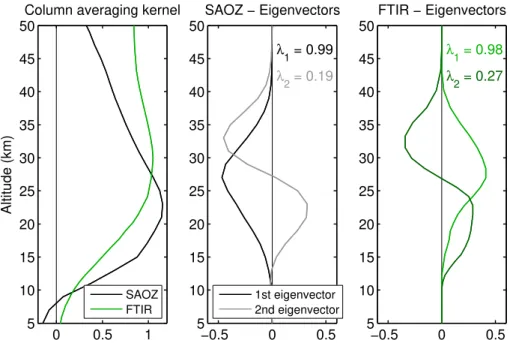
First, we have compared the information content associated with both FTIR and SAOZ profile retrievals. As can be seen in Fig. 1, column averaging kernels are very similar 20
for both techniques with no sensitivity to NO2in the troposphere and a maximum sen-sitivity between 20 and 35 km altitude where the NO2concentration in the stratosphere is the largest. Figure 1 also presents the eigenvector expansion of the averaging kernel matrixA corresponding to the two largest eigenvalues. The first eigenvalue, close to unity, implies an almost 100 % contribution of the measurements in this pattern (Hen-25
ACPD
12, 12357–12389, 2012Analysis of stratospheric NO2
trends above Jungfraujoch
F. Hendrick et al.
Title Page
Abstract Introduction
Conclusions References
Tables Figures
◭ ◮
◭ ◮
Back Close
Full Screen / Esc
Printer-friendly Version
Interactive Discussion
Discussion
P
a
per
|
Dis
cussion
P
a
per
|
Discussion
P
a
per
|
Discussio
n
P
a
per
|
to the NO2 vertical distribution is ∼13–40 km for both retrievals. The number of inde-pendent pieces of information, also called the degree of freedom for signal (DOFS), given by the trace of the matrixA(Rodgers, 2000), is about 1.2 in both cases. From this information content assessment, it can be concluded that both FTIR and SAOZ re-trievals have similar vertical resolution and sensitivity to the vertical distribution of NO2 5
and therefore retrieved NO2columns can be directly compared.
The consistency between ground-based FTIR and SAOZ data sets is evaluated by comparing the monthly mean stratospheric NO2 columns for the 1990–2009 period (see Fig. 2). To ensure photochemical matching, i.e. comparison in the same pho-tochemical conditions, the SAOZ profiles and corresponding columns, representative 10
of twilight conditions, are converted on a daily basis to the mean FTIR measurement SZA using the PSCBOX photochemical model of the SAOZ profiling algorithm forward model (see Sect. 2.1). FTIR and SAOZ data sets are in good agreement, with FTIR measurements lower than SAOZ by 7.8±8.2 % on average.
Combining the facts that both retrievals used similar a priori profiles and have similar 15
sensitivity to the vertical distribution of NO2, the remaining differences between FTIR and SAOZ NO2columns are consistent with the uncertainties affecting the respective spectroscopic parameters.
3.2 SAOZ and satellite nadir data set comparison
SAOZ and satellite nadir (GOME, SCIAMACHY, and GOME-2) monthly mean strato-20
spheric NO2 columns are compared in Fig. 3. The retrieved SAOZ columns are pho-tochemically converted to the satellite overpass SZA in order to perform compar-isons under the same photochemical conditions. A good agreement is obtained with mean satellite minus SAOZ relative differences of+0.9±8.8 % (GOME),+1.9±11.5 % (SCIAMACHY), and +2.3±11.6 % (GOME-2), i.e. not significant at the 1-sigma un-25
ACPD
12, 12357–12389, 2012Analysis of stratospheric NO2
trends above Jungfraujoch
F. Hendrick et al.
Title Page
Abstract Introduction
Conclusions References
Tables Figures
◭ ◮
◭ ◮
Back Close
Full Screen / Esc
Printer-friendly Version
Interactive Discussion
Discussion
P
a
per
|
Dis
cussion
P
a
per
|
Discussion
P
a
per
|
Discussio
n
P
a
per
|
2007 period, and a merging of the SCIAMACHY and GOME-2 data for the April 2007– December 2009 period, given the fact that the biases between both satellite data sets and SAOZ observations are similar.
4 Trend analysis
4.1 Statistical model description
5
To extract the linear trend in the stratospheric NO2vertical column time series, a linear least squares regression model is fitted to the data to account for any extraneous vari-ability that might affect the trend or its uncertainty. A modified version of the regression model developed by Bodeker et al. (1998) is used. It includes terms for offset, linear trend, quasi-biennial oscillation (QBO), solar activity, and aerosols effect, i.e.:
10
m(t)=A(NA=2)+
B(NB=2)×t+
C(NC=2)×QBO(t)+
D(ND=0)×Solar(t)+
E(NE =1)×Aerosols(t)+
15
Uδ (2)
wherem(t) is the statistically modeled monthly NO2vertical column at decimal yeart
andA–E are the model coefficients expanded as (for example):
A=A0+
NA
X
k=1
A2k−1sin(2πkt)+A2kcos(2πkt)
(3) 20
ACPD
12, 12357–12389, 2012Analysis of stratospheric NO2
trends above Jungfraujoch
F. Hendrick et al.
Title Page
Abstract Introduction
Conclusions References
Tables Figures
◭ ◮
◭ ◮
Back Close
Full Screen / Esc
Printer-friendly Version
Interactive Discussion
Discussion
P
a
per
|
Dis
cussion
P
a
per
|
Discussion
P
a
per
|
Discussio
n
P
a
per
|
from 1 to 0 in July 2003). A similar approach is applied to the SAOZ data set to account for any bias after April 1998 resulting from the installation of the new version of the SAOZ instrument.
The QBO basis function is based on the 30 and 50 hPa Singapore monthly mean zonal winds (http://www.geo.fu-berlin.de/met/ag/strat/produkte/qbo/index.html). Using 5
these two pressure levels separately allows a covering of the altitude range of the stratospheric NO2 profile and an automatic fitting of the phase of the QBO. For the solar cycle basis function, the radio-frequency F10.7 cm solar flux (ftp://ftp.ngdc.noaa. gov/STP/SOLAR DATA/SOLAR RADIO/FLUX) is used. The aerosols basis function is based on the stratospheric aerosol optical depth (AOD) climatology of Vernier et al. 10
(2011) created from SAGE II, CALIPSO, and ENVISAT/GOMOS observational data sets. The AOD time series corresponding to the 20◦N–50◦N latitude band was ex-tracted for this study. This climatology includes the large changes in aerosol loading related to the Mount Pinatubo eruption as well as smaller changes due to a series of moderate volcanic eruptions, primarily at tropical latitudes, causing an increase in the 15
stratospheric aerosol loading since 2002 (Vernier et al., 2011).
The standard deviationσB on a trendBcan be calculated using the standard
devia-tionσN of the fit residuals (differences between modelled and observed NO2columns) and their autocorrelation coefficient φ (Weatherhead et al., 1998; van der A et al., 2006):
20
σB=
σN
n3/2
s
1+φ
1−φ (4)
wherenis the length of the time series.
A test of the significance of the trendB can be computed as the ratio between the trend and its standard deviation:
tB=|B/σB| (5)
ACPD
12, 12357–12389, 2012Analysis of stratospheric NO2
trends above Jungfraujoch
F. Hendrick et al.
Title Page
Abstract Introduction
Conclusions References
Tables Figures
◭ ◮
◭ ◮
Back Close
Full Screen / Esc
Printer-friendly Version
Interactive Discussion
Discussion
P
a
per
|
Dis
cussion
P
a
per
|
Discussion
P
a
per
|
Discussio
n
P
a
per
|
A commonly applied decision rule for trend detection is that a trend is real at a 95 % confidence level whentB>2 (Weatherhead et al., 1998; Santer et al., 2000).
4.2 Results and discussion
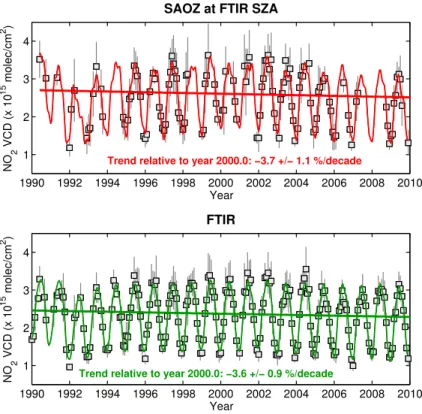
Figure 4 shows the regression fits to the SAOZ and FTIR monthly mean time series and the derived trends over the period 1990–2009. The SAOZ-based 5
trend (−3.7±1.1 %/decade; 1-sigma uncertainty) agrees with the FTIR-based trend (−3.6±0.9 %/decade). The contributions of the QBO, solar cycle, and aerosols basis functions to the signal are presented in Fig. 5. An examination of the regression fit coef-ficients and their respective standard deviations indicates that only the aerosols basis function makes a statistically significant contribution to the FTIR and SAOZ signals. 10
The fact that QBO and solar cycle do not contribute significantly is consistent with what Dirksen et al. (2011) found using OMI data at 50◦N. We find also that the contributions of the QBO and solar cycle basis functions are larger for the SAOZ time series than for the FTIR time series. Sensitivity tests show that this results from the greater number of gaps in the SAOZ data set. The above mentioned trend values are significant at the 15
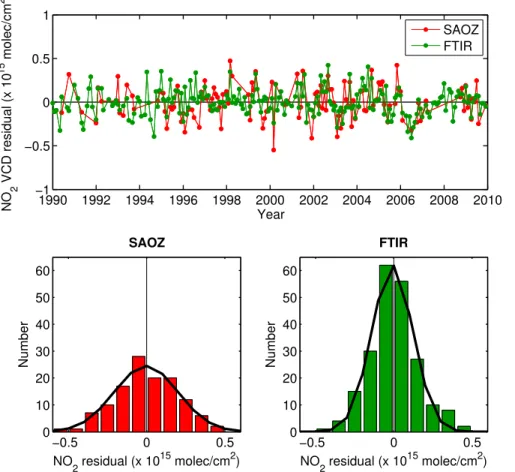
95 % confidence level. The uncertainty on the fit coefficients is based on the premise that the fit residuals are normally distributed. Figure 6 shows that this assumption is justified for both FTIR and SAOZ with fit residuals randomly scattered around zero and normally distributed.
A similar trend analysis is performed for the 1996–2009 period using ground-based 20
SAOZ, FTIR, and satellite nadir data sets (see Fig. 7). For SAOZ, the trend is esti-mated using two data sets corresponding to the twilight NO2 columns converted daily to the mean SZA of the FTIR and satellite nadir observations, respectively. Declines in NO2 are seen consistently across all data sets, viz.:−3.6±2.2 %/decade for satel-lites, −2.4±1.1 %/decade for SAOZ at satellite SZA, −4.3±1.4 %/decade for FTIR, 25
ACPD
12, 12357–12389, 2012Analysis of stratospheric NO2
trends above Jungfraujoch
F. Hendrick et al.
Title Page
Abstract Introduction
Conclusions References
Tables Figures
◭ ◮
◭ ◮
Back Close
Full Screen / Esc
Printer-friendly Version
Interactive Discussion
Discussion
P
a
per
|
Dis
cussion
P
a
per
|
Discussion
P
a
per
|
Discussio
n
P
a
per
|
functions indicates that none of these forcing mechanisms make a statistically signifi-cant contribution to the NO2time series measured by satellite, SAOZ, and FTIR for the 1996–2009 period.
All trend analysis results are summarized in Table 1. A good agreement is found be-tween SAOZ, FTIR, and satellite nadir observations with a decline in the stratospheric 5
NO2 column reaching 3 %/decade for both the 1990–2009 and 1996–2009 periods. This decrease is not consistent with the increase in N2 Oof about+2.5 %/decade re-ported globally (WMO, 2007) and in particular from FTIR observations at the Jungfrau-joch station (Angelbratt et al., 2011). Since in the NOy chemistry, N2O is the source of NOy and then NOy is subsequently partitioned into family members, opposite NO2 10
and N2 Otrends suggest a change in the NOy partitioning. In the second part of this Section, we discuss possible explanations for the observed decline of NO2related or not to a NOypartitioning change.
First, ClONO2 and HNO3, which are two major NOy species (Brohede et al., 2008) and important chlorine and hydrogen reservoirs in the stratosphere, can be useful in-15
dicators of the abundance of NO2. They are formed by the following termolecular reac-tions:
ClO+NO2+M→ClONO2+M (R2)
OH+NO2+M→HNO3+M (R3)
The main loss reactions for these species are photolysis, which releases NO2, as 20
well as reactions with OH (for HNO3) and dissociation on aerosols and ice particles (for ClONO2). HNO3 and ClONO2 have been measured routinely at the Jungfrau-joch station since the early 1980s using the FTIR technique (Rinsland et al., 2003b; Vigouroux et al., 2007; Wolffet al., 2008; Kohlhepp et al., 2011). This permits a trend analysis over the same time periods as was done for NO2. Trend values are derived 25
ACPD
12, 12357–12389, 2012Analysis of stratospheric NO2
trends above Jungfraujoch
F. Hendrick et al.
Title Page
Abstract Introduction
Conclusions References
Tables Figures
◭ ◮
◭ ◮
Back Close
Full Screen / Esc
Printer-friendly Version
Interactive Discussion
Discussion
P
a
per
|
Dis
cussion
P
a
per
|
Discussion
P
a
per
|
Discussio
n
P
a
per
|
for the 1990–2009 and 1996–2009 periods, respectively. The latter value is more neg-ative by about 3 %/decade with respect to the trend in total tropospheric chlorine of
−6.0±0.5 %/decade observed over the same 1996–2009 period (WMO, 2011a). In the light of Reaction (R2), this larger decline of ClONO2 is consistent with a decrease of stratospheric NO2of about 3 %/decade as observed since 1996 from SAOZ, FTIR, and 5
satellite nadir NO2 data sets, suggesting that NO2 could control the trend of ClONO2 together with total chlorine. Moreover, chlorine may also play an important role in the partitioning of NOx into NO and NO2through the following reaction (Crutzen, 1979):
ClO+NO→Cl+NO2 (R4)
Given (R4), if ClO would be decreasing, more NOxcould stay in the NO form. 10
For HNO3, positive trends of +1.0±0.8 %/decade and +1.9±1.2 %/decade are found for the 1990–2009 and 1996–2009 periods, respectively (see Fig. 8). Even if not statistically significant at the 95 % confidence level, this increase in HNO3 is not surprising and not necessarily inconsistent with the observed decline of NO2: HNO3 being the most abundant NOy species in terms of column, an increase of N2O should 15
result in a positive trend in NOy and therefore in HNO3.
As discussed in the introduction, ozone can also influence the abundance of NO2 in the stratosphere: a decrease in ozone leads to an increase in NO2 and vice versa through the (R1) reaction. We have inferred the trend in the ozone column at Jungfrau-joch by applying our least squares regression model to two total ozone column data 20
sets. The first one is based on measurements from the Dobson spectrophotometer instrument No. 101 operating at Arosa (46.8◦N, 9.7◦E), close to the Jungfraujoch sta-tion. The second data set combines satellite-based measurements from TOMS (To-tal Ozone Mapping Spectrometer), SBUV (Solar Backscattered Ultra-Violet), and OMI (Ozone Monitoring Instrument), and GOME instruments (Bodeker et al., 2005). A very 25
good consistency is obtained between Dobson and satellite trend values (see Fig. 8):
+0.6±0.6 %/decade (Dobson) and+0.3±0.6 %/decade (satellite) for 1990–2009 and
ACPD
12, 12357–12389, 2012Analysis of stratospheric NO2
trends above Jungfraujoch
F. Hendrick et al.
Title Page
Abstract Introduction
Conclusions References
Tables Figures
◭ ◮
◭ ◮
Back Close
Full Screen / Esc
Printer-friendly Version
Interactive Discussion
Discussion
P
a
per
|
Dis
cussion
P
a
per
|
Discussion
P
a
per
|
Discussio
n
P
a
per
|
trend of+0.6±0.9 %/decade estimated from FTIR observations at Jungfraujoch during the 1996–2009 period (Vigouroux et al., 2008; WMO, 2011b). Given the Reaction (R1), these slight increases in ozone could at least partly contribute to the observed negative trend in NO2, even if not statistically significant at the 95 % confidence level.
A change in the Dobson–Brewer circulation could also affect the evolution of strato-5
spheric NO2 (Fish et al., 2000). Cook and Roscoe (2009) recently reported a small, though not significant, increase in the stratospheric circulation of+1.4±3.5 %/decade derived from SAOZ NO2observations in Antarctic summer. A strengthening speed up of the Dobson-Brewer circulation would lead to less time in the stratosphere for the con-version of N2O to reactive nitrogen, resulting in a downwards trend of the NO2vertical 10
column.
Finally, Revell et al. (2012) recently investigated the links between N2O and NOx con-centrations using chemistry-climate model simulations in order to study the past and future effectiveness of N2O in depleting stratospheric ozone. Their findings are consis-tent with our observations at Jungfraujoch: they showed that the NO2/NO partitioning is 15
currently changing with time to favor NO, due to stratospheric cooling, which slows the NO+O3→NO2+O2 reaction, and decreasing ClO concentrations, which slows the NO+ClO→NO2+Cl reaction. It should be noted that a stratospheric cooling can also decrease the amount of NOyin the stratosphere from N2O (Rosenfield and Douglass, 1998).
20
5 Summary and conclusions
We have presented consolidated time series of stratospheric NO2 vertical columns at the NDACC station of Jungfraujoch retrieved from ground-based FTIR and SAOZ observations as well as from GOME, SCIAMACHY, and GOME-2 satellite nadir mea-surements. The time period covered by the FTIR and SAOZ observations is 1990–2009 25
ACPD
12, 12357–12389, 2012Analysis of stratospheric NO2
trends above Jungfraujoch
F. Hendrick et al.
Title Page
Abstract Introduction
Conclusions References
Tables Figures
◭ ◮
◭ ◮
Back Close
Full Screen / Esc
Printer-friendly Version
Interactive Discussion
Discussion
P
a
per
|
Dis
cussion
P
a
per
|
Discussion
P
a
per
|
Discussio
n
P
a
per
|
of FTIR and SAOZ NO2 columns on one hand, and the comparison between satel-lite nadir and SAOZ observations on the other hand. FTIR NO2 columns agree well with SAOZ columns with a bias of−7.8±8.2 % on average over the 1990–2009 pe-riod. A good agreement is also found between satellite nadir and SAOZ data sets with mean relative differences of+0.9±8.8 % (GOME),+1.9±11.5 % (SCIAMACHY), and 5
+2.3±11.6 % (GOME-2). It should be noted that it is the first time that stratospheric NO2products from these satellite nadir instruments are validated for such an extended period.
The trend of the stratospheric NO2column has been estimated by applying a least squares regression model to the different ground-based and satellite data sets. For the 10
analysis of trends in satellite observations, a composite data set covering the period 1996–2009 was constructed based on the comparison between the satellite and SAOZ measurements. A good consistency is found between the trends based on satellite and SAOZ measurements i.e. −3.6±2.2 %/decade for satellite and −2.4±1.1 %/decade for SAOZ. Similar trend values are obtained for the 1990–2009 period using SAOZ and 15
FTIR observations (−3.7±1.1 %/decade and−3.6±0.9 %/decade, respectively). This decline of stratospheric NO2 of about 3 %/decade, obtained from three independent measurement techniques, provides further evidence that, at least for northern mid-latitudes, the trend in stratospheric NO2 does not necessarily reflect the evolution of N2O, considered as the main source of NOxin the stratosphere. The most reasonable 20
explanation for this feature is a change in the NOx partitioning in favor of NO, due to possible stratospheric cooling (not investigated here) and the decline of chlorine con-tent in the stratosphere, the latter being further confirmed by the observed decrease in ClONO2at the Jungfraujoch station. Since previous studies have shown that ozone can affect significantly the trend in NO2, we have derived the trend of this species at 25
ACPD
12, 12357–12389, 2012Analysis of stratospheric NO2
trends above Jungfraujoch
F. Hendrick et al.
Title Page
Abstract Introduction
Conclusions References
Tables Figures
◭ ◮
◭ ◮
Back Close
Full Screen / Esc
Printer-friendly Version
Interactive Discussion
Discussion
P
a
per
|
Dis
cussion
P
a
per
|
Discussion
P
a
per
|
Discussio
n
P
a
per
|
contribute to the negative trend in stratospheric NO2. A strengthening of the Brewer-Dobson circulation would allow less time in the stratosphere for the conversion of N2O into reactive nitrogen, and therefore would lead to a decrease in stratospheric NO2.
Similar trend analyses are needed at other locations using FTIR, UV-visible, and satellite observations to augment the interpretation of our findings by improving the 5
statistics of such a trend study. This also suggests that more effort should be put into consolidating the different ground-based and satellite observational data sets, which is one of the major tasks of the NDACC.
Acknowledgements. This research was financially supported at IASB-BIRA by the Belgian
Fed-eral Science Policy Office, Brussels (PRODEX contract A3C) and by the EU 7th Framework
10
Programme projects SHIVA (contract 226224) and NORS (contract 284421). The University of
Li `ege contribution was primarily supported by the Belgian Federal Science Policy Office,
Brus-sels, through the SECPEA, A3C and AGACC-II projects. Emmanuel Mahieu is Research Asso-ciate with the F.R.S. – FNRS. We further acknowledge the contributions of the F.R.S. – FNRS and of the F ´ed ´eration Wallonie-Bruxelles for funding the development of the Jungfraujoch
lab-15
oratory and for supporting travel costs to the station, respectively. We thank the International Foundation High Altitude Research Stations Jungfraujoch and Gornergrat (HFSJG, Bern) for supporting the facilities needed to perform the observations. We are grateful to the many Bel-gian colleagues who have performed the FTIR observations used here. Work at the Eindhoven University of Technology was funded by the Netherlands Organisation for Scientific Research,
20
NOW Vidi grant 864.09.001. GOME-2 level-1 data are provided by EUMETSAT. The SLIMCAT modeling was supported by the EU GEOmon project and NERC.
References
Angelbratt, J., Mellqvist, J., Blumenstock, T., Borsdorff, T., Brohede, S., Duchatelet, P.,
Forster, F., Hase, F., Mahieu, E., Murtagh, D., Petersen, A. K., Schneider, M., Sussmann, R.,
25
and Urban, J.: A new method to detect long term trends of methane (CH4) and nitrous oxide
(N2O) total columns measured within the NDACC ground-based high resolution solar FTIR
ACPD
12, 12357–12389, 2012Analysis of stratospheric NO2
trends above Jungfraujoch
F. Hendrick et al.
Title Page
Abstract Introduction
Conclusions References
Tables Figures
◭ ◮
◭ ◮
Back Close
Full Screen / Esc
Printer-friendly Version
Interactive Discussion
Discussion
P
a
per
|
Dis
cussion
P
a
per
|
Discussion
P
a
per
|
Discussio
n
P
a
per
|
Bodeker, G. E., Boyd, I. S., and Matthews, W. A.: Trends and variability in vertical ozone and temperature profiles measured by ozonesondes at Lauder, New Zealand: 1986–1996, J. Geophys. Res., 103, 28661–28681, 1998.
Bodeker, G. E., Shiona, H., and Eskes, H.: Indicators of Antarctic ozone depletion, Atmos. Chem. Phys., 5, 2603–2615, doi:10.5194/acp-5-2603-2005, 2005.
5
Boersma, K. F., Eskes, H. J., and Brinksma, E. J.: Error analysis for tropospheric NO2retrieval
from space, J. Geophys. Res., 109, D04311, doi:10.1029/2003JD003962, 2004.
Boersma, K. F., Eskes, H. J., Veefkind, J. P., Brinksma, E. J., van der A, R. J., Sneep, M., van den Oord, G. H. J., Levelt, P. F., Stammes, P., Gleason, J. F., and Bucsela, E. J.:
Near-real time retrieval of tropospheric NO2from OMI, Atmos. Chem. Phys., 7, 2103–2118,
10
doi:10.5194/acp-7-2103-2007, 2007.
Brohede, S., McLinden, C. A., Urban, J., Haley, C. S., Jonsson, A. I., and Murtagh, D.: Odin
stratospheric proxy NOy measurements and climatology, Atmos. Chem. Phys., 8, 5731–
5754, doi:10.5194/acp-8-5731-2008, 2008.
Chang, L., Palo, S., Hagan, M., Richter, J., Garcia, R., Riggin, D., and Frittz, D.: Structure of the
15
migrating diurnal tide in the whole atmosphere community climate model, Adv. Space Res., 41, 1398–1407, 2008.
Chipperfield, M. P.: New version of the TOMCAT/SLIMCAT off-line chemical transport model:
intercomparison of stratospheric tracer experiments, Q. J. Roy. Meteor. Soc., 132, 1179– 1203, doi:10.1256/qj.05.51, 2006.
20
Cook, P. A. and Roscoe, H. K.: Variability and trends in stratospheric NO2in Antarctic summer,
and implications for stratospheric NOy, Atmos. Chem. Phys., 9, 3601–3612,
doi:10.5194/acp-9-3601-2009, 2009.
Crutzen, P. J.: The role of NO and NO2in the chemistry of the troposphere and stratosphere,
Annual Review of Earth and Planetary Sciences, vol. 7 (A79-37176 15-42), Annual Reviews,
25
Inc., Palo Alto, California, 443–472, 1979.
Dirksen, R. J., Boersma, K. F., Eskes, H. J., Ionov, D. V., Bucsela, E. J., Levelt, P. F., and
Kelder, H. M.: Evaluation of stratospheric NO2 retrieved from the ozone monitoring
in-strument: intercomparison, diurnal cycle, and trending, J. Geophys. Res., 116, D08305, doi:10.129/2010JD014943, 2011.
30
Fish, D. J., Roscoe, H. K., and Johnston, P. V.: Possible causes of stratospheric NO2 trend
ACPD
12, 12357–12389, 2012Analysis of stratospheric NO2
trends above Jungfraujoch
F. Hendrick et al.
Title Page
Abstract Introduction
Conclusions References
Tables Figures
◭ ◮
◭ ◮
Back Close
Full Screen / Esc
Printer-friendly Version
Interactive Discussion
Discussion
P
a
per
|
Dis
cussion
P
a
per
|
Discussion
P
a
per
|
Discussio
n
P
a
per
|
Gruzdev, A. N.: Latitudinal structure of variations and trends in stratospheric NO2, Int. J. Remote
Sens., 30 (15), 4227–4246, 2009.
Hendrick, F., Barret, B., Van Roozendael, M., Boesch, H., Butz, A., De Mazi `ere, M., Goutail, F., Hermans, C., Lambert, J.-C., Pfeilsticker, K., and Pommereau, J.-P.: Retrieval of nitrogen dioxide stratospheric profiles from ground-based zenith-sky UV-visible observations:
valida-5
tion of the technique through correlative comparisons, Atmos. Chem. Phys., 4, 2091–2106, doi:10.5194/acp-4-2091-2004, 2004.
Hendrick, F., Van Roozendael, M., Kylling, A., Petritoli, A., Rozanov, A., Sanghavi, S., Schofield, R., von Friedeburg, C., Wagner, T., Wittrock, F., Fonteyn, D., and De Mazi `ere, M.:
Intercomparison exercise between different radiative transfer models used for the
interpreta-10
tion of ground-based zenith-sky and multi-axis DOAS observations, Atmos. Chem. Phys., 6, 93–108, doi:10.5194/acp-6-93-2006, 2006.
Hendrick, F., Johnston, P. V., Kreher, K., Hermans, C., De Mazi `ere, M., and Van Roozendael, M.:
One decade trend analysis of stratospheric BrO over Harestua (60◦N) and Lauder (44◦S)
reveals a decline, Geophys. Res. Lett., 35, L14801, doi:10.1029/2008GL034154, 2008.
15
Kohlhepp, R., Ruhnke, R., Chipperfield, M. P., De Mazi `ere, M., Notholt, J., Barthlott, S.,
Batche-lor, R. L., Blatherwick, R. D., Blumenstock, Th., Coffey, M. T., Demoulin, P., Fast, H., Feng, W.,
Goldman, A., Griffith, D. W. T., Hamann, K., Hannigan, J. W., Hase, F., Jones, N. B.,
Ka-gawa, A., Kaiser, I., Kasai, Y., Kirner, O., Kouker, W., Lindenmaier, R., Mahieu, E., Mitter-meier, R. L., Monge-Sanz, B., Morino, I., Murata, I., Nakajima, H., Palm, M., Paton-Walsh, C.,
20
Raffalski, U., Reddmann, Th., Rettinger, M., Rinsland, C. P., Rozanov, E., Schneider, M.,
Senten, C., Servais, C., Sinnhuber, B.-M., Smale, D., Strong, K., Sussmann, R., Taylor, J. R., Vanhaelewyn, G., Warneke, T., Whaley, C., Wiehle, M., and Wood, S. W.: Observed and
simulated time evolution of HCl, ClONO2, and HF total column abundances, Atmos. Chem.
Phys., 12, 3527–3556, doi:10.5194/acp-12-3527-2012, 2012.
25
Liley, J. B., Johnston, P. V., McKenzie, R. L., Thomas, A. J., and Boyd, I. S.: Stratospheric NO2
variations from a long time series at Lauder, New Zealand, J. Geophys. Res., 105, 11633– 11640, 2000.
McLinden, C. A., Olsen, S. C., and Prather, M. J.: Understanding trends in stratospheric NOy
and NO2, J. Geophys. Res., 106, 27787–27793, 2001.
30
Platt, U. and Stuz, J.: Differential Optical Absorption Spectroscopy (DOAS), Principles and
ACPD
12, 12357–12389, 2012Analysis of stratospheric NO2
trends above Jungfraujoch
F. Hendrick et al.
Title Page
Abstract Introduction
Conclusions References
Tables Figures
◭ ◮
◭ ◮
Back Close
Full Screen / Esc
Printer-friendly Version
Interactive Discussion
Discussion
P
a
per
|
Dis
cussion
P
a
per
|
Discussion
P
a
per
|
Discussio
n
P
a
per
|
Pommereau, J.-P. and Goutail, F.: O3 and NO2 ground-based measurements by visible
spec-trometry during arctic winter and spring 1988, Geophys. Res. Lett., 15, 891–894, 1988. Pougatchev, N. S. and Rinsland, C. P.: Spectroscopic study of the seasonal variation of carbon
monoxide vertical distribution above Kitt Peak, J. Geophys. Res., 100, 1409–1416, 1995. Revell, L. E., Bodeker, G. E., Smale, D., Lehmann, R., Huck, P. E., Williamson, B. E.,
5
Rozanov, E., and Struthers, H.: The effectiveness of N2O in depleting stratospheric ozone,
Geophys. Res. Lett., submitted, 2012.
Rinsland, C. P., Weisenstein, D. K., Ko, M. K. W., Scott, C. J., Chiou, L. S., Mahieu, E., Zan-der, R., and Demoulin, P.: Post Mount Pinatubo eruption ground-based stratospheric column
measurements of HNO3, NO, and NO2and their comparison with model calculation, J.
Geo-10
phys. Res., 108, 4437, ACL1, doi:10.1029/2002JD002965, 2003a.
Rinsland, C. P., Mahieu, E., Zander, R., Jones, N. B., Chipperfield, M. P., Goldman, A., Ander-son, J., Russell III, J. M., Demoulin, P., Notholt, J., Toon, G. C., Blavier, J.-F., Sen, B.,
Suss-mann, R., Wood, S. W., Meier, A., Griffith, D. W. T., Chiou, L. S., Murcray, F. J., Stephen, T. M.,
Hase, F., Mikuteit, S., Schulz, A., and Blumenstock, T.: Long-term trends of inorganic
chlo-15
rine from ground-based infrared solar spectra: past increases and evidence for stabilization, J. Geophys. Res., 108, 4252, ACH10, doi:10.1029/2002JD003001, 2003b.
Rosenfield, J. E. and Douglass, A. R.: Doubled CO2 effects on NOy in a coupled 2-D model,
Geophys. Res. Lett., 25, 4381–4384, 1998.
Rothman, L. S., Jacquemart, D., Barbe, A., Chris Benner, D. Birk, M., Brown, L. R., Carleer, M.
20
R., Chackerian Jr., C., Chance, K., Coudert, L. H., Dana, V., Devi, V. M., Gamache, R. R., Goldman, A., Jucks, K. W., Maki, A. G., Massie, S. T., Orphal, J., Perrin, A., Rinsland, C. P., Smith, M. A. H., Tennyson, J., Tolchenov, Toth, R. A., Vander Auwera, J., Varanasi, P., and Wagner, G.: The HITRAN 2004 molecular spectroscopic database, J. Quant. Spectrosc. Ra., 96, 139–204, 2005.
25
Santer, B. D., Wigley, T. M. L., Boyle, J. S., Gaffen, D. J., Hnilo, J. J., Nychka, D., Parker, D. E.,
and Taylor, K. E.: Statistical significance of trends and trend differences in layer-average
atmospheric temperature time series, J. Geophys. Res., 105, 7337–7356, 2000.
Shettle, E. P.: Models of aerosols, clouds, and precipitation for atmospheric propagation stud-ies, in: NATO AGARD Conference Proceedings No. 454: atmospheric propagation in the UV,
30
ACPD
12, 12357–12389, 2012Analysis of stratospheric NO2
trends above Jungfraujoch
F. Hendrick et al.
Title Page
Abstract Introduction
Conclusions References
Tables Figures
◭ ◮
◭ ◮
Back Close
Full Screen / Esc
Printer-friendly Version
Interactive Discussion
Discussion
P
a
per
|
Dis
cussion
P
a
per
|
Discussion
P
a
per
|
Discussio
n
P
a
per
|
Solomon, S.: Stratospheric ozone depletion: a review of concepts and history, Rev. Geophys., 37, 275–316, 1999.
Vandaele, A. C., Hermans, C., Simon, P. C., Carleer, M., Colin, R., Fally, S., M ´erienne, M.-F.,
Jenouvrier, A., and Coquart, B.: Measurements of the NO2 absorption cross section from
42000 cm−1to 10000 cm−1(238–1000 nm) at 220 K and 294 K, J. Quant. Spectrosc. Ra., 59,
5
171–184, 1997.
van der A, R. J., Peters, D. H. M. U., Heskes, H., Boersma, K. F., Van Roozendael, M., De
Smedt, I., and Kelder, H.: Detection of the trend and seasonal variation in tropospheric NO2
over China, J. Geophys. Res., 111, D12317, doi:10.1029/2005JD006594, 2006.
Van Roozendael, M., De Mazi `ere, M., and Simon, P. C.: Ground-based visible measurements
10
at the Jungfraujoch station since 1990, J. Quant. Spectrosc. Ra., 52, 231–240, 1994. Vernier, J.-P., Thomason, L. W., Pommereau, J.-P., Bourassa, A., Pelon, J., Garnier, A.,
Hauchecorne, A., Blanot, L., Trepte, C., Degenstein, D., and Vargas, F.: Major influence of tropical volcanic eruptions on the stratospheric aerosol layer during the last decade, Geo-phys. Res. Lett., 38, L12807, doi:10.129/2011GL047563, 2011.
15
Vigouroux, C., De Mazi `ere, M., Errera, Q., Chabrillat, S., Mahieu, E., Duchatelet, P., Wood, S., Smale, D., Mikuteit, S., Blumenstock, T., Hase, F., and Jones, N.: Comparisons between
ground-based FTIR and MIPAS N2O and HNO3profiles before and after assimilation in
BAS-COE, Atmos. Chem. Phys., 7, 377–396, doi:10.5194/acp-7-377-2007, 2007.
Vigouroux, C., De Mazi `ere, M., Demoulin, P., Servais, C., Hase, F., Blumenstock, T., Kramer, I.,
20
Schneider, M., Mellqvist, J., Strandberg, A., Velazco, V., Notholt, J., Sussmann, R., Stremme, W., Rockmann, A., Gardiner, T., Coleman, M., and Woods, P.: Evaluation of tro-pospheric and stratospheric ozone trends over Western Europe from ground-based FTIR network observations, Atmos. Chem. Phys., 8, 6865–6886, doi:10.5194/acp-8-6865-2008, 2008.
25
Weatherhead, E. C., Reinsel, G. C., Tiao, G. C., Meng, X., Choi, D., Cheang, W., Keller, T., DeLuisi, J., Wuebbles, D. J., Kerr, J. B., Miller, A. J., Oltmans, S. J., and Frederick, J. E.:
Factors affecting the detection of trends: statistical considerations and applications to
envi-ronmental data, J. Geophys. Res., 103, 17149–17161, 1998.
WMO (World Meteorological Organization): Scientific Assessment of Ozone depletion: 2006
30
ACPD
12, 12357–12389, 2012Analysis of stratospheric NO2
trends above Jungfraujoch
F. Hendrick et al.
Title Page
Abstract Introduction
Conclusions References
Tables Figures
◭ ◮
◭ ◮
Back Close
Full Screen / Esc
Printer-friendly Version
Interactive Discussion
Discussion
P
a
per
|
Dis
cussion
P
a
per
|
Discussion
P
a
per
|
Discussio
n
P
a
per
|
WMO (World Meteorological Organization): Scientific Assessment of Ozone depletion: 2010 (chapt. 1), Global Ozone Research and Monitoring Project, Report 52, World Meteorological Organization, Geneva, Switzerland, 2011a.
WMO (World Meteorological Organization): Scientific Assessment of Ozone depletion: 2010 (chapt. 2), Global Ozone Research and Monitoring Project, Report 52, World Meteorological
5
Organization, Geneva, Switzerland, 2011b.
Wolff, M. A., Kerzenmacher, T., Strong, K., Walker, K. A., Toohey, M., Dupuy, E., Bernath, P. F.,
Boone, C. D., Brohede, S., Catoire, V., von Clarmann, T., Coffey, M., Daffer, W. H.,
De Mazi `ere, M., Duchatelet, P., Glatthor, N., Griffith, D. W. T., Hannigan, J., Hase, F.,
H ¨opfner, M., Huret, N., Jones, N., Jucks, K., Kagawa, A., Kasai, Y., Kramer, I., K ¨ullmann, H.,
10
Kuttippurath, J., Mahieu, E., Manney, G., McElroy, C. T., McLinden, C., M ´ebarki, Y., Mikuteit, S., Murtagh, D., Piccolo, C., Raspollini, P., Ridolfi, M., Ruhnke, R., Santee, M.,
Sen-ten, C., Smale, D., T ´etard, C., Urban, J., and Wood, S.: Validation of HNO3, ClONO2, and
N2O5 from the Atmospheric Chemistry Experiment Fourier Transform Spectrometer
(ACE-FTS), Atmos. Chem. Phys., 8, 3529–3562, doi:10.5194/acp-8-3529-2008, 2008.
15
ACPD
12, 12357–12389, 2012Analysis of stratospheric NO2
trends above Jungfraujoch
F. Hendrick et al.
Title Page
Abstract Introduction
Conclusions References
Tables Figures
◭ ◮
◭ ◮
Back Close
Full Screen / Esc
Printer-friendly Version
Interactive Discussion
Discussion
P
a
per
|
Dis
cussion
P
a
per
|
Discussion
P
a
per
|
Discussio
n
P
a
per
|
Table 1.Trend values in %/decade derived from FTIR, SAOZ, and satellite NO2 column data
sets for the 1990–2009 and 1996–2009 periods.
1990–2009 ( %/decade) 1996–2009 ( %/decade)
FTIR −3.6±0.9 −4.3±1.4
SAOZ at FTIR SZA −3.7±1.1 −2.7±1.2
Satellites − −3.6±2.2
ACPD
12, 12357–12389, 2012Analysis of stratospheric NO2
trends above Jungfraujoch
F. Hendrick et al.
Title Page
Abstract Introduction
Conclusions References
Tables Figures
◭ ◮
◭ ◮
Back Close
Full Screen / Esc
Printer-friendly Version
Interactive Discussion
Discussion
P
a
per
|
Dis
cussion
P
a
per
|
Discussion
P
a
per
|
Discussio
n
P
a
per
|
−0.5 0 0.5
5 10 15 20 25 30 35 40 45 50
SAOZ − Eigenvectors
λ
1 = 0.99
λ 2 = 0.19
1st eigenvector 2nd eigenvector
−0.5 0 0.5
5 10 15 20 25 30 35 40 45 50
λ 1 = 0.98 λ
2 = 0.27
FTIR − Eigenvectors
0 0.5 1
5 10 15 20 25 30 35 40 45 50
Altitude (km)
Column averaging kernel
SAOZ FTIR
Fig. 1.Typical FTIR and SAOZ column averaging kernels (left plot) and leading eigenvectors
ACPD
12, 12357–12389, 2012Analysis of stratospheric NO2
trends above Jungfraujoch
F. Hendrick et al.
Title Page
Abstract Introduction
Conclusions References
Tables Figures
◭ ◮
◭ ◮
Back Close
Full Screen / Esc
Printer-friendly Version
Interactive Discussion
Discussion
P
a
per
|
Dis
cussion
P
a
per
|
Discussion
P
a
per
|
Discussio
n
P
a
per
|
1990 1992 1994 1996 1998 2000 2002 2004 2006 2008 2010
1 2 3 4 5
Year
NO
2
VCD (x10
15
molec/cm
2 ) SAOZ
FTIR
1990 1992 1994 1996 1998 2000 2002 2004 2006 2008 2010
−40 −30 −20 −10 0 10 20 30
Year
Relative difference (%)
FTIR − SAOZ
Fig. 2. Comparison between FTIR and SAOZ monthly mean stratospheric NO2 columns at
Jungfraujoch (46.5◦N, 8◦E) for the 1990–2009 period. The error bars correspond to the
1-sigma standard deviation (natural variability). The relative differences appear on the lower plot
with solid and dashed green lines corresponding to the mean FTIR – SAOZ difference and its
ACPD
12, 12357–12389, 2012Analysis of stratospheric NO2
trends above Jungfraujoch
F. Hendrick et al.
Title Page
Abstract Introduction
Conclusions References
Tables Figures
◭ ◮
◭ ◮
Back Close
Full Screen / Esc
Printer-friendly Version
Interactive Discussion
Discussion
P
a
per
|
Dis
cussion
P
a
per
|
Discussion
P
a
per
|
Discussio
n
P
a
per
|
1996 1998 2000 2002 2004 2006 2008 2010
1 2 3 4 5
Year
NO
2
VCD (x10
15 molec/cm
2 ) SAOZ
GOME SCIAMACHY GOME−2
1996 1998 2000 2002 2004 2006 2008 2010
−40 −20 0 20
Year
Relative difference (%) GOME − SAOZSCIAMACHY − SAOZ
GOME−2 − SAOZ
Fig. 3.Comparison between SAOZ and satellite nadir (GOME, SCIAMACHY, and GOME-2)
monthly mean stratospheric NO2 columns at Jungfraujoch (46.5◦N, 8◦E) for the 1996–2009
period. The error bars correspond to the 1-sigma standard deviation (natural variability). The
relative differences appear on the lower plot with solid and dashed colored lines corresponding
to the mean satellite – SAOZ differences and their one-sigma standard deviation, respectively,
ACPD
12, 12357–12389, 2012Analysis of stratospheric NO2
trends above Jungfraujoch
F. Hendrick et al.
Title Page
Abstract Introduction
Conclusions References
Tables Figures
◭ ◮
◭ ◮
Back Close
Full Screen / Esc
Printer-friendly Version
Interactive Discussion
Discussion
P
a
per
|
Dis
cussion
P
a
per
|
Discussion
P
a
per
|
Discussio
n
P
a
per
|
1990 1992 1994 1996 1998 2000 2002 2004 2006 2008 2010 1
2 3 4
Year
NO
2
VCD (x 10
15 molec/cm 2 )
SAOZ at FTIR SZA
Trend relative to year 2000.0: −3.7 +/− 1.1 %/decade
1990 1992 1994 1996 1998 2000 2002 2004 2006 2008 2010 1
2 3 4
Year
NO
2
VCD (x 10
15
molec/cm
2 )
FTIR
Trend relative to year 2000.0: −3.6 +/− 0.9 %/decade
Fig. 4.Results of the trend analysis over the 1990–2009 period using the ground-based
UV-visible SAOZ and FTIR monthly mean NO2 vertical column densities (VCD; grey squares).
Twilight SAOZ columns are photochemically converted to the mean SZA of the FTIR
mea-surements. Colored lines correspond to the linear trend (thick line) and to the NO2 columns
ACPD
12, 12357–12389, 2012Analysis of stratospheric NO2
trends above Jungfraujoch
F. Hendrick et al.
Title Page
Abstract Introduction
Conclusions References
Tables Figures
◭ ◮
◭ ◮
Back Close
Full Screen / Esc
Printer-friendly Version
Interactive Discussion
Discussion
P
a
per
|
Dis
cussion
P
a
per
|
Discussion
P
a
per
|
Discussio
n
P
a
per
|
1990 1992 1994 1996 1998 2000 2002 2004 2006 2008 2010
−1 −0.5 0
30 hPa QBO + 50 hPa QBO
FTIR SAOZ
1990 1992 1994 1996 1998 2000 2002 2004 2006 2008 2010
−1 −0.5 0
NO
2
VCD (x 10
15 molec/cm
2 )
Solar cycle
FTIR SAOZ
1990 1992 1994 1996 1998 2000 2002 2004 2006 2008 2010
−1 −0.5 0
Year
Aerosols
FTIR SAOZ
Fig. 5.Contributions of the QBO (upper plot), solar cycle (middle plot), and aerosols (lower
ACPD
12, 12357–12389, 2012Analysis of stratospheric NO2
trends above Jungfraujoch
F. Hendrick et al.
Title Page
Abstract Introduction
Conclusions References
Tables Figures
◭ ◮
◭ ◮
Back Close
Full Screen / Esc
Printer-friendly Version
Interactive Discussion
Discussion
P
a
per
|
Dis
cussion
P
a
per
|
Discussion
P
a
per
|
Discussio
n
P
a
per
|
1990 1992 1994 1996 1998 2000 2002 2004 2006 2008 2010
−1 −0.5 0 0.5 1
Year
NO
2
VCD residual (x 10
15 molec/cm
2 )
SAOZ FTIR
−0.5 0 0.5
0 10 20 30 40 50 60
NO
2 residual (x 10
15 molec/cm2)
Number
SAOZ
−0.5 0 0.5
0 10 20 30 40 50 60
NO
2 residual (x 10
15 molec/cm2)
Number
FTIR