ACPD
11, 19179–19212, 2011Estimation of NOx emissions from Delhi
R. Shaiganfar et al.
Title Page
Abstract Introduction
Conclusions References
Tables Figures
◭ ◮
◭ ◮
Back Close
Full Screen / Esc
Printer-friendly Version
Interactive Discussion
Discussion
P
a
per
|
Dis
cussion
P
a
per
|
Discussion
P
a
per
|
Discussio
n
P
a
per
Atmos. Chem. Phys. Discuss., 11, 19179–19212, 2011 www.atmos-chem-phys-discuss.net/11/19179/2011/ doi:10.5194/acpd-11-19179-2011
© Author(s) 2011. CC Attribution 3.0 License.
Atmospheric Chemistry and Physics Discussions
This discussion paper is/has been under review for the journal Atmospheric Chemistry and Physics (ACP). Please refer to the corresponding final paper in ACP if available.
Estimation of NO
x
emissions from Delhi
using car MAX-DOAS observations and
comparison with OMI satellite data
R. Shaiganfar1, S. Beirle1, M. Sharma2, A. Chauhan2, R. P. Singh2,3, and T. Wagner1
1
Max-Planck-Institute for Chemistry, Mainz, Germany
2
Research and Technology Development Centre, Sharda University, Greater Noida, India
3
School of Earth and Environmental Sciences, Schmid College of Science, Chapman University, Orange 92866, USA
Received: 20 April 2011 – Accepted: 30 June 2011 – Published: 5 July 2011
Correspondence to: R. Shaiganfar ([email protected])
ACPD
11, 19179–19212, 2011Estimation of NOx emissions from Delhi
R. Shaiganfar et al.
Title Page
Abstract Introduction
Conclusions References
Tables Figures
◭ ◮
◭ ◮
Back Close
Full Screen / Esc
Printer-friendly Version
Interactive Discussion
Discussion
P
a
per
|
Dis
cussion
P
a
per
|
Discussion
P
a
per
|
Discussio
n
P
a
per
|
Abstract
We present the first Multi-Axis- (MAX-) DOAS observations in India performed during April 2010 and January 2011 in Delhi and nearby regions. The MAX-DOAS instrument was mounted on a car roof, which allowed us to perform measurements along individual driving routes. From car MAX-DOAS observations along closed circles around Delhi, 5
together with information on wind speed and direction, the NOx emissions from the greater Delhi area were determined: our estimate of 3.7×1025molec s−1 is found to be slightly lower than the corresponding emission estimates using the EDGAR data base and substantially smaller compared to a recent study by Gurjar et al. (2004).
We have also used the MAX-DOAS observations of the tropospheric NO2 VCD for
10
validation of simultaneous satellite observations from the OMI instrument and found a good agreement of the spatial patterns. The absolute values show a reasonably good
agreement. However, OMI data tends to underestimate the tropospheric NO2 VCDs
in regions with high pollution levels, and tends to overestimate the tropospheric NO2 VCDs in more clean areas. These findings indicate possible discrepancies between 15
the true vertical NO2profiles and the profile assumptions in the OMI satellite retrieval.
1 Introduction
Delhi, home of 19 million people, second largest metropolitan city (http://www. indiaonlinepages.com/population/delhi-population.html) is located in the Indo-Gangetic plains in India. The growing population and human activities increase the atmospheric 20
ACPD
11, 19179–19212, 2011Estimation of NOx emissions from Delhi
R. Shaiganfar et al.
Title Page
Abstract Introduction
Conclusions References
Tables Figures
◭ ◮
◭ ◮
Back Close
Full Screen / Esc
Printer-friendly Version
Interactive Discussion
Discussion
P
a
per
|
Dis
cussion
P
a
per
|
Discussion
P
a
per
|
Discussio
n
P
a
per
In the last three decades the atmospheric trace gas and aerosol loading has in-creased in the Indo-Gangetic plains due to intense urbanization, anthropogenic activi-ties, industrial growth and energy demand. Especially in the northern part of India, the pollutants swing in the Indo-Gangetic basin depending upon the meteorological con-ditions. The sources of atmospheric pollutants are localized and heterogeneous and 5
depended on season (Gurjar et al., 2004; Goyal et al., 2006; Lal, 2007).
The measurements of atmospheric pollutants are not only important for air quality, but also to understand the radiative forcing and its impact on climate (Ravishankara et al., 2004; Seinfeld and Pandis, 2006). Currently, still large uncertainties exist with respect to the total emissions of pollutants and their impact on local, regional, and 10
possibly also global scale. The corresponding uncertainties are especially large for many Megacities.
In this study, we present top-down emission estimates for nitrogen oxides (NOx=NO+NO2) for Delhi from car MAX-DOAS observations. Nitrogen oxides are formed in combustion processes (e.g. from vehicles, and power plants); they are toxic 15
(Elsayed, 1994; World Health Organization, 2003) and also involved in important pho-tochemical processes. Together with the emissions of volatile organic compounds, they control tropospheric ozone chemistry and oxidising capacity (Jacob, 1999; Seinfeld and Pandis, 2006).
We use Multi-Axis-Differential Optical Absorption Spectroscopy (MAX-DOAS) mea-20
surements (H ¨onninger et al., 2002; Van Roozendael et al., 2004; Wittrock et al., 2004; Wagner et al., 2004; Brinksma et al., 2008 and references therein) to quantify the NOx emissions of Delhi. The MAX-DOAS instrument was mounted on a car roof, and con-tinuous measurements were performed on closed driving routes around the city center on three days during April 2010 and one day in January 2011. In combination with 25
wind data, the total emissions from the encircled area can be determined (Johansson et al., 2008, 2009; Rivera et al., 2009; Ibrahim et al., 2010; Wagner et al., 2010).
ACPD
11, 19179–19212, 2011Estimation of NOx emissions from Delhi
R. Shaiganfar et al.
Title Page
Abstract Introduction
Conclusions References
Tables Figures
◭ ◮
◭ ◮
Back Close
Full Screen / Esc
Printer-friendly Version
Interactive Discussion
Discussion
P
a
per
|
Dis
cussion
P
a
per
|
Discussion
P
a
per
|
Discussio
n
P
a
per
|
MAX-DOAS observations yield valuable information about the horizontal heterogeneity of the NO2distribution, which can not be resolved by the satellite observations, making them superior to validation with MAX-DOAS measurements at fixed locations.
The paper is organized as follows: in Sect. 2, we give details of the instrument, the measurement campaign and the retrieval of the tropospheric NO2 VCD. Section 3 5
presents the determination of the NOx emissions of Delhi and comparison with the
EDGAR emission inventory. In Sect. 4, the MAX-DOAS tropospheric NO2 VCDs are
compared to simultaneous satellite observations from the Ozone Monitoring Instrument (OMI).
2 2 MAX-DOAS observations and data analysis 10
2.1 Car MAX-DOAS instrument
The Mini-MAX-DOAS instrument is a fully automated, light weighted spectrometer (13 cm×19 cm×14 cm) designed for the spectral analysis of scattered sunlight (Bo-browski et al., 2003). It consists of a sealed aluminium box containing the entrance optics, a fibre coupled spectrograph and the controlling electronics. A stepper motor 15
mounted outside the box rotates the whole instrument to control the elevation of the viewing angle (angle between the horizontal and the viewing direction). The entrance optics consists of a quartz lens of focal lengthf =40 mm coupled to a quartz fibre bun-dle which leads the collected light into the spectrograph (field of view is ∼1.2◦). The light is dispersed by a crossed Czerny-Turner spectrometer (USB2000+, Ocean Op-20
ACPD
11, 19179–19212, 2011Estimation of NOx emissions from Delhi
R. Shaiganfar et al.
Title Page
Abstract Introduction
Conclusions References
Tables Figures
◭ ◮
◭ ◮
Back Close
Full Screen / Esc
Printer-friendly Version
Interactive Discussion
Discussion
P
a
per
|
Dis
cussion
P
a
per
|
Discussion
P
a
per
|
Discussio
n
P
a
per
2.2 Overview on measurements around Delhi
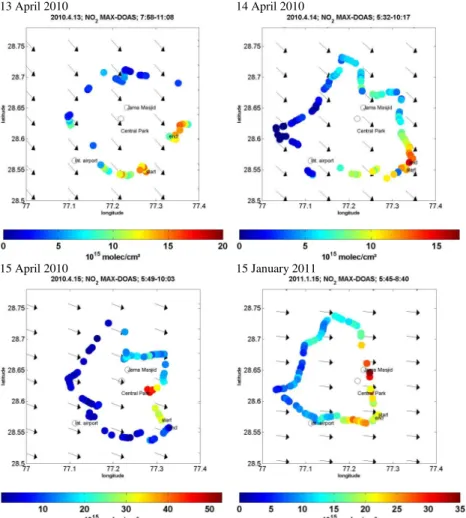
For the mobile observations measurements around Delhi, the Mini-MAX-DOAS instru-ment was mounted on the roof top of a car with the telescope pointing parallel to the driving direction, pointing backward (April 2010)/forward (January 2011). The mea-surements started from Greater Noida to Delhi and around Delhi; the routes are shown 5
in Fig. 1 for all the four days (13, 14, and 15 April 2010 and 15 January 2011).
The sequence of elevation angles was chosen to: 1×90◦, 5×22◦, 1×45◦, 5×22◦ and the duration of an individual measurement was about 60 s. For the measure-ments on 15 January 2011, an elevation angle of 30◦was set up instead of 22◦ during April 2010. The temperature setpoint of the mini MAX-DOAS was 15◦C in April and 10
5◦C in January. A handy GPS was used to track the coordinates of the route along which the observations were made.
All the three days in April 2010 were cloud-free, the aerosol optical depth derived from MODIS satellite was found in the range of 0.2–0.5 at 550 nm. The wind direction was mostly north-westerly, and the temperature was found in the range 35–45◦C. On 15
15 January 2011, the AOD was found to be only 0.1 in the afternoon. During the start of the measurements at 11 a.m. the AOD may be higher, but we do not have any estimate due to non availability of MODIS aerosol data. The wind is found to be westerly and temperature to vary in the range 15–20◦C. The time to complete one full circle around the route (Fig. 1) took about 3 to 5 h.
20
In contrast to MAX-DOAS observations at fixed locations, during car MAX-DOAS observations we have used rather high elevation angles to avoid shades from nearby obstacles (e.g. buildings or trees). We took observations at elevation angles of 22◦ (April 2010) and 30◦(January 2011). From such high elevation angles usually no profile information can be retrieved, but we can obtain the total tropospheric trace gas column 25
ACPD
11, 19179–19212, 2011Estimation of NOx emissions from Delhi
R. Shaiganfar et al.
Title Page
Abstract Introduction
Conclusions References
Tables Figures
◭ ◮
◭ ◮
Back Close
Full Screen / Esc
Printer-friendly Version
Interactive Discussion
Discussion
P
a
per
|
Dis
cussion
P
a
per
|
Discussion
P
a
per
|
Discussio
n
P
a
per
|
2.3 Spectral analysis
The measured spectra are analysed using the DOAS method (Platt and Stutz, 2008). A wavelength range 435–456 nm was selected for the analysis. Several trace gas ab-sorption cross sections (NO2at 298 K (Vandaele et al., 1996), H2O at 298 K (Rothman et al., 2005), Glyoxal at 296 K (Volkamer et al., 2005), O3 at 243 K (Bogumil et al., 5
2003), O4 at 296 K (Hermans et al., 1999)), as well as a Fraunhofer reference spec-trum, a Ring spectrum (calculated from the Fraunhofer spectrum) and a polynomial of third order were included in the spectral fitting process, using the WinDOAS software (Fayt and van Roozendael, 2001).
The wavelength calibration was performed based on a high resolution solar spec-10
trum (Kurucz et al., 1984). The output of the spectral analysis is the slant column density (SCD), the integrated trace gas concentration along the light path through the atmosphere. From the spectral analysis, also the uncertainty of the retrieved SCD is determined; for the NO2analysis it is typically<15 %.
Since a measured spectrum is used as Fraunhofer reference, the retrieval result 15
represents the difference of the SCDs of the measurement at low elevation angle α and the Fraunhofer reference spectrum taken at 90◦
elevation, the so called differential SCD or DSCD:
DSCDα=SCDα−SCDFraunhofer (1)
A typical fit result is shown in Fig. 2. 20
We have considered elevation angles (α) of 22◦for measurements during April 2010
and of 30◦ during January 2011. We considered DSCDαs with RMS of residuals
smaller than 2.5×10⁻³.
2.4 Estimation of the tropospheric VCD
To determine the SCDα of a measurement, the SCDFraunhofer has to be added as
25
ACPD
11, 19179–19212, 2011Estimation of NOx emissions from Delhi
R. Shaiganfar et al.
Title Page
Abstract Introduction
Conclusions References
Tables Figures
◭ ◮
◭ ◮
Back Close
Full Screen / Esc
Printer-friendly Version
Interactive Discussion
Discussion
P
a
per
|
Dis
cussion
P
a
per
|
Discussion
P
a
per
|
Discussio
n
P
a
per
obtained from the SCDαby dividing by the air mass factor (AMF):
VCDtrop=SCDα/AMFα (2)
For many applications, the AMF is retrieved from radiative transfer simulations (Solomon et al., 1987), but here the so called geometric approximation (Brinksma et al., 2008, Andreas Richter, personal communication 2006) is used:
5
AMF(α)=1/sin(α) (3)
Using Eq. (3), the tropospheric AMF were found to be 2.67 and 2 for elevation an-gles of 22◦ and 30◦, respectively. Depending on the aerosol load, cloud condition and vertical trace gas profile, the true AMF can show substantial deviations from the geo-metric approximation. However, NO2 is generally located near the surface; therefore 10
the deviations for our measurements are expected to be small (see next section).
2.5 Effect of aerosols on the measurements
The geometric approximation for tropsopheric AMF (Eq. 3) is only valid if the light path through the trace gas layer of interest can be well approximated by a simple geometric path. This assumption is usually fulfilled for shallow trace gas layers and low aerosol 15
loads, since the observed light is typically scattered from above the trace gas layer. But in the presence of high aerosol extinction, a substantial fraction of the observed light might be scattered from inside the trace gas layer and the geometric approximation is not appropriate for the complete trace gas layer.
Depending on the elevation angle and the amount and properties of the aerosols, 20
scattering inside the trace gas layer may either increase (for high elevation angles) or decrease (for lower elevation angles) the true AMF compared to the geometric approx-imation (Wagner et al., 2004). Thus, the true tropospheric trace gas VCD will be either over- or underestimated.
We have quantified these deviations from the geometric approximation using the 25
ACPD
11, 19179–19212, 2011Estimation of NOx emissions from Delhi
R. Shaiganfar et al.
Title Page
Abstract Introduction
Conclusions References
Tables Figures
◭ ◮
◭ ◮
Back Close
Full Screen / Esc
Printer-friendly Version
Interactive Discussion
Discussion
P
a
per
|
Dis
cussion
P
a
per
|
Discussion
P
a
per
|
Discussio
n
P
a
per
|
aerosol scenarios and NO2layer heights. For NO2layer heights≤500 m and for moder-ate aerosol optical depth (about<1), the deviations from the geometric approximation are found to be below 20 % (see results for elevation angle of 22◦in Fig. 3). Such low NO2layer heights were found over polluted places (Milano, Italy, Wagner et al., 2011). For measurements at an elevation angle of 30◦ (15 January 2011) similar results are 5
found (not shown).
The error in the spectral retrieval is of the order of 15 % (see Sect. 2.3). Thus, we estimate the total error in the estimation of retrieved tropospheric NO2VCD to be about 25 %.
3 3 Estimation of NOxemissions
10
3.1 Emissions from the encircled area
The total NO2 emissions from the encircled area are determined from the following equation (Ibrahim et al., 2010):
FNO2=
I
S
VCDNO2(s)×w×n×d s (4)
Here n(s) indicates the normal vector parallel to the Earth’s surface and orthogonal 15
to the driving direction at the position s of the driving route; w is the average wind vector within the trace gas layer. The integral of Eq. (4) is evaluated for the MAX-DOAS measurements around Delhi. Because of the finite integration time of individual spectra, the integral is approximated by a sum of the individual polygonal lines.
FNO 2=
X
i
VCDNO
2(si)×w×n×∆si
20
=X
i
ACPD
11, 19179–19212, 2011Estimation of NOx emissions from Delhi
R. Shaiganfar et al.
Title Page
Abstract Introduction
Conclusions References
Tables Figures
◭ ◮
◭ ◮
Back Close
Full Screen / Esc
Printer-friendly Version
Interactive Discussion
Discussion
P
a
per
|
Dis
cussion
P
a
per
|
Discussion
P
a
per
|
Discussio
n
P
a
per
The location, length and direction of each segment is taken from GPS data, which were stored at each second using a GPS-Logger (HOLUX, m.247). The distance between two measurements∆si is taken as the geometric difference between the locations at the beginning of two successive measurements. From the same segment, the angle βi between the driving route and the wind direction is calculated.
5
Wind fields are taken from analyses of the European Centre for Medium-Range Weather Forecasts (ECMWF, full scientific and technical documentations are found from the website http://www.ecmwf.int/research/ifsdocs/CY33r1/index.html). Since we are interested in quantifying local emissions, we consider the average of the 3 lower-most layers (about 0, 30 and 60 m above ground), linearly interpolated in time for the 10
average MAX-DOAS time.
We estimate the uncertainty of the flux estimation due to the choice of wind fields by (a) considering the 3 vertical layers separately (causing variations within 15 %), and (b) taking the closest ECMWF output times at 06:00 and 12:00 UTC instead of interpolating (causing variations within 10 % except for 15 January, where the wind 15
fields at 12:00 UTC have changed significantly, whereas the measurements were taken close to 06:00 UTC). Overall, we estimate the error due to wind fields as 18 %.
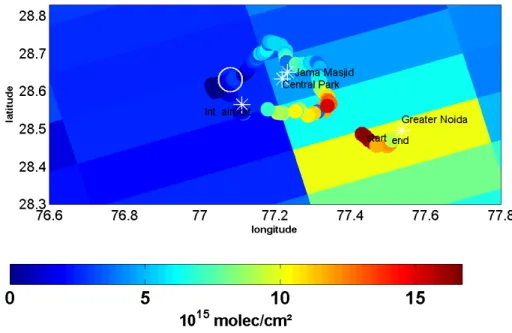
The measured NO2 VCDs together with the wind fields for the four measurement
days are shown in Fig. 4. In general, the highest values of NO2VCDs are found at the lee side of the city, as expected.
20
On some days, due to instrument problems, gaps along the driving route occurred; this was mainly due to disturbances caused by uneven road conditions. Due to such problems, NO2data are missing at some locations, which has contributed to the larger uncertainties in the estimation of the total emissions. We estimate these uncertain-ties in a simple way: in a first calculation, we determine the total emissions clockwise, 25
ACPD
11, 19179–19212, 2011Estimation of NOx emissions from Delhi
R. Shaiganfar et al.
Title Page
Abstract Introduction
Conclusions References
Tables Figures
◭ ◮
◭ ◮
Back Close
Full Screen / Esc
Printer-friendly Version
Interactive Discussion
Discussion
P
a
per
|
Dis
cussion
P
a
per
|
Discussion
P
a
per
|
Discussio
n
P
a
per
|
In the next step, correction factors accounting for the partitioning between NO and NO2(cL) and for the finite lifetime of NOx(cτ) are applied (see Ibrahim et al., 2010) to
derive the complete NOx emissions from the encircled areas:
FNO
x=cL×cτ×FNO2 (6)
Here cL is simply the ratio of NOx and NO2 in the polluted layer; in urban pollution 5
conditions during daytime we have considered its value to be about 1.32 (Seinfeld and Pandis, 2006) with an uncertainty of about 10 %.cτdescribes the ratio of the measured NOx and the originally emitted NOx; it can be estimated from the NOx lifetime τ, the wind speedw and the distance of the emission source from the measurements:
cτ=e
t τ =e
r/w
τ (7)
10
Heret is the ratio of the radius (r) of the circle and the wind speed (w). Assuming a typical urban plume daytime NOxlifetime of 5 h (Spicer, 1982) and taking into account the wind speed of the individual days, using Eq. (7), we foundcτ in the range of 1.09–
1.18 with uncertainties of about±0.1 (assuming uncertainties of the lifetime of ±2 h). The total NOxemissions from within the circles on the different days are shown in Fig. 5. 15
Here the error bars show uncertainties due to missing data at some locations. The total NOxemissions are found to be similar for the different days in the range 1.2–1.6×1025 molecules per second.
It should be noted that especially close to strong emission sources, part of the emit-ted NO might not be quickly converemit-ted to NO2 if the NO mixing ratios locally exceed 20
those of O3. In such cases complete establishment of the NO2/NO steady state will eventually take place only after ambient air has mixed with the emitted plume. Thus, since from MAX-DOAS instrument only NO2 (and not NO) can be detected, the total amount of emitted NOxmight be underestimated close to strong emission sources (see also Ibrahim et al., 2010).
ACPD
11, 19179–19212, 2011Estimation of NOx emissions from Delhi
R. Shaiganfar et al.
Title Page
Abstract Introduction
Conclusions References
Tables Figures
◭ ◮
◭ ◮
Back Close
Full Screen / Esc
Printer-friendly Version
Interactive Discussion
Discussion
P
a
per
|
Dis
cussion
P
a
per
|
Discussion
P
a
per
|
Discussio
n
P
a
per
3.2 Up-scaling of emissions for Delhi
The NOx emissions for the different days (Fig. 5) only reflect the emissions from the encircled areas. In order to make these results comparable within each other and to existing emission inventories, the results have to be up-scaled to the greater Delhi area (bounded in the region indicated in Fig. 1, latitude 28.5◦
N to 28.77◦
N and longitude 5
77.0◦E to 77.4◦E).
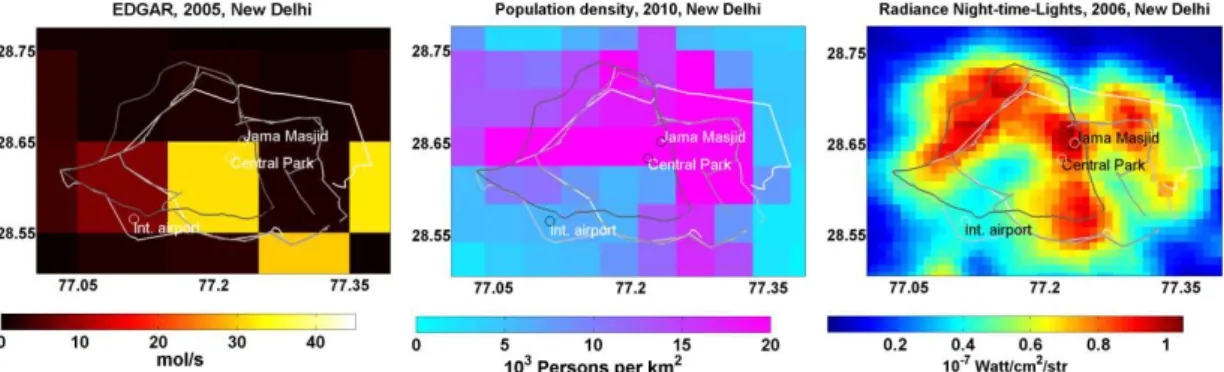
For the up-scaling, we used different proxies for the spatial distribution of the NOx emissions across the considered area. First, we use the EDGAR emission inventory (version 4.1 for 2005, see Olivier et al., 1998; European commission, 2010), but the spatial resolution of this data set is rather coarse (0.1◦). Second, we use data on the 10
population density (obtained from CIESIN, GWPv3, 2010, http://sedac.ciesin.columbia. edu/gpw/global.jsp) with a spatial resolution of 2.5 arc minutes. Third, we apply the dis-tribution of night-time lights measured from satellite during night (NOAA, National geo-physical Data Center, 2006, http://www.ngdc.noaa.gov/dmsp/download radcal.html, Ziskin et al., 2010) with a spatial resolution of 0.5 arc minutes. The respective maps 15
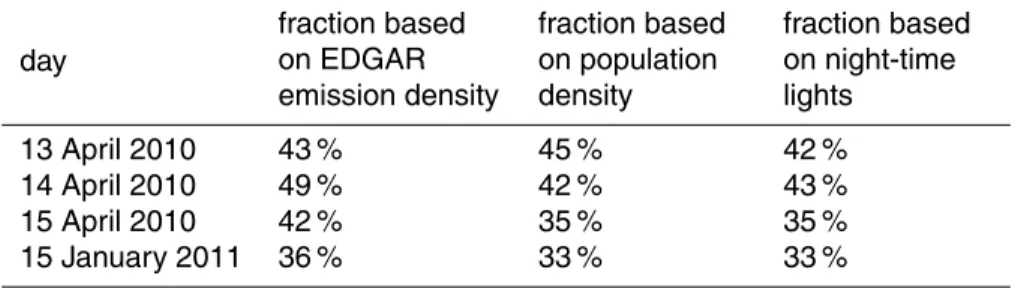
of the different proxies, together with the driving routes of the different days are shown in Fig. 6. For all selected proxies the encircled areas include a substantial fraction of the total Delhi emissions (between 30 and 50 %), but a slightly larger fraction lies still outside of these circles (see Table 1).
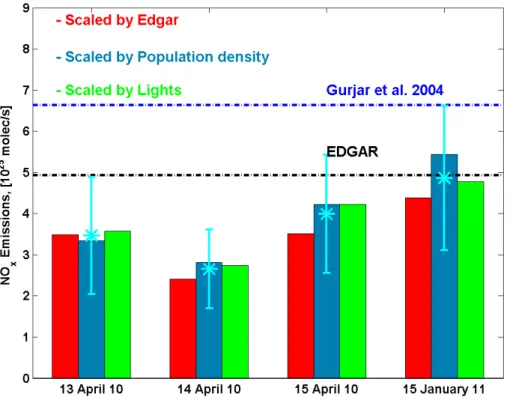
Surprisingly, the calculated fractions using the different proxies are found to be quite 20
similar, that gives us confidence of our up-scaling procedure to determine the total emissions of the selected area. Figure 7 summarises the total NOxemissions using the different proxies; it also includes the corresponding NOx emissions from the EDGAR data base and study by Gurjar et al. (2004). Compared to these emission estimates, our results are found to be systematically lower indicating that the existing emission 25
ACPD
11, 19179–19212, 2011Estimation of NOx emissions from Delhi
R. Shaiganfar et al.
Title Page
Abstract Introduction
Conclusions References
Tables Figures
◭ ◮
◭ ◮
Back Close
Full Screen / Esc
Printer-friendly Version
Interactive Discussion
Discussion
P
a
per
|
Dis
cussion
P
a
per
|
Discussion
P
a
per
|
Discussio
n
P
a
per
|
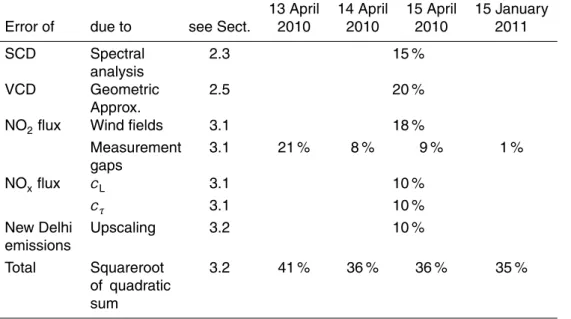
Table 2 lists the different errors of the derived NOx emissions. If we assume these errors to be independent, we obtain total uncertainties of about 40 % (see also Ibrahim et al., 2010).
4 Comparison with OMI satellite data
Validation of tropospheric trace gas products from satellite observations is a challeng-5
ing task for several reasons. First, since satellites measure the vertically integrated tropospheric column density, observations of in-situ surface concentrations can not be directly used for validation purposes. Even if vertical profiles are available from aircraft measurements (e.g. Heland et al., 2002) or balloon soundings (e.g. Sluis et al., 2010), they are often not representative for the whole spatial extent of the satellite ground 10
pixel, which is typically of the order of several hundreds of km2 or more. Similar ar-guments hold for observations of the integrated tropospheric column measurements e.g. from MAX-DOAS observations at fixed locations (e.g. Brinksma et al., 2008). Here it is important to note that close to strong emission sources like Megacities, where the validation of tropospheric satellite products is of highest importance, the largest 15
variability and strongest gradients are typically found (Chen et al., 2009).
Information about the spatial variability across a satellite ground pixel can be ob-tained from mobile measurements like car MAX-DOAS observations (e.g. Volkamer et al., 2006; Wagner et al., 2010), thus we also use the tropospheric NO2VCDs obtained during our measurement campaigns in Delhi for the validation of the simultaneous ob-20
servations of the tropospheric NO2VCDs from the OMI instrument (DOMINO product, v1.02, http://www.temis.nl/airpollution/no2.html, see Boersma et al., 2007). We se-lected OMI satellite observations (Levelt et al. 2002), because the ground pixel sizes are much smaller (∼13×26 km2 in nadir geometry) compared to observations from SCIAMACHY and GOME-2.
25
Figure 8 shows the comparison of the tropospheric NO2VCDs on 14 April 2010
ACPD
11, 19179–19212, 2011Estimation of NOx emissions from Delhi
R. Shaiganfar et al.
Title Page
Abstract Introduction
Conclusions References
Tables Figures
◭ ◮
◭ ◮
Back Close
Full Screen / Esc
Printer-friendly Version
Interactive Discussion
Discussion
P
a
per
|
Dis
cussion
P
a
per
|
Discussion
P
a
per
|
Discussio
n
P
a
per
at relatively slant viewing angles, and the ground pixel sizes are rather large. Thus, the car MAX-DOAS observations cover only relatively small fractions of the individual ground pixels. Nevertheless, in both data sets similar spatial patterns of NO2 are ob-served: highest values of NO2 are found in the south east, which is consistent with the wind direction on that day (north-westerly wind, see Fig. 4). The car MAX-DOAS 5
observations reveal much finer spatial patterns with stronger spatial gradients, which are not resolved from the OMI data.
The comparison of the tropospheric NO2VCDs for 15 April 2010 is shown in Fig. 9. On that day the OMI observations were made almost vertically (nadir geometry), and the satellite pixels are much smaller compared to the observations made on 10
14 April 2010. Both satellite ground pixels over Delhi are well covered by the car MAX-DOAS observations and similar spatial patterns were observed in both data sets. Again, the car MAX-DOAS observations resolve details on a much finer scale.
Figure 10 shows another validation example from 16 January 2011, when MAX-DOAS observations were carried out along a route from Delhi to Agra (about 225 km). 15
Like in the previous examples the general distribution of the tropospheric NO2VCD is found to be similar in both data sets with the highest values at or close to Delhi. An interesting finding is that OMI underestimates the high values over Delhi, but overesti-mates the low values over rural regions along the route Delhi to Agra.
Figure 11 shows a correlation analysis of all car MAX-DOAS observations (during 20
April 2010 and January 2011) and the coincident OMI satellite data (blue points). Here, all MAX-DOAS observations within an OMI ground pixels were averaged. The error bars indicate the OMI error and the standard deviation of the MAX-DOAS observations, respectively. Using these errors, we performed an orthogonal regression (Cantrell, 2008). A reasonable correlation (coefficient of determination r2=0.48) is found, but 25
ACPD
11, 19179–19212, 2011Estimation of NOx emissions from Delhi
R. Shaiganfar et al.
Title Page
Abstract Introduction
Conclusions References
Tables Figures
◭ ◮
◭ ◮
Back Close
Full Screen / Esc
Printer-friendly Version
Interactive Discussion
Discussion
P
a
per
|
Dis
cussion
P
a
per
|
Discussion
P
a
per
|
Discussio
n
P
a
per
|
In order to investigate the effect of limited spatial sampling in the presence of strong gradients in more detail, a second comparison was made including only observations, for which the car MAX-DOAS observations cover large fractions of the OMI pixels (at least 50 % in east-west direction (defined by the most eastern and most western MAX-DOAS observation within the OMI pixel) like e.g. shown in Fig. 9). Only five mea-5
surements fulfilled this criterion. If only these observations are considered, a better correlation (coefficient of determination r2=0.79) is obtained, but the results of the orthogonal regression are almost unchanged.
A general finding of this comparison is that high tropospheric NO2 VCDs are sys-tematically underestimated by OMI, while for low tropospheric NO2VCDs the opposite 10
behaviour is found.
The underestimation of high tropospheric NO2VCDs by OMI might be partly caused by the shielding of the surface-near NO2by aerosols. Here it should, however, be noted that the (effective) cloud fractions for the OMI observations used in our study are found to be very low: 2.3 % on average for all observations;<1.2 % for the sub-set of OMI 15
pixels, which are well covered by the car MAX-DOAS observations. Thus, effects of cloud shielding is considered to be negligible here. Part of the underestimation might also be related to differences between the true (relative) NO2height profiles and those assumed in the satellite retrieval. If e.g. the assumed profiles contain a smaller fraction close to the surface compared to the true profiles, the respective tropospheric AMFs 20
overestimate the true tropospheric AMFs, and consequently, the retrieved tropospheric NO2 VCDs underestimate the true tropospheric NO2VCDs. If in contrast the fraction close to the surface in the assumed profile is larger than in the true profile, the retrieved tropospheric NO2VCDs overestimate the true tropospheric NO2VCDs.
These dependencies can qualitatively explain the observed comparison results, 25
ACPD
11, 19179–19212, 2011Estimation of NOx emissions from Delhi
R. Shaiganfar et al.
Title Page
Abstract Introduction
Conclusions References
Tables Figures
◭ ◮
◭ ◮
Back Close
Full Screen / Esc
Printer-friendly Version
Interactive Discussion
Discussion
P
a
per
|
Dis
cussion
P
a
per
|
Discussion
P
a
per
|
Discussio
n
P
a
per
to the surface in the model profiles probably underestimates the true fraction close to strong emission sources, but probably overestimates it in more rural regions.
5 Conclusions
Car MAX-DOAS observations were performed in the greater Delhi area during April 2010 and January 2011. The aims of the measurements were first the deter-5
mination of the total NOxemissions of the greater Delhi area and second the validation of satellite observations.
The total NOxemissions were derived from observations along closed circles around the city. Since the MAX-DOAS observations encircled only part of the entire Delhi area, we had to up-scale our results. For that purpose we used three different proxies: the 10
spatial distribution of (a) the NOxemissions from the EDGAR data base, (b) population density, and (c) light intensity observed from satellite during night. Although the first two proxies have rather coarse spatial resolution, the up-scaled results using the three proxies agree well (within 20 %). Two additional corrections were applied to account for the partitioning of NO and NO2and for the limited lifetime of NOx(leading to destruction 15
of part of the emitted NOxbetween the locations of the emission source and the obser-vation). The overall uncertainty of our emission estimate taking into account measure-ment uncertainties and uncertainties of the various assumptions is about 40 %. From four measured circles around Delhi (three during April 2010 and one in January 2011) an average value of 3.74×1025 molec/s was derived. The results from the four days
20
were found to agree within±30 %.
Our NOx emission estimate is slightly lower than NOx emissions from the EDGAR data base (v4.1) (4.94×1025molec s−1) and substantially lower than from a recent study by Gurjar et al. (2004) (6.42×1025molec s−1). However, no exact agreement should be expected, because our measurements represent short periods during two 25
ACPD
11, 19179–19212, 2011Estimation of NOx emissions from Delhi
R. Shaiganfar et al.
Title Page
Abstract Introduction
Conclusions References
Tables Figures
◭ ◮
◭ ◮
Back Close
Full Screen / Esc
Printer-friendly Version
Interactive Discussion
Discussion
P
a
per
|
Dis
cussion
P
a
per
|
Discussion
P
a
per
|
Discussio
n
P
a
per
|
We also used the results from the MAX-DOAS observations for the validation of tropospheric NO2 VCDs obtained from the OMI instrument on the AURA satellite. We chose OMI observations because of its relatively small pixel sizes. In general, similar spatial patterns are found in both data sets, but with a much finer spatial resolution in the car MAX-DOAS data. The comparison of absolute values show overall a fair 5
agreement. However, the OMI observations tend to underestimate high tropospheric
NO2 VCDs while they tend to overestimate low tropospheric NO2 VCDs. Most
probably, the systematic differences between OMI and car MAX-DOAS observations are caused by differences between the true vertical NO2 profiles and those assumed in the data retrieval algorithm.
10
The service charges for this open access publication have been covered by the Max Planck Society.
Acknowledgements. The research leading to these results has received funding from the
Euro-pean Union’s Seventh Framework Programme FP/2007-2011 within the project “MEGAPOLI”, 15
grant agreement no. 212520. The authors are thankful for the help and support received from Ravi Singh, Vice-Chancellor and Sunil Mishra, Dean Research, Sharda University to carry out Car MAX-DOAS observations in Delhi and sponsoring visit of MS and AC to the Max Planck Institute for Chemistry. We acknowledge the free use of tropospheric NO2 column data from the OMI sensor from www.temis.nl. We acknowledge European Commission, Joint Research 20
Centre (JRC)/Netherlands Environmental Assessment Agency (PBL) Emission Database for Global Atmospheric Research (EDGAR), release version 4.1. http://edgar.jrc.ec.europa.eu, 2010. Population density Grids are taken from the Center for International Earth Science Information Network (CIESIN), Columbia University; and Centro Internacional de Agricultura Tropical (CIAT). 2005. Gridded Population of the World Version 3 (GPWv3): Population Density 25
Grids. Palisades, NY: Socioeconomic Data and Applications Center (SEDAC), Columbia Uni-versity. Available at http://sedac.ciesin.columbia.edu/gpw. ECMWF operational analysis data provided by ECMWF. For Radiance Night-time lights, we acknowledge Daniel Ziskin. Data pro-cessing by NOAA’s National Geophysical Data Center. DMSP data collected by the US Air Force Weather Agency.
ACPD
11, 19179–19212, 2011Estimation of NOx emissions from Delhi
R. Shaiganfar et al.
Title Page
Abstract Introduction
Conclusions References
Tables Figures
◭ ◮
◭ ◮
Back Close
Full Screen / Esc
Printer-friendly Version
Interactive Discussion
Discussion
P
a
per
|
Dis
cussion
P
a
per
|
Discussion
P
a
per
|
Discussio
n
P
a
per
References
Balk, D. and Yetman, G.: The global distribution of population: evaluating the gains in resolution refinement, New York: Center for International Earth Science Information Network (CIESIN), Columbia University, http://sedac.ciesin.columbia.edu/gpw, 2005, 2004.
Bobrowski, N., H ¨onninger, G., Galle, B., and Platt, U.: Detection of bromine monoxide in a 5
volcanic plume, Nature, 423, 273–276, 2003.
Boersma, K. F., Eskes, H. J., Veefkind, J. P., Brinksma, E. J., van der A, R. J., Sneep, M., van den Oord, G. H. J., Levelt, P. F., Stammes, P., Gleason, J. F., and Bucsela, E. J.: Near-real time retrieval of tropospheric NO2from OMI, Atmos. Chem. Phys., 7, 2103–2118,
doi:10.5194/acp-7-2103-2007, 2007. 10
Bogumil, K., Orphal, J., Homann, T., Voigt, S., Spietz, P., Fleischmann, O.C., Vogel, A., Hart-mann, M., Kromminga, H., BovensHart-mann, H., Frerik, J., and Burrows, J. P.: Measurements of Molecular Absorption Spectra with the SCIAMACHY Pre-Flight Model: Instrument Charac-terization and Reference Data for Atmospheric Remote-Sensing in the 230–2380 nm Region, J. Photochem. Photobiol. A., 157, 167–184, 2003.
15
Brinksma, E. J., Pinardi, G., Volten, H., Braak, R., Richter, A., Sch ¨onhardt, A., Van Roozendael, M., Fayt, C., Hermans, C., Dirksen, R. J., Vlemmix, T., Berkhout, A. J. C., Swart, D. P. J.,
¨
Otjen, H., Wittrock, F., Wagner, T., Ibrahim, O. W., de Leeuw, G., Moerman, M., Curier, R. L., Celarier, E. A., Knap, W. H., Veefkind, J. P., Eskes, H. J., Allaart, M., Rothe, R., Piters, A. J. M., and Levelt, P. F.: The 2005 and 2006 DANDELIONS NO2 and Aerosol Validation
20
Campaigns, J. Geophys. Res., 113, D16S46, doi:10.1029/2007JD008808, 2008.
Cantrell, C. A.: Technical Note: Review of methods for linear least-squares fitting of data and application to atmospheric chemistry problems, Atmos. Chem. Phys., 8, 5477–5487, doi:10.5194/acp-8-5477-2008, 2008.
Chen, D., Zhou, B., Beirle, S., Chen, L. M., and Wagner, T.: Tropospheric NO2column densities
25
deduced from zenith-sky DOAS measurements in Shanghai, China, and their application to satellite validation, Atmos. Chem. Phys., 9, 3641–3662, doi:10.5194/acp-9-3641-2009, 2009.
Deutschmann, T., Beirle, S., Frieß, U., Grzegorski, M., Kern, C., Kritten, L., Platt, U., Pukite, J., Wagner, T., Werner, B., and Pfeilsticker, K.: The Monte Carlo Atmospheric Radiative Transfer 30
ACPD
11, 19179–19212, 2011Estimation of NOx emissions from Delhi
R. Shaiganfar et al.
Title Page
Abstract Introduction
Conclusions References
Tables Figures
◭ ◮
◭ ◮
Back Close
Full Screen / Esc
Printer-friendly Version
Interactive Discussion
Discussion
P
a
per
|
Dis
cussion
P
a
per
|
Discussion
P
a
per
|
Discussio
n
P
a
per
|
Elsayed, N. M.: Toxicity of nitrogen dioxide: an introduction, Toxicology, 89(3), 161–74, 1994. European Commission, Joint Research Centre (JRC)/Netherlands Environmental Assessment
Agency (PBL).: Emission Database for Global Atmospheric Research (EDGAR), release version 4.1. http://edgar.jrc.ec.europa.eu, 2010
Fayt, C. and Van Roozendael, M.: WinDOAS 2.1 Software User Manual, (http://www.oma.be/ 5
BIRA-IASB/Molecules/BrO/WinDOAS-SUM-210b.pdf), 2001.
Gautam, R., Hsu, N. C., Kafatos, M., and Tsay, S.-C.: Influences of winter haze on fog/low cloud over the Indo-Gangetic plains, J. Geophys. Res., 112, D05207, doi:10.1029/2005JD007036, 2007.
Goyal, S. K., Ghatge, S. V., Nema, P., and Tamhane, S. M.: Understanding urban vehicular 10
pollution problem vis- `a-vis ambient air quality – case study of a megacity (Delhi, India), Environ. Monit. Assess., 119, 557–569, doi:10.1007/s10661-005-9043-2, 2006.
Greenblatt, G. D., Orlando, J. J., Burkholder, J. B., and Ravishankara, A. R.: Absorption mea-surements of oxygen between 330 and 1140 nm, J. Geophys. Res., 95, 18577–18582, 1990. Gurjar, B. R., Aardenne, J. A. van, Lelieveld, J., and Mohan, M.: Emission estimates and trends 15
(1990–2000) for megacity Delhi and implications, Atmos. Environ., 38, 5663–5681, 2004. Heland, J., Schlager, H., Richter, A., and Burrows, J. P.: First comparison of tropospheric NO2
column densities retrieved from GOME measurements and in situ aircraft profile measure-ments, Geophys. Res. Lett., 29(20), 1983, doi:10.1029/2002GL015528, 2002.
Hermans, C., Vandaele, A. C., Carleer, M., Fally, S., Colin, R., Jenouvrier, A., Coquart, B., 20
and M ´erienne, M.-F., Absorption Cross-Sections of Atmospheric Constituents, NO2, O2, and
H2O, Environ. Sci. & Pollut. Res., 6, 151–158, 1999.
H ¨onninger G. and Platt U.: Observations of BrO and its vertical distribution during surface ozone depletion at Alert, Atmos. Environ., 36, 2481–2490, 2002.
Ibrahim, O., Shaiganfar, R., Sinreich, R., Stein, T., Platt, U., and Wagner, T.: Car MAX-25
DOAS measurements around entire cities: quantification of NOx emissions from the
cities of Mannheim and Ludwigshafen (Germany), Atmos. Meas. Tech., 3, 709–721, doi:10.5194/amt-3-709-2010, 2010.
Jacob, D. J.: Introduction to Atmospheric Chemistry, Princeton University Press, 1999.
Johansson, M., Galle, B., Yu, T., Tang, L., Chen, D., Li, H., Li, J. X., and Zhang, Y.: Quantifica-30
tion of total emission of air pollutants from Beijing using mobile mini-DOAS, Atmos. Environ., 42, 6926–6933, 2008.
ACPD
11, 19179–19212, 2011Estimation of NOx emissions from Delhi
R. Shaiganfar et al.
Title Page
Abstract Introduction
Conclusions References
Tables Figures
◭ ◮
◭ ◮
Back Close
Full Screen / Esc
Printer-friendly Version
Interactive Discussion
Discussion
P
a
per
|
Dis
cussion
P
a
per
|
Discussion
P
a
per
|
Discussio
n
P
a
per
Mobile mini-DOAS measurement of the outflow of NO2and HCHO from Mexico City, Atmos.
Chem. Phys., 9, 5647–5653, doi:10.5194/acp-9-5647-2009, 2009.
Kraus, S.: DOASIS, A Framework Design for DOAS, PhD-thesis, University of Mannheim, avail-able at: (http://hci.iwr.uni-heidelberg.de/publications/dip/2006/Kraus PhD2006.pdf), 2006. Kurucz, R. L., Furenlid, I., Brault, J., and Testerman, L.: Solar flux atlas from 296 nm to 1300 5
nm, National Solar Observatory Atlas No. 1, Office of University publisher, Harvard Univer-sity, Cambridge, 1984.
Lal, S.: Trace gases over the Indian region, Indian J. Radio Space, 36, 556–579, 2007. Levelt, P.F. and Noordhoek, R.: OMI Algorithm Theoretical Basis Document Volume I: OMI
In-strument, Level 0-1b Processor, Calibration & Operations, Tech. Rep. ATBD-OMI-01, Version 10
1.1, 2002.
Olivier, J. G. J., Bouwman, A. F., Van der Hoek, K. W., and Berdowski, J. J. M.: Global air emission inventories for anthropogenic sources of NOx, NH3 and N2O in 1990, Environ.
Pollut., 102, 135–148., 1998.
Platt, U. and Stutz, J.: Differential Optical Absorption Spectroscopy, Principles and Applications, 15
Springer, Berlin, 2008.
Ramanathan, V. and Ramana, M. V.: Persistent, Widespread and Strongly Absorbing Haze over the Himalayan Foothills and the Indo-Ganges Plains, Pure and Applied Geophysics, 162, 1609–1626, doi:10.1007/s00024-005-2685-8, 2005.
Ramanathan, V., Chung, C., Kim, D., Bettge, T., Buja, L., Kiehl, J. T., Washington, W. M., Fu, 20
Q., Sikka, D. R., and Wild, M.: Atmospheric brown clouds: Impacts on South Asian climate and hydrological cycle, Proc. Natl. Acad. Sci. USA, 102, 5326-5333, 2005.
Ravishankara, R., Liu, S., Platt, U., Bates, T., Bey, I., Carslaw, K., Chipperfield, M., Douglass, A., Fahey, D., Feingold, G., Fuzzi, S., Gettleman, A., Granier, C., Hauglustine, D., Mari, C., O’Neill, A., Parrish, D., Quinn, P., Randel, W., Rosenlof, K., Shepherd, T. and Simon, 25
P.: Climate Chemistry Interactions, Report from the joint SPARC/IGAC workshop, 3-5 April 2003, Giens, France, http://www.atmosp.physics.utoronto.ca/SPARC/RelatedPublications/ IGAC SPARC FINAL.pdf, 2004.
Rivera, C., Sosa, G., W ¨ohrnschimmel, H., de Foy, B., Johansson, M., and Galle, B.: Tula in-dustrial complex (Mexico) emissions of SO2and NO2during the MCMA 2006 field campaign
30
using a mobile mini-DOAS system, Atmos. Chem. Phys., 9, 6351–6361, doi:10.5194/acp-9-6351-2009, 2009.
ACPD
11, 19179–19212, 2011Estimation of NOx emissions from Delhi
R. Shaiganfar et al.
Title Page
Abstract Introduction
Conclusions References
Tables Figures
◭ ◮
◭ ◮
Back Close
Full Screen / Esc
Printer-friendly Version
Interactive Discussion
Discussion
P
a
per
|
Dis
cussion
P
a
per
|
Discussion
P
a
per
|
Discussio
n
P
a
per
|
Chackerian Jr., C., Chance, K., Coudert, L.H., Dana, V., Devi, V.M., Flaud, J.-M. , Gamache, R.R., Goldman, A., Hartmann, J.-M., Jucks, K.W., Maki, A.G., Mandin, J.-Y., Massie, S.T., Orphal, J., Perrin, A., Rinsland, C.P., Smith, M.A.H., Tennyson, J., Tolchenov, R.N., Toth, R.A., Vander Auwera, J., Varanasi, P., and Wagner, G.: The HITRAN 2004 molecular spec-troscopic database, J. Quant. Spectrosc. Ra., 96 139–204, 2005.
5
Seinfeld, J. H. and Pandis, S. N.: From air pollution to climate change, Atmospheric Chemistry and Physics, John Wiley & Sons, New York 2nd Edn, 2006.
Sheel, V., Lal, S., Richter, A., and Burrows, J. P.: Comparison of satellite observed tropospheric NO2 over India with model simulations, Atmos. Environ., 44, 3314–3321, doi:10.1016/j.atmosenv.2010.05.043, 2010.
10
Singh, R. P., Dey, S., Tripathi, S. N., Tare, V., and Holben, B.: Variability of aerosol parameters over Kanpur, northern India, J. Geophys. Res., 109, D23206, doi:10.1029/2004JD004966, 2004.
Singh, R. P., Prasad, A. K., Chauhan, S. S. S., and Singh, S.: Impact of growing urbaniza-tion and air polluurbaniza-tion on the regional climate over India, Internaurbaniza-tional Associaurbaniza-tion for Urban 15
Climate Newsletter, Issue No. 14, December 2005, 5–10, 2005.
Sluis, W. W., Allaart, M. A. F., Piters, A. J. M., and Gast, L. F. L.: The development of a nitrogen dioxide sonde, Atmos. Meas. Tech., 3, 1753–1762, doi:10.5194/amt-3-1753-2010, 2010. Spicer, C. W.: Nitrogen Oxide Reactions in the Urban Plume of Boston. Science, 215, 1095–
1097, 1982. 20
Vandaele, A. C., Hermans, C., Simon, P.C., Roozendael, M., Guilmot, J. M., Carleer, M. and Colin, R.: Fourier transform measurement of NO2 absorption cross-section in the visible
range at room temperature, J. Atmos. Chem., 25(3), 289–305, 1996.
Van Roozendael, M., Fayt, C., Post, P., Hermans, C., and Lambert, J.-C.: Retrieval of BrO and NO2 from UV-Visible Observations, in: Sounding the troposphere from space: a new era
25
for atmospheric chemistry, edited by: Borell, P., Borrell, P. M., Burrows, J. P., and Platt, U., Springer, Heidelberg, ISBN 3-540-40873-8, 2004.
Volkamer, R., Spietz, P. and Burrows, J. and Platt, U.: High-resolution absorption cross-section of glyoxal in the UV-vis and IR spectral ranges, J. Photoch. Photobio. A, 172, 35—46, 2005. Volkamer, R., Kurosu, T. P., Chance, K., Li, Z., Zhang, Y., Brauers, T., and Wahner, A.: Spatial 30
Variability of Glyoxal, HCHO and NO2during PRD-2006: Comparison of mobile
ACPD
11, 19179–19212, 2011Estimation of NOx emissions from Delhi
R. Shaiganfar et al.
Title Page
Abstract Introduction
Conclusions References
Tables Figures
◭ ◮
◭ ◮
Back Close
Full Screen / Esc
Printer-friendly Version
Interactive Discussion
Discussion
P
a
per
|
Dis
cussion
P
a
per
|
Discussion
P
a
per
|
Discussio
n
P
a
per
Wagner, T., Dix, B., Friedeburg, C. V., Frieß, U., Sanghavi, S., Sinreich, R., and Platt, U.: MAX-DOAS O4 measurements – a new technique to derive information on
atmo-spheric aerosols. (I) Principles and information content, J. Geophys. Res., 109, D22205, doi:10.1029/2004JD004904, 2004.
Wagner, T., Ibrahim, O., Shaiganfar, R., and Platt, U.: Mobile MAX-DOAS observations of 5
tropospheric trace gases, Atmos. Meas. Tech., 3, 129–140, doi:10.5194/amt-3-129-2010, 2010.
Wagner, T., Beirle, S., Brauers, T., Deutschmann, T., Frieß, U., Hak, C., Halla, J. D., Heue, K. P., Junkermann, W., Li, X., Platt, U., and Pundt-Gruber, I.: Inversion of tropospheric profiles of aerosol extinction and HCHO and NO2mixing ratios from MAX-DOAS observations in Milano
10
during the summer of 2003 and comparison with independent data sets, Atmos. Meas. Tech. Discuss., 4, 3891–3964, doi:10.5194/amtd-4-3891-2011, 2011.
Wittrock, F., Oetjen, H., Richter, A., Fietkau, S., Medeke, T., Rozanov, A., and Burrows, J. P.: MAX-DOAS measurements of atmospheric trace gases in Ny- ˚Alesund - Radiative transfer studies and their application, Atmos. Chem. Phys., 4, 955–966, doi:10.5194/acp-4-955-2004, 15
2004.
World Health Organization, Health Aspects of Air. Pollution with Particulate Matter, Ozone and Nitrogen Dioxide. Report on a WHO Working Group, 13–15 January 2003, Bonn, Germany, 2003.
Ziskin, D., Kimberly, B., Feng, C.H., Tilottama, G., and Chris, E.: Methods Used For the 2006 20
ACPD
11, 19179–19212, 2011Estimation of NOx emissions from Delhi
R. Shaiganfar et al.
Title Page
Abstract Introduction
Conclusions References
Tables Figures
◭ ◮
◭ ◮
Back Close
Full Screen / Esc
Printer-friendly Version
Interactive Discussion
Discussion
P
a
per
|
Dis
cussion
P
a
per
|
Discussion
P
a
per
|
Discussio
n
P
a
per
|
Table 1. Fraction of the EDGAR NOx emissions, population, and light within the surrounded
areas for the different days.
day
fraction based on EDGAR emission density
fraction based on population density
fraction based on night-time lights
13 April 2010 43 % 45 % 42 %
14 April 2010 49 % 42 % 43 %
15 April 2010 42 % 35 % 35 %
ACPD
11, 19179–19212, 2011Estimation of NOx emissions from Delhi
R. Shaiganfar et al.
Title Page
Abstract Introduction
Conclusions References
Tables Figures
◭ ◮
◭ ◮
Back Close
Full Screen / Esc
Printer-friendly Version
Interactive Discussion
Discussion
P
a
per
|
Dis
cussion
P
a
per
|
Discussion
P
a
per
|
Discussio
n
P
a
per
Table 2.Uncertainties of the different steps of the emission estimate.
13 April 14 April 15 April 15 January
Error of due to see Sect. 2010 2010 2010 2011
SCD Spectral
analysis
2.3 15 %
VCD Geometric
Approx.
2.5 20 %
NO2flux Wind fields 3.1 18 %
Measurement gaps
3.1 21 % 8 % 9 % 1 %
NOxflux cL 3.1 10 %
cτ 3.1 10 %
New Delhi Upscaling 3.2 10 %
emissions
Total Squareroot
of quadratic sum
ACPD
11, 19179–19212, 2011Estimation of NOx emissions from Delhi
R. Shaiganfar et al.
Title Page
Abstract Introduction
Conclusions References
Tables Figures
◭ ◮
◭ ◮
Back Close
Full Screen / Esc
Printer-friendly Version
Interactive Discussion
Discussion
P
a
per
|
Dis
cussion
P
a
per
|
Discussion
P
a
per
|
Discussio
n
P
a
per
|
ACPD
11, 19179–19212, 2011Estimation of NOx emissions from Delhi
R. Shaiganfar et al.
Title Page
Abstract Introduction
Conclusions References
Tables Figures
◭ ◮
◭ ◮
Back Close
Full Screen / Esc
Printer-friendly Version
Interactive Discussion
Discussion
P
a
per
|
Dis
cussion
P
a
per
|
Discussion
P
a
per
|
Discussio
n
P
a
per
Fig. 2.Typical result of the DOAS fit. Shown are the NO2cross-section scaled by the respective
ACPD
11, 19179–19212, 2011Estimation of NOx emissions from Delhi
R. Shaiganfar et al.
Title Page Abstract Introduction Conclusions References Tables Figures ◭ ◮ ◭ ◮ Back Close
Full Screen / Esc
Printer-friendly Version Interactive Discussion Discussion P a per | Dis cussion P a per | Discussion P a per | Discussio n P a per | 0 0.5 1 1.5
0 0.5 1 1.5 2 2.5 3
AOD V C Dtr u e / V CD g e o Reihe2 Reihe3 Reihe4 Reihe1 Reihe5 Reihe6
0°, 2km 90°, 2km 180°, 2km 0°, 1km 90°, 1km 180°, 1km
NO2 layer:
0 - 100m
0 0.5 1 1.5
0 0.5 1 1.5 2 2.5 3
AOD V C Dtr u e / V CD g e o
NO2 layer:
0 - 200m
0 0.5 1 1.5
0 0.5 1 1.5 2 2.5 3
AOD V C Dtr u e / V CD g e o
NO2 layer:
0 - 500m
0 0.5 1 1.5
0 0.5 1 1.5 2 2.5 3
AOD V C Dtr u e / V CD g e o
NO2 layer:
0 - 1000m
Fig. 3. Relative deviation of the true tropospheric VCDs (derived from radiative transfer
Fig. 3. Relative deviation of the true tropospheric VCDs (derived from radiative transfer
ACPD
11, 19179–19212, 2011Estimation of NOx emissions from Delhi
R. Shaiganfar et al.
Title Page
Abstract Introduction
Conclusions References
Tables Figures
◭ ◮
◭ ◮
Back Close
Full Screen / Esc
Printer-friendly Version
Interactive Discussion
Discussion
P
a
per
|
Dis
cussion
P
a
per
|
Discussion
P
a
per
|
Discussio
n
P
a
per
13 April 2010 14 April 2010
15 April 2010 15 January 2011
Fig. 4. Tropospheric NO VCDs derived from car MAX-DOAS observations around Delhi on
Fig. 4. Tropospheric NO2 VCDs derived from car MAX-DOAS observations around Delhi on
ACPD
11, 19179–19212, 2011Estimation of NOx emissions from Delhi
R. Shaiganfar et al.
Title Page
Abstract Introduction
Conclusions References
Tables Figures
◭ ◮
◭ ◮
Back Close
Full Screen / Esc
Printer-friendly Version
Interactive Discussion
Discussion
P
a
per
|
Dis
cussion
P
a
per
|
Discussion
P
a
per
|
Discussio
n
P
a
per
|
Fig. 5. NOx emissions obtained from the car MAX-DOAS measurements for the surrounded
ACPD
11, 19179–19212, 2011Estimation of NOx emissions from Delhi
R. Shaiganfar et al.
Title Page
Abstract Introduction
Conclusions References
Tables Figures
◭ ◮
◭ ◮
Back Close
Full Screen / Esc
Printer-friendly Version
Interactive Discussion
Discussion
P
a
per
|
Dis
cussion
P
a
per
|
Discussion
P
a
per
|
Discussio
n
P
a
per
Fig. 6. Spatial distribution of the NOx emissions from the EDGAR data base (left), of the
ACPD
11, 19179–19212, 2011Estimation of NOx emissions from Delhi
R. Shaiganfar et al.
Title Page
Abstract Introduction
Conclusions References
Tables Figures
◭ ◮
◭ ◮
Back Close
Full Screen / Esc
Printer-friendly Version
Interactive Discussion
Discussion
P
a
per
|
Dis
cussion
P
a
per
|
Discussion
P
a
per
|
Discussio
n
P
a
per
|
Fig. 7. Comparison of the up-scaled NO emissions from the car MAX-DOAS measurements
Fig. 7. Comparison of the up-scaled NOx emissions from the car MAX-DOAS measurements
ACPD
11, 19179–19212, 2011Estimation of NOx emissions from Delhi
R. Shaiganfar et al.
Title Page
Abstract Introduction
Conclusions References
Tables Figures
◭ ◮
◭ ◮
Back Close
Full Screen / Esc
Printer-friendly Version
Interactive Discussion
Discussion
P
a
per
|
Dis
cussion
P
a
per
|
Discussion
P
a
per
|
Discussio
n
P
a
per
Fig. 8. Comparison of the tropospheric NO2VCDs on 14 April 2010 measured from OMI and
ACPD
11, 19179–19212, 2011Estimation of NOx emissions from Delhi
R. Shaiganfar et al.
Title Page
Abstract Introduction
Conclusions References
Tables Figures
◭ ◮
◭ ◮
Back Close
Full Screen / Esc
Printer-friendly Version
Interactive Discussion
Discussion
P
a
per
|
Dis
cussion
P
a
per
|
Discussion
P
a
per
|
Discussio
n
P
a
per
|
Fig. 9. Comparison of the tropospheric NO2VCDs on 15 April 2010 measured from OMI and
ACPD
11, 19179–19212, 2011Estimation of NOx emissions from Delhi
R. Shaiganfar et al.
Title Page
Abstract Introduction
Conclusions References
Tables Figures
◭ ◮
◭ ◮
Back Close
Full Screen / Esc
Printer-friendly Version
Interactive Discussion
Discussion
P
a
per
|
Dis
cussion
P
a
per
|
Discussion
P
a
per
|
Discussio
n
P
a
per
Fig. 10. Comparison of the tropospheric NO2 VCDs on 16 January 2011 measured from OMI
ACPD
11, 19179–19212, 2011Estimation of NOx emissions from Delhi
R. Shaiganfar et al.
Title Page
Abstract Introduction
Conclusions References
Tables Figures
◭ ◮
◭ ◮
Back Close
Full Screen / Esc
Printer-friendly Version
Interactive Discussion
Discussion
P
a
per
|
Dis
cussion
P
a
per
|
Discussion
P
a
per
|
Discussio
n
P
a
per
|
Fig. 11. Correlation analysis of OMI and car MAX-DOAS observations of the tropospheric
Fig. 11.Correlation analysis of OMI and car MAX-DOAS observations of the tropospheric NO2