ACPD
5, 911–936, 2005Intercomparison of O3 profiles
M. Palm et al.
Title Page
Abstract Introduction
Conclusions References
Tables Figures
◭ ◮
◭ ◮
Back Close
Full Screen / Esc
Print Version
Interactive Discussion
EGU Atmos. Chem. Phys. Discuss., 5, 911–936, 2005
www.atmos-chem-phys.org/acpd/5/911/ SRef-ID: 1680-7375/acpd/2005-5-911 European Geosciences Union
Atmospheric Chemistry and Physics Discussions
Intercomparison of O
3
profiles observed
by SCIAMACHY, ground based microwave
and FTIR instruments
M. Palm1, C. v. Savigny1, T. Warneke1, V. Velazco1, J. Notholt1, K. K ¨unzi1, J. Burrows1, and O. Schrems2
1
Institute of Environmental Physics, University of Bremen, PO Box 330440, D-28334 Bremen, Germany
2
Alfred Wegener Institute for Polar and Marine Research, PO Box 120169, D-27515 Bremerhaven, Germany
Received: 19 April 2004 – Accepted: 10 January 2005 – Published: 18 February 2005 Correspondence to: M. Palm ([email protected])
ACPD
5, 911–936, 2005Intercomparison of O3 profiles
M. Palm et al.
Title Page
Abstract Introduction
Conclusions References
Tables Figures
◭ ◮
◭ ◮
Back Close
Full Screen / Esc
Print Version
Interactive Discussion
EGU
Abstract
Ozone profiles retrieved from limb scattering measurements of the SCIAMACHY in-strument based on the satellite ENVISAT are compared to ground based low altitude resolution remote sensors. All profiles are retrieved using optimal estimation. Following the work ofRodgers and Connor(2003) the retrievals of the ground based instruments 5
are simulated using the SCIAMACHY retrieval. The SCIAMACHY results and the re-sults of the ground based microwave radiometer in Bremen and Ny Alesund agree within the expected covariance of the intercomparison. There are not enough coinci-dent measurements of the FTIR instrument in order to allow for a conlusive statistical treatment. However, preliminary intercomparison results are presented.
10
1. Introduction
The ozone profile is of interest because ozone is one of the most important trace gases in the atmosphere. Ozone is a green house gas and provides shielding from UV ra-diation. Following the discovery of the ozone hole (Farman et al.,1985) a large effort has been put into understanding the reason for it and to establish a network for mon-15
itoring the further development of the ozone layer. Although the emission of human made chemicals (CFCs) has been curbed, the rise in the water vapor content of and the decrease of the temperature in the stratosphere still give reasons of concern about the ozone layer (e.g.Rex et al.,2004).
Remote sounding instruments are used to monitor various atmospheric properties 20
like trace gases from ground or satellite. In the upper stratosphere and above very few if any in-situ measurements are available. All remote sounders are indirect instruments in the sense that they measure a more or less complicated function of the quantity of in-terest (Rodgers and Connor,2003). In order to understand and interpret the data taken it is necessary to understand the relationship between the true atmospheric state and 25
ACPD
5, 911–936, 2005Intercomparison of O3 profiles
M. Palm et al.
Title Page
Abstract Introduction
Conclusions References
Tables Figures
◭ ◮
◭ ◮
Back Close
Full Screen / Esc
Print Version
Interactive Discussion
EGU on a continuous basis in order to enhance the quality of the measurements and to
as-sess the stability of the combination instrument/retrieval (Rodgers and Connor,2003).
2. The instruments
2.1. O3profiles from SCIAMACHY on Envisat
SCIAMACHY, the Scanning Imaging Absorption spectrometer for Atmospheric CHar-5
tographY (Bovensmann et al.,1999) is a novel satellite-borne scientific instrument ca-pable of performing spectroscopic measurements of the chemical composition of the Earth’s atmosphere in three different observation geometries: nadir, solar/lunar oc-cultation and limb scattering. SCIAMACHY covers the spectral range from 220 nm to 2380 nm with a spectral resolution varying from 0.2 nm to 1.5 nm depending on wave-10
length. In limb scattering geometry the instrument line of sight follows a slant path tangentially through the atmosphere. Detected are solar photons that are both (a) scat-tered along the line of sight into the instrument’s field of view, and (b) transmitted from the scattering point to the instrument. The geometrical field of view of SCIAMACHY in limb scattering mode is about 2.8 km vertically and 110 km horizontally. The Earth’s 15
limb is viewed in flight direction and scanned from tangent heights of about 0 km up to 100 km in steps of 3.3 km. Furthermore, at every tangent height step an azimuthal (horizontal) scan is performed covering about 960 km at the tangent point. Therefore the limb measurement mode amounts to an averaging over about 1000 km perpendic-ular to the orbit track. Along the flight track the averaging occurs over a distance of 20
about 400 km.
The stratospheric O3profiles used here are derived from SCIAMACHY limb scatter-ing measurements in the Chappuis-bands of O3. The retrieval algorithm employed is
similar to the one described inFlittner et al.(2000), and McPeters et al. (2000), and has also been used for operational data processing of limb scattering observations 25
ACPD
5, 911–936, 2005Intercomparison of O3 profiles
M. Palm et al.
Title Page
Abstract Introduction
Conclusions References
Tables Figures
◭ ◮
◭ ◮
Back Close
Full Screen / Esc
Print Version
Interactive Discussion
EGU Savigny et al.,2003) on the Swedish-led Odin satellite. The retrieval exploits the
dif-ferential structure of the O3cross section between the center (600 nm) and the wings
(525 nm and 675 nm) of the Chappuis absorption bands of O3. A linearized version of
optimal estimation (OE) is used together with the radiative transfer model SCIARAYS (Kaiser et al.,2003) to iteratively retrieve stratospheric O3 concentration profiles. The
5
altitude range from about 15 km up to 40 km can be covered with this technique.
2.2. The millimeter-wave radiometers BreRAM and RAM
The millimeter-wave radiometers RAM (Radiometer for Atmospheric Measurements at Ny Alesund, 78◦N, 11◦E) and BreRAM (Bremen Radiometer for Atmospheric Measure-ments at Bremen, 53◦N, 8◦E) are very similar. Unless specifically noted the following 10
description applies to both.
The instruments are heterodyne millimeter-wave radiometers tuned at the frequency of O3 lines at 142 GHz (RAM) and 110.836 GHz (BreRAM). Both instruments are
op-erated in total power mode. In order to resolve the spectra the instruments use AOS spectrometers with a bandwidth of about 1 GHz and a effective resolution of 1.3 MHz. 15
The receiver noise temperature is about 3000 K. This enables both instruments to mea-sure a spectrum of the O3line every half an hour. Using a special scheme (Wohltmann,
2002) the integration time can be prolonged up to a day in order to enhance signal to noise ratio. Millimeter-wave radiometers are insensitive to meteorological conditions and clouds and do not depend on sun light. They provide therefore the most complete 20
time series of the ozone profile.
The O3 profile information is retrieved from the spectra using Optimal Estimation
Methods (see Sect.3 and Rodgers,2000). Information about the vertical ozone dis-tribution between 15 km and 55 km with a height resolution of 15 km at its best can be obtained.
25
ACPD
5, 911–936, 2005Intercomparison of O3 profiles
M. Palm et al.
Title Page
Abstract Introduction
Conclusions References
Tables Figures
◭ ◮
◭ ◮
Back Close
Full Screen / Esc
Print Version
Interactive Discussion
EGU and satellite measurements have been undertaken (Langer,1999) with good results:
– Intercomparison with MLS profiles (20–50 km): RAM understimates O3-vmr. The deviation is smaller than 10%.
– Intercomparison with sonde profiles (18–24 km): RAM overestimates below 20 km and underestimates O3-vmr above. Deviation smaller than 10%.
5
– Intercomparison with LIDAR (16–34 km): RAM overestimates the O3-profile
be-low 20 km and above 30 km. The O3-profile is underestimated in between. The
maximum deviation is 11%.
2.3. The infrared spectrometer FTIR
Solar and lunar absorption measurements using FTIR spectroscopy (Fourier Transform 10
Spectroscopy) have been performed at Ny Alesund since 1992 (Notholt,1994;Notholt
and Schrems,1994). If weather conditions permit, spectra are recorded at a maximum resolution of 0.005 cm−1. Vertical profiles of ozone were retrieved from these spec-tra with the SFIT2 algorithm developed at NASA Langley Research Center and the National Institute for Water and Atmospheric Research (New Zealand) (e.g.Rinsland
15
et al.,1998). Based on Pougatchev et al. (1996) and Barret et al. (2002) a spectral interval between 1000 and 1004 cm−1 was choosen for the retrieval. Daily launched balloon sondes provide pressure and temperature profiles and the initial vmr-profiles of water up to 30 km. The initial vmr-profiles of ozone are based on ozone sondes launched once or twice a week at Ny Alesund. For all other gases the initial vmr-20
profiles are based on balloon observations performed in the Arctic at Fairbanks (see
ACPD
5, 911–936, 2005Intercomparison of O3 profiles
M. Palm et al.
Title Page
Abstract Introduction
Conclusions References
Tables Figures
◭ ◮
◭ ◮
Back Close
Full Screen / Esc
Print Version
Interactive Discussion
EGU
3. The Optimal Estimation Retrieval
For a detailed discussion of the Optimal Estimation Retrieval (OE) seeRodgers(2000). In this work a brief overview will be given and certain aspects crucial to the understand-ing of the comparison are discussed. If not noted otherwise the followunderstand-ing is based on
Rodgers(2000) andRodgers and Connor(2003). 5
The retrieval of information about the vertical ozone distribution is mathematically an inverse problem. Detailed understanding of the relation between a given distribution of ozone in the atmosphere and a spectrum measured on the ground or in space is available by the so called forward modelF. Let xbe a given ozone distribution andy
a spectrum. A Gaussian distributed errorǫwith covarianceSǫwill be assumed on the 10
spectrum. Hencey is obtained by
y=F(x)+ǫ=F(x0)+∂F
∂x(x−x0)+O(x
2)
+ǫ (1)
which is called the forward problem with the weighting function matrix K=∂∂Fx. Using Bayes law the following relationship for the inverse model (for the detailed discussion please seeRodgers, 2000) is found. Let xa be the a priori profile of O3 and Sa the
15
covariance matrix ofxa. LetP(x|y) denote the probability of getting a ozone distribution
xgiven a spectrumy. The probability distributionP(x|y) can be written as:
P(x|y)=exp(−(F(x)−y)TS−1ǫ (F(x)−y)) exp(−(xa−x)S−1a (xa−x)) (2) In OE the solution, the otimal profilexˆ, is found by
ˆ
x=xa+SaKT(KSaKT +Sǫ)−1(y−Kxa). (3) 20
In the case of a weakly non-linear forward model the solution can be found by an iterative algorithm like the Levenberg-Marquardt-Algorithm. By defining
ACPD
5, 911–936, 2005Intercomparison of O3 profiles
M. Palm et al.
Title Page
Abstract Introduction
Conclusions References
Tables Figures
◭ ◮
◭ ◮
Back Close
Full Screen / Esc
Print Version
Interactive Discussion
EGU Eq. (3) can be written as
ˆ
x=xa+D(y−Kxa) (5) and noting that y=KxT rue (the error ǫ has been omitted), the so called instrument model is
ˆ
x=xa+D(KxT rue−Kxa)=xa+A(xT rue−xa). (6) 5
Equation (6) relates the unknown true profilexT rue to the profile retrieved. The matrix
Ais called the resolution kernel matrix and can also be written by
A= ∂xˆ
∂xT rue. (7)
The resolution kernel matrixAcontains information about the sensitivity of the instru-ment/retrieval to changes in the true profile.
10
3.1. Intercomparison of indirect measurements
Assume two retrievals 1 and 2 with respect to the a priorixaandxc, respectively. The direct differenceδx of two profilesxˆ1andxˆ2is
δx =xˆ1−xˆ2=xa+A1(xT rue−xa)
−(xc+A2(xT rue−xc))+ǫ1−ǫ2
15
=(A1−A2)(xT rue−xc) (8)
−(A1−I)(xa−xc)+ǫ1−ǫ2.
The term (I−A)(xa−xc) contains the difference of the a priori profiles of the retrievals. For simplicity all profiles have been transformed to be with respect to the a priori profile
xc. This has been done by adding the term (A1−I)(xa−xc) to the retrieved profile in
20
question. LetSx
1,Sx2 be the error covariances of retrieval 1 and 2, respectively. The
expected error covarianceSδ of the difference of the profiles (Eq.8) is
Sδ =(A1−A2)Sc(A1−A2)T +Sx
ACPD
5, 911–936, 2005Intercomparison of O3 profiles
M. Palm et al.
Title Page
Abstract Introduction
Conclusions References
Tables Figures
◭ ◮
◭ ◮
Back Close
Full Screen / Esc
Print Version
Interactive Discussion
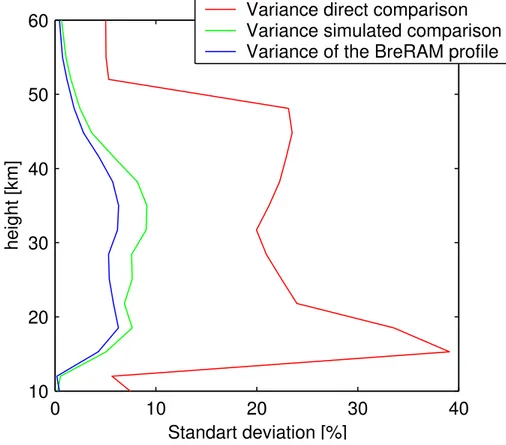
EGU The expected variance of the profile difference may be quite large (Fig. 1 for an
ex-ample). FollowingRodgers and Connor (2003) another comparison method, retrieval simulation, leads to much smaller expected variances in the profile differences.
3.2. Simulating one retrieval with another
Again it is assumed that both profilesxˆ1and xˆ2 are with respect to the same a priori 5
profilexc. The retrieval 1 is simulated using retrieval 2 by:
ˆ
x12=xc+A1(xˆ2−xc). (10) The difference of the profiles is
δ12 =x1−x12 =(A1−A1A2)(x−xc)+ǫ1−ǫ2 (11) and the covariance of the difference is found by
10
S12 =(A1−A1A2)Sc(A1−A1A2)T+S1+A1S2AT1. (12)
The expected variances of the ground based retrievals simulated by the SCIAMACHY retrieval are shown in Fig.1. For the intercomparison using simulated retrievals the expected standard deviation is smaller than for direct intercomparison. In fact it is only little larger than the expected standard deviation for the BreRAM profile.
15
4. Results
4.1. Assumptions and procedure of the comparison
The most important difference of the SCIAMACHY instrument on the one hand and all other, ground based, instruments on the other hand is the measuring geometry. While SCIAMACHY measurements are integrated over a large area (the SCIAMACHY pixel 20
ACPD
5, 911–936, 2005Intercomparison of O3 profiles
M. Palm et al.
Title Page
Abstract Introduction
Conclusions References
Tables Figures
◭ ◮
◭ ◮
Back Close
Full Screen / Esc
Print Version
Interactive Discussion
EGU Measurements are compared if the location of the ground based instrument is within
the SCIAMACHY pixel plus 500 km. Also, the time difference is required to be less than 2 h. Care has been taken in order to measure comparable air masses. There are several options to consider:
1. The total ozone column is compared. A paper byLamsal et al. (2003) indicates 5
that the ozone profile for a given latitude and season approximately scales with the total O3-column. The O3 column above the site of the ground based
instru-mentsmG is required to be comparable to the mean ozone O3columnmS within
the SCIAMACHY pixel, i.e. |2(mG−mS)/(mG+mS)|<m0 (see Table 1). The
vari-ation within the SCIAMACHY pixels is required to be smaller than a maximum 10
d0in order to exclude pixels where e.g. filaments disturb the homogeneity of the
atmosphere. m0andd0are chosen differently for the instruments in order to get
a good balance between the number of coincident measurements and the quality of the profiles compared. The total ozone columns were measured by the TOMS satellite but will be provided by SCIAMACHY itself in future.
15
2. The potential vorticity (PV) is calculated in order to ensure that the measurements are completely either inside or outside the polar vortex. The same PV of either larger than 40 PVU (potential vorticity units; inside the vortex) or smaller than 30 PVU (outside the vortex) is required for both measurement areas. All coinci-dent measurements in 2003 above Ny Alesund were outside the vortex.
20
The retrieved ozone profiles have been processed as follows:
1. vmrs are calculated from the concentration profiles provided by SCIAMACHY us-ing ECMWF ERA-40 temperature and pressure profiles,
2. the profiles are transformed to a common a priori (taken from the climatology used by the SCIAMACHY retrieval)xcand
ACPD
5, 911–936, 2005Intercomparison of O3 profiles
M. Palm et al.
Title Page
Abstract Introduction
Conclusions References
Tables Figures
◭ ◮
◭ ◮
Back Close
Full Screen / Esc
Print Version
Interactive Discussion
EGU 3. the retrievals of the ground based instruments are simulated using the
SCIA-MACHY retrieved profiles by
ˆ
xSIM =xc+AG(xˆS −xc), (13) where the index Gdenotes a quantity derived from the measurements of one of the ground based instruments BreRAM, RAM and FTIR. The indexS denotes a 5
quantity derived from the SCIAMACHY measurement.
In this work profiles are compared on a profile by profile basis. The relative mean deviation∆x ofN profiles is
∆x= N X
i=1
2∗( ˆxiG−xˆiSIM)
ˆ
xGi +xˆSIMi . (14)
In a second comparison it has been examined if the retrieved maximum of the O3-vmr is
10
at the same altitude in the compared retrievals. This test is very sensitive to differences in the a priori profile and differences in the height resolution of the instruments.
4.2. Comparison results SCIAMACHY – BreRAM
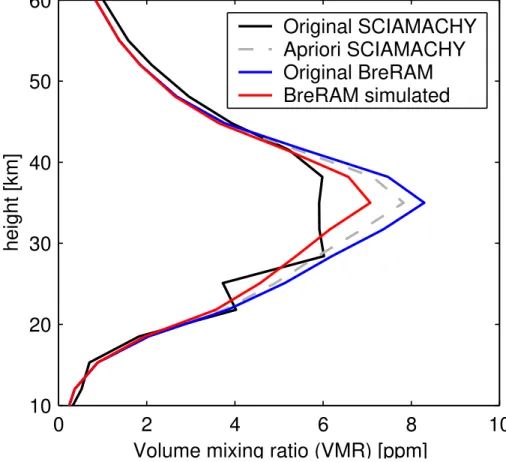
Between August 2002 and August 2003 64 collocations were found. After checking for the total O3 columns 30 coincident measurements were discarded.
1
The profiles 15
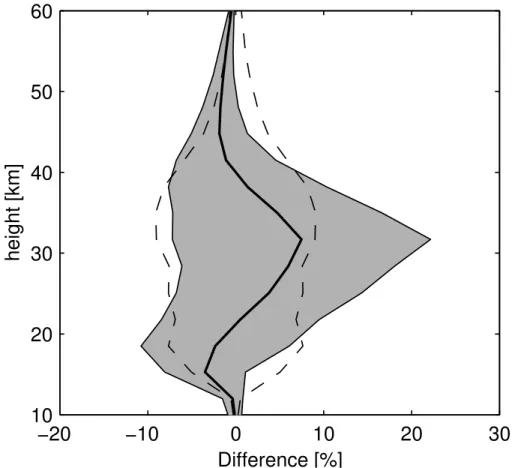
in Fig.2show a very good agreement of the shapes of the retrieved O3 profiles. The relative mean of the difference (Fig. 3) also shows a good agreement between the BreRAM and the SCIAMACHY profile. The relative mean deviation is smaller than 10% and is within the expected standard deviationS12of the comparison. The altitude of the
1
Increasing the number of coincident measurements by trajectory hunting methods (e.g.
ACPD
5, 911–936, 2005Intercomparison of O3 profiles
M. Palm et al.
Title Page
Abstract Introduction
Conclusions References
Tables Figures
◭ ◮
◭ ◮
Back Close
Full Screen / Esc
Print Version
Interactive Discussion
EGU maximum vmr is found in 75% of the retrievals (see Fig.4). However, the SCIAMACHY
retrieval tends to underestimate the vmr apart from the range 15–20 km.
It must be mentioned that the SCIAMACHY limb observations suffered from inac-cuate pointing for all the measurements used in this study. Tangent height offsets of up to 3 km were detected. The limb pointing is very accurate immiately after the daily 5
updates of the on-board orbit model. After these updates, the pointing slowly deviates from nominal pointing until the next update occurs. As a first order pointing correction a constant tangent height offset of 1.5 km was subtracted from the tangent heights prior to the inversion procedure. This implies, that tangent height offsets of up to 1.5 km have to be expected. These offsets basically lead to a retrieved O3 profile that is shifted by 10
the tangent height error (von Savigny et al.,2004).
4.3. Comparison results SCIAMACHY-RAM
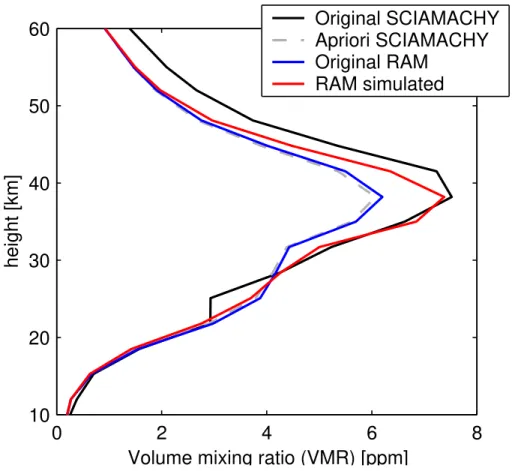
Between August 2002 and August 2003 95 collocations have been found. By applying the checks for the total O3column 60 coincident measurements were discarded.
The profiles in Fig.5show very good agreement in the shape of the profiles and the 15
vmr retrieved. The relative mean deviation is smaller than 15%, i.e. somewhat larger than for the SCIAMACHY-BreRAM comparison. Above 35 km SCIAMACHY retrieves vmr values higher than the RAM. The altitude of the maximum vmr is found in most of the cases.
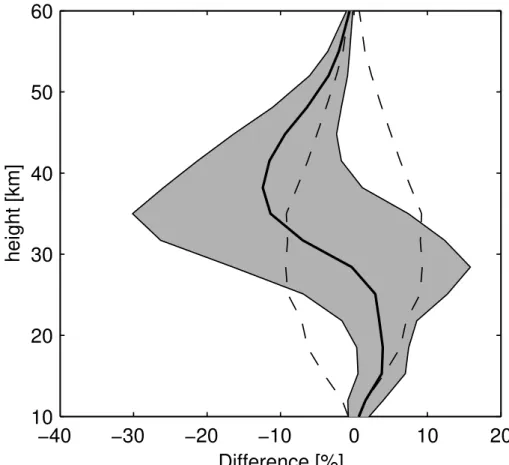
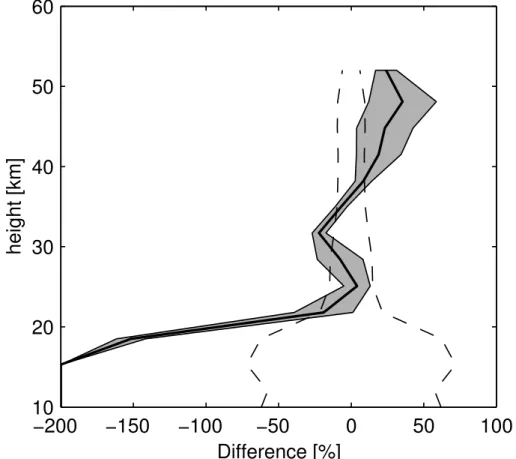
4.4. Intercomparison results SCIAMACHY-FTIR 20
In contrast to microwave spectroscopy solar absorption FTIR-spectra can only be ob-tained under clear sky conditions. This results in a lower number of coincident mea-surements. For this reson the conditions on the O3-column have been relaxed
(Ta-ble1).
From the initial 28 concident measurements 6 were discarded. The remaing coinci-25
ACPD
5, 911–936, 2005Intercomparison of O3 profiles
M. Palm et al.
Title Page
Abstract Introduction
Conclusions References
Tables Figures
◭ ◮
◭ ◮
Back Close
Full Screen / Esc
Print Version
Interactive Discussion
EGU August 2003. Due to the low number of coincident measurements the statistical
treat-ment presented in this study is not yet conclusive. However it is interesting to look at the preliminary results.
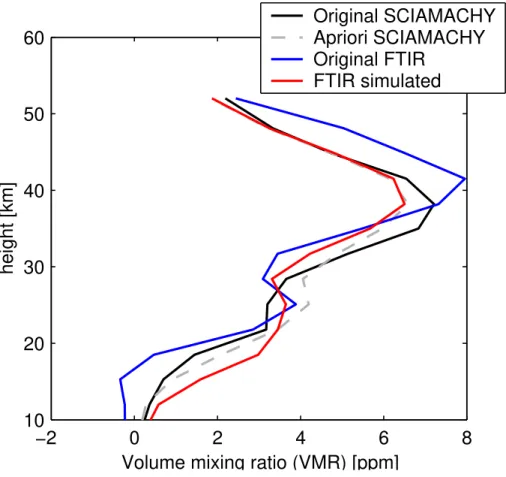
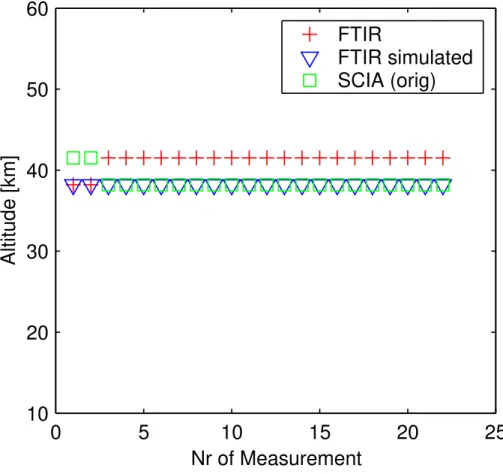
The general shape of the O3profiles agrees but the values of the retrieved vmr below
20 km differs significantly. From 20 km up to 50 km the relative mean deviation is still 5
quite high. The height of the maximum vmr is rarely found (Fig.10).
5. Conclusions
Comparisons of the high altitude resolution remote sounder SCIAMACHY with two ground based millimeter-wave sounders and a ground based FTIR sounder are shown. The comparability is ensured by constraints on the SCIAMACHY pixel in terms of 10
the total ozone column and the potential vorticity. The profiles retrieved from the SCIA-MACHY measurements and the millimeter wave measurements agree in shape as well as in height of the maximum vmr. The differences in the retrieved vmr are in the range of the expected standard deviation of the comparison except above 35 km in case of the RAM. The coincident measurements with the FTIR instrument are very sparse so 15
that it is difficult to compare them properly. The general shape of the profile is found but the altitude of the maximum as well as the retrieved vmr profiles differ.
The statistical basis for the intercomparison of this study is still quite small. However, the statistical basis is expected to improve with the lifetime of the SCIAMACHY instru-ment. Newer millimeter wave instruments like RAMAS on Greenland (Golchert et al., 20
2004) will contribute more coincident measurements and improve the quality of the comparison because of their better altitude resolution (expected 10 km over a range of 20 to 45 km).
Acknowledgements. We would like the Alfred Wegener Institute Bremerhaven for providing the infrastructure to carry out millimeter-wave and FTIR measurements at Ny Alesund,
Spitsber-25
ACPD
5, 911–936, 2005Intercomparison of O3 profiles
M. Palm et al.
Title Page
Abstract Introduction
Conclusions References
Tables Figures
◭ ◮
◭ ◮
Back Close
Full Screen / Esc
Print Version
Interactive Discussion
EGU
For providing the data of total O3columns we thank the NASA Goddard Space Flight Center. This work has been funded by the DLR.
References
Barret, B., Mazi `ere, M. D., and Demoulin, P.: Retrieval and characterization of ozone pro-files from solar infrared spectra at the Jungfraujoch, J. Geophys. Res., 107(D24), 4788,
5
doi:10.1029/2001JD001298, 2002. 915
Bovensmann, H., Burrows, J. P., Buchwitz, M., Frerick, J., No ¨el, S., Rozanov, V. V., Chance, K. V., and Goede, A. P. G.: SCIAMACHY: Mission Objectives and Measurement Modes, J. Atmos. Sci., 56, 127–150, 1999. 913
Brown, L., Gunson, M., Toth, R., Irion, F., Rinsland, C., and Goldman, A.: The 1995 atmospheric
10
trace molecule spectroscopy (ATMOS) linelist, Appl. Opt., 35, 2828–2848, 1996. 915
Danilin, M., Ko, M., Froidevaux, L., Santee, M., Lyjak, L., Bevilacqua, R., Zawodny, J., Sasano, Y., Irie, H., Kondo, Y., Russel III, J., Scott, C., and Read, W.: Trajectory hunting as an ef-fective technique to validate multiplatform measurements: Analysis of the MLS, HALOE, SAGE-II, ILAS, and POAM data October-November 1996, J. Geophys. Res., 107(D20),
15
4420, doi:10.1029/2001JD002012, 2002. 920
Farman, J., Gardiner, B., and Shanklin, J.: Large losses of total ozone in Antarctica reveal seasonal ClOx/NOx interaction, Nature, 315, 207–210, 1985. 912
Flittner, D. E., Bhartia, P. K., and Herman, B. M.: O3profiles retrieved from limb scatter mea-surements, Geophys. Res. Lett., 27, 2061–2064, doi:10.1029/1999GL011343, 2000. 913
20
Golchert, S., Buschmann, N., Kleindienst, A., Palm, M., K ¨unzi, K., Notholt, J., de la N ¨oe, J., Schneider, N., Sorensen, H., Gross, A., and Chipperfield, M.: Comissioning of the new Ground-Based Microwave Radiometer RAMAS at Summit, Greenland, Poster presenta-tion at the Microrad04 conference in Rom, Italy, http://www.ram.uni-bremen.de/pdf poster/
poster rome-microrad04 ramas.pdf, 2004. 922
25
Kaiser, J. W., Rozanov, V. V., and Burrows, J. P.: Fast weighting functions for retrievals from limb scattering measurements, JQSRT, 77, 273–283, 2003. 914
Lamsal, L., Weber, M., Tellmann, S., and Burrows, J.: Ozone column classified climatology of ozone and temperature profiles based on ozonesonde and satellite data, J. Geophys. Res., 109, doi:10.1029/2004JD004680, 2004. 919
ACPD
5, 911–936, 2005Intercomparison of O3 profiles
M. Palm et al.
Title Page
Abstract Introduction
Conclusions References
Tables Figures
◭ ◮
◭ ◮
Back Close
Full Screen / Esc
Print Version
Interactive Discussion
EGU
Langer, J.: Measurements of Arctic stratospheric ozone: Comparison of ozone-measurements at Ny-Alesund, Spitsbergen, in 1997 and 1998, PhD thesis, University of Bremen, in German, 1999. 915,920
McPeters, R. D., Janz, S. J., Hilsenrath, E., Brown, T. L., Flittner, D., and Heath, D.: The retrieval of O3profiles from limb scatter measurements: Results from the Shuttle Ozone Limb
Sound-5
ing Experiment, Geophys. Res. Lett., 27(17), 2597–2600, doi:10.1029/1999GL011342, 2000. 913
Notholt, J.: The moon as light source for FTIR measurements of stratospheric trace gases during the polar night: Application for HNO3 in the Arctic, J. Geophys. Res., 99, 3607–3614, 1994. 915
10
Notholt, J. and Schrems, O.: Ground-based FTIR measurements of vertical column densities of several trace gases above Spitzbergen, Geophys. Res. Lett., 21, 1355–1358, 1994. 915
Pougatchev, N. S., Connor, B. J., and Rinsland, C. P.: Validation of ozone profile retrievals from ground-based solar spectra, Geophys. Res. Lett., 23(13), 1637–1640, 1996. 915
Rex, M., Salawitch, R., von der Gathen, J. P., Harris, N., Chipperfield, M., and
Nau-15
jokat, B.: Arctic ozone loss and climate change, Geophys. Res. Lett., 31, L04 116, doi:10.1029/2003GL018844, 2004. 912
Rinsland, C. P., Jones, N. B., Connor, B. J., et al.: Northern and southern hemisphere ground-based infrared spectroscopic measurements of tropospheric carbon monoxide and ethane, J. Geophys. Res., 103(D21), 28 197–28 217, 1998. 915
20
Rodgers, C. D.: Inverse methodes for atmospheric sounding, vol. 2 of Series on Atmospheric, Oceanic and Planetary Physics, World Scientific, 2000. 914,916
Rodgers, C. D. and Connor, B. J.: Intercomparison of remote sounding instruments, J. Geo-phys. Res., 108, doi:10.1029/2002JD002299, 2003. 912,913,916,918
Toon, G. C., Blavier, F.-F., Sen, B., Salawitch, R. I., Ostermann, G. B., Notholt, J., Rex, M.,
25
McElroy, G. T., and Russell III, M.: Ground-based observations of Arctic O3 loss during spring and summer 1997, J. Geophys. Res., 104, 26 497–26 510, 1999. 915
von Savigny, C., Haley, C. S., Sioris, C. E., et al.: Stratospheric Ozone Profiles retrieved from Limb Scattered Sunlight Radiance Spectra Measured by the OSIRIS Instrument on the Odin Satellite, Geophys. Res. Lett., 30, doi:10.1029/2002GL016401, 2003. 913
30
ACPD
5, 911–936, 2005Intercomparison of O3 profiles
M. Palm et al.
Title Page
Abstract Introduction
Conclusions References
Tables Figures
◭ ◮
◭ ◮
Back Close
Full Screen / Esc
Print Version
Interactive Discussion
EGU
ACPD
5, 911–936, 2005Intercomparison of O3 profiles
M. Palm et al.
Title Page
Abstract Introduction
Conclusions References
Tables Figures
◭ ◮
◭ ◮
Back Close
Full Screen / Esc
Print Version
Interactive Discussion
EGU
Table 1.Limitsm0andd0for the intercomparison of SCIAMACHY with different ground based instruments.
m0 d0
BreRAM 5% 10%
RAM 5% 10%
ACPD
5, 911–936, 2005Intercomparison of O3 profiles
M. Palm et al.
Title Page
Abstract Introduction
Conclusions References
Tables Figures
◭ ◮
◭ ◮
Back Close
Full Screen / Esc
Print Version
Interactive Discussion
EGU
0
10
20
30
40
10
20
30
40
50
60
Standart deviation [%]
height [km]
Variance direct comparison
Variance simulated comparison
Variance of the BreRAM profile
ACPD
5, 911–936, 2005Intercomparison of O3 profiles
M. Palm et al.
Title Page
Abstract Introduction
Conclusions References
Tables Figures
◭ ◮
◭ ◮
Back Close
Full Screen / Esc
Print Version
Interactive Discussion
EGU
0
2
4
6
8
10
10
20
30
40
50
60
height [km]
Volume mixing ratio (VMR) [ppm]
Original SCIAMACHY
Apriori SCIAMACHY
Original BreRAM
BreRAM simulated
ACPD
5, 911–936, 2005Intercomparison of O3 profiles
M. Palm et al.
Title Page
Abstract Introduction
Conclusions References
Tables Figures
◭ ◮
◭ ◮
Back Close
Full Screen / Esc
Print Version
Interactive Discussion
EGU
−20
−10
0
10
20
30
10
20
30
40
50
60
height [km]
Difference [%]
Fig. 3. Relative mean difference∆x (see Formula14) BreRAM to SCIAMACHY. The shaded
area is the standard deviation of∆xand the dashed line denotes the standard deviation of the
ACPD
5, 911–936, 2005Intercomparison of O3 profiles
M. Palm et al.
Title Page
Abstract Introduction
Conclusions References
Tables Figures
◭ ◮
◭ ◮
Back Close
Full Screen / Esc
Print Version
Interactive Discussion
EGU
0
10
20
30
40
10
20
30
40
50
60
Nr of Measurement
Altitude [km]
BreRAM
BreRAM simulated
SCIA (orig)
ACPD
5, 911–936, 2005Intercomparison of O3 profiles
M. Palm et al.
Title Page
Abstract Introduction
Conclusions References
Tables Figures
◭ ◮
◭ ◮
Back Close
Full Screen / Esc
Print Version
Interactive Discussion
EGU
0
2
4
6
8
10
20
30
40
50
60
height [km]
Volume mixing ratio (VMR) [ppm]
Original SCIAMACHY
Apriori SCIAMACHY
Original RAM
RAM simulated
ACPD
5, 911–936, 2005Intercomparison of O3 profiles
M. Palm et al.
Title Page
Abstract Introduction
Conclusions References
Tables Figures
◭ ◮
◭ ◮
Back Close
Full Screen / Esc
Print Version
Interactive Discussion
EGU
−40
−30
−20
−10
0
10
20
10
20
30
40
50
60
height [km]
Difference [%]
Fig. 6. Relative mean difference∆x (see Formula14) RAM to SCIAMACHY. The shaded area
is the standard deviation of ∆x and the dashed line denotes the standard deviation of the
ACPD
5, 911–936, 2005Intercomparison of O3 profiles
M. Palm et al.
Title Page
Abstract Introduction
Conclusions References
Tables Figures
◭ ◮
◭ ◮
Back Close
Full Screen / Esc
Print Version
Interactive Discussion
EGU
0
10
20
30
40
10
20
30
40
50
60
Nr of Measurement
Altitude [km]
RAM
RAM simulated
SCIA (orig)
ACPD
5, 911–936, 2005Intercomparison of O3 profiles
M. Palm et al.
Title Page
Abstract Introduction
Conclusions References
Tables Figures
◭ ◮
◭ ◮
Back Close
Full Screen / Esc
Print Version
Interactive Discussion
EGU
−2
0
2
4
6
8
10
20
30
40
50
60
height [km]
Volume mixing ratio (VMR) [ppm]
Original SCIAMACHY
Apriori SCIAMACHY
Original FTIR
FTIR simulated
ACPD
5, 911–936, 2005Intercomparison of O3 profiles
M. Palm et al.
Title Page
Abstract Introduction
Conclusions References
Tables Figures
◭ ◮
◭ ◮
Back Close
Full Screen / Esc
Print Version
Interactive Discussion
EGU
−200
−150
−100
−50
0
50
100
10
20
30
40
50
60
height [km]
Difference [%]
Fig. 9. Relative mean difference∆x (see Formula14) FTIR to SCIAMACHY. The shaded area
is the standard deviation of ∆x and the dashed line denotes the standard deviation of the
ACPD
5, 911–936, 2005Intercomparison of O3 profiles
M. Palm et al.
Title Page
Abstract Introduction
Conclusions References
Tables Figures
◭ ◮
◭ ◮
Back Close
Full Screen / Esc
Print Version
Interactive Discussion
EGU