DE-STRIPING FOR TDICCD REMOTE SENSING IMAGE BASED ON
STATISTICAL FEATURES OF HISTOGRAM
Hui-ting Gao,Wei Liu, Hong-yan He,Bing-xian Zhang,Cheng Jiang
Beijing Institute of Space Mechanics & Electricity, Beijing 100094, China-(gaohuiting_1100, liuwbee,)@126.com, [email protected],[email protected],[email protected]
Commission I, WG I/4
KEY WORDS: Statistical Features of Histogram ; De-striping; Histogrammic Centroid; Correlation Coefficient; Automatic Cloud Detection; Non-uniformity
ABSTRACT:
Aim to striping noise brought by non-uniform response of remote sensing TDI CCD, a novel de-striping method based on statistical features of image histogram is put forward. By analysing the distribution of histograms,the centroid of histogram is selected to be an eigenvalue representing uniformity of ground objects,histogrammic centroid of whole image and each pixels are calculated first,the differences between them are regard as rough correction coefficients, then in order to avoid the sensitivity caused by single parameter and considering the strong continuity and pertinence of ground objects between two adjacent pixels,correlation coefficient of the histograms is introduces to reflect the similarities between them,fine correction coefficient is obtained by searching around the rough correction coefficient,additionally,in view of the influence of bright cloud on histogram,an automatic cloud detection based on multi-feature including grey level,texture,fractal dimension and edge is used to pre-process image.Two 0-level panchromatic images of SJ-9A satellite with obvious strip noise are processed by proposed method to evaluate the performance, results show that the visual quality of images are improved because the strip noise is entirely removed,we quantitatively analyse the result by calculating the non-uniformity ,which has reached about 1% and is better than histogram matching method.
1. INTRODUCTION
Stripe noises of TDI-CCD image is the phenomenon of gray value stochastic change along the array when illuminated by the same uniform light source,the essence of this phenomenon is caused by response non-uniformity of sensors during imaging.Stripe noises influence the quality and quantitative application of image products.Removing stripe noise is accomplished by relative radiometric correction.
At present, there are two kinds of de-striping methods: the radiometric calibration method and the scene statistic method (Cao Juliang,2004a). The radiometric calibration method makes use of the calibration equipment onboard such as the solar diffuser board or the calibration lamp to achieve relative radiation calibration. Radiometric calibration has high precision and frequency. The scene statistic method includes histogram matching based on a mass of raw images and moment matching method based on scenery each. Histogram matching establish histogram look up table for each pixel by large numbers of images(Guo Jianning,2005a),the requests for statistical images are: random choice covering dynamic range; percent of cloud coverage is less than 20%,all kinds of ground objects must be involved(Pan Zhiqiang,2005a).The precision of histogram matching method is related to human factors. The moment matching method makes use of the conception that distribution of gray level is similar for each pixel, on the assumption that mean and variance radiation of each pixel is equal approximatively,the correction is realized by adjust static mean and variance through mean value compensation method、
Fourier transformation method or correlation method(Li Haichao,2011a). The moment matching method request the consistency of ground objects severely(Liu Zhengjun,2002a). The proposed method for de-striping is based on character of histogram statistics, by contrast with moment matching method, the precision is improved by increasing amount of statistical character,furthermore,in order to avoid cloud
influence, a spatial preprocessing with cloud detection is introduced,which improves the precision and applicability.
2. PRINCIPLE AND MODEL
2.1 Histogram statistical principle
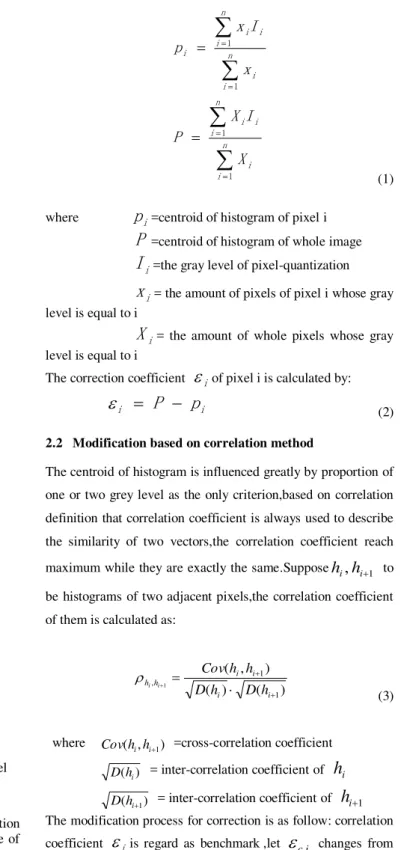
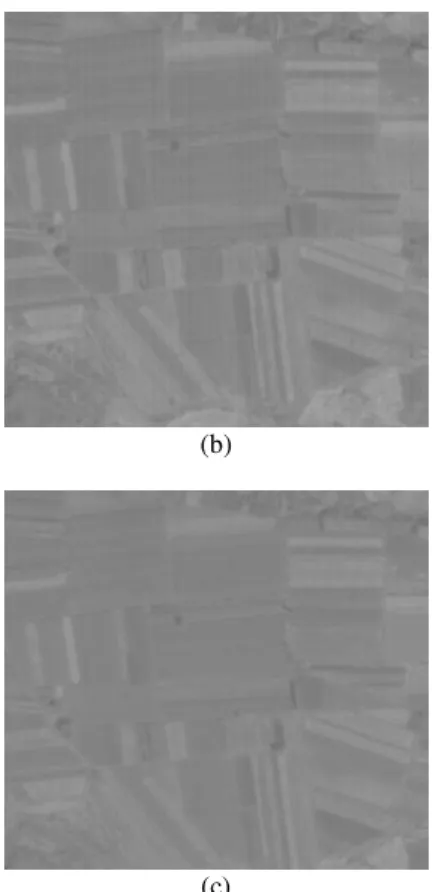
The gray level is continuous for symmetrical ground objects(Figure 1(a)),so the shape of each pixel and whole pixels is alike if the amount of row is big enough(Figure 1(b)、Figure 1(c)、Figure 1(d)).It has been recognized that the content of highest grey level is bring by objects with high reflectance such as cloud and snow,on the contrary, the content of lowest grey level with low reflectance such as water.
(a)
(b)
(c)
(d)
Figure 1 (a) one 0-level panchromatic images of SJ-9A satellite,(b) histogram of whole image,(c)histogram of pixel
2000,(d)histogram of pixel 3800
The shape of histogram distribution is invariant but has motion of translation,which is caused by obvious grey level change of mosaic area. The centroid of histogram is introduced to represent this difference,which can be written as:
n i i n i i i n i i n i i i iX
I
X
P
x
I
x
p
1 1 1 1 (1)where
p
i=centroid of histogram of pixel iP
=centroid of histogram of whole imagei
I
=the gray level of pixel-quantizationi
x
= the amount of pixels of pixel i whose gray level is equal to ii
X
= the amount of whole pixels whose gray level is equal to iThe correction coefficient
iof pixel i is calculated by: ii
P
p
(2)2.2 Modification based on correlation method
The centroid of histogram is influenced greatly by proportion of one or two grey level as the only criterion,based on correlation definition that correlation coefficient is always used to describe the similarity of two vectors,the correlation coefficient reach maximum while they are exactly the same.Suppose
h
i,
h
i1 to be histograms of two adjacent pixels,the correlation coefficient of them is calculated as:) ( ) ( ) , ( 1 1 , 1 i i i i h h h D h D h h Cov i i (3)
where Cov(hi,hi1) =cross-correlation coefficient )
(hi
D = inter-correlation coefficient of
h
i) (hi1
D = inter-correlation coefficient of
h
i1 The modification process for correction is as follow: correlation coefficient
iis regard as benchmark ,let
c,i changes from
i
to
i
and compute the correlation coefficienti c i
i h
h, 1,,
,whilei c i
i h
h, 1,,
reach the maximal,it means thathistograms of adjacent pixels are coherent,the responding
c,i is as refine correlation,the basic principle is:
c,i
i
,
i
hihi ci
i
c , 1, ,
1
,
max
(4)
where
h
i=histogram of pixel ii c
i
h
,
, 1
=histogram of pixel i+1 with shift
c,i)
(
1
x
is inverse mapping of
(
x
)
.(a)
(b)
Figure 2 (a)result of correlation search,(b) comparision of histogram before(left) and after refine correction(right) The histogrammic contrast before and after refine correlation is shown in Figure 2. The grey level offset based on the correlation search is -2(Figure 2(a)). The two histograms are nearlycoincident after refine correction(Figure 2(b)).
To the whole image,histogram of pixel one is regard as a first standard,histogram of pixel two matchs with it,then standard changes to histogram of pixel two, histogram of pixel three matchs with it,the rest pixels are processed in the same manner one by one.
2.3 Image filtering based on cloud detection
Cloud noises do not have any information of ground objects,but it changes the grey level distribution of real ground objects with large influence on mean、variance and histogram,which is the
common question of scene statistic methods(YAN Yu-song,2010a).The histogram distribution of pixel covered by cloud is altered with right shift of histogram(Figure 3).
(a)
(b)
(c)
Figure 3 (a) 0-level panchromatic images of SJ-9A satellite(2014-10-14,Laos),(b)histogram of pixel 2000,(c)
histogram of pixel 7000
The gray level includes mean、variance、difference and entropy.
The texture expresses spatial distribution rule of the inner hue. Gray level cooccurrence matrix is establishd by spatial information of relative position. Each element of gray level co-occurrence matrix p is calculated as:
S
n
y
x
f
m
y
x
y
x
n
m
p
#
)
,
(
&
,
,
,
#
)
,
(
1 1 2 2
2 2
(5)
Where S is the set of pixel pairs with given spatial linkage in target area R, numerator is the amount whose gray level is m and n,denominator is the total amount of pixel pairs.Text descriptors based on the gray level co-occurrence matrix include angular second moment、contrast、correlation and entropy. The fractal model is a facility to describe complex image with irregular shape.The cloud of remote sensing image has self-similarity,which is irregular as a whole but regular in different scale, satisfying the fractal geometric feature.The 2D image is regard as a surface of 3D space
))
,
(
,
,
(
x
y
f
x
y
,wheref
(
x
,
y
)
is the gray level of position(
x
,
y
)
.The fractal dimention is obtain by by different scale analysis. The image with size ofM
M
is divided into several image block with size ofr
r
,each image block is turn into box with size ofr
r
h
,where h is the height of box,h
[
r
G
/
M
]
,G is the total amount of gray level. The box is numbered from 1 to k, suppose the maximum and minimum of image block(
i
,
j
)
belong to box l and k respectively, the box amount of covering all the gray level of image block(
i
,
j
)
is :1
)
,
(
i
j
l
k
n
r(6) So the box amount covering the whole image:
j i
r
r
n
i
j
N
,)
,
(
(7)The fractal dimension is:
)
/
1
log(
)
log(
lim
0r
N
D
r r
(8)wherelog(1/
r
) and log(Nr)are as abscissa and ordinate separately, the slop of fitting line is fractal dimention after linear least squares fitting.By contrast to ground objects such as mountains、cities an so on,the edge of cloud is blur,the change of gradient is slow,and the edge character of different directions are similar.The edge detection of image H based on Sobel:
H
G
x
1
0
1
2
0
2
1
0
1
H
G
y
1
0
1
2
0
2
1
0
1
(9)where
G
x=edge in x directiony
G
=edge in y direction Two features of the edge are calculated as:2 2
y
x
G
G
G
)
arctan(
x yG
G
(10)where
G
= amplitude of edge
= direction of edgeThe histogram of
is obtained by sum theG
:
1 0 1 0)
,
,
(
)
,
(
)
(
M m N ni
n
m
I
n
m
G
i
Hs
(11) where L i L i n m L i L i n m i n m I ) 1 ( , ) , ( , 0 ) 1 ( , ) , ( , 1 ) , , (L=amount of intervals
The maximum、mean of
G
and the maximum、deviation ofHs
describe edge characters.To summarize,an eigenvector include thirteen values as the criterion.
Support Vector Machine(SVM) is adopt to realize automatic classification. SVM transform the low-dimensional nonlinear question into low-dimensional linear question though kernel function,obtaining global optimal solution by virtue of quadratic form.
2.4 Processing flow
The processing flow is broken down into three steps: First is automatic cloud detection comprising multi-features extraction and SVM classification;
Automatic cloud detection
per-pixel histogram
whole image histogram 0-level
image
rough correction based on centroid
refine correction based on correlation
correctting image
Figure 4 processing flow chat
3. METHODOLOGICAL TEST
We use two 10000 12288 size test images acquired by anchromatic camera with array length of 12288 of SJ-9A satellite which was launched in October 2012, the spatial resolution of panchromatic camera is 2.5m.
The size of fundamental sub-image for cloud detection is
64
64 . A trainning sets that comprises around 100 sub-images represented ground objects or different kinds of cloud have been constructed for classification.Linear kernel is select to perform SVM training.
One image mentioned in section 2.1 was obtained on October 10,2014 over Beijing area.There are no cloud noise in this image.The visual quality is improved obviously by contrast local detail of origin and processed image,the strip noise has been removed basically.
(a)
(b)
(c)
Figure 5 (a)image after correction(b)local detail before correction(c) local detail after correction The other image was obtained on September 9,2014 over Laos.The results of cloud detection are marked by red squares(Figure6).
Figure 6 cloud detection
Figure 7shows the relative radiometric correction result. The proposed method removes the stripe noise,at the same time it preserves the detail(Figure 7(a)).By contrast,the processed result of moment matching method is seriously influenced by
5.4%.The non-uniformity of this image processed by histogram matching method is 1.28%.By contrast,we can say the proposed method has better result.
(a)
(b)
Figure 7 (a)image with proposed method applied,(b) image with moment matching method applied
(a)
(b)
Figure 8 (a)local detail beforecorrection(b) local detail after correction
4. CONCLUSION
A new de-striping method based on statistical characters of histogram is proposed. Distribution of stripe noise is analysed, centroid of histogram as rough correction coefficient is calculated by difference,the presicion of correction based on single correction coefficient is improved by modification based on correlation search,the influence on applicability of correction caused by local cloud noise is eliminated through automatic cloud detection, final tests demonstrate the application capability of proposed method.
ACKNOWLEDGEMENTS
This work was supported by the National Science and Technology Major Project of China: High Resolution Earth Observation System No.30-Y20A02-9003-15/16 and No. 50-Y20A08-0508-15/16
REFERENCES
Cao Juliang,Lv Haibao,Tan Xiaobo,et,al, 2004a.Histogram Modification Methods Without Image Details Losing. Journal of Image and Graphics, 9(5),pp.631-635
Guo Jianning,Yu Jin,Zeng Yong,et,al,2005a.Research on Relative radiation correction of CCD of CBERS-01/02.Science in CHINA (Series E),35(z1),pp.11-25
Pan Zhiqiang,Gu Xingfa,Liu Guodong,et,al,2005a.Relative Radiometric Correction of CBERS-01 CCD Data Based on Detector Histogram Matching.Geomatics and Information Science of Wuhan University,30(10),pp.925-927.
Li Haichao,Hao Shengyong,2011a. A Relative Radiometric Correction Method for the Scanning Image of Pushbroom Satellite,38(1),pp.142-150.
Liu Zhengjun,Wang Changyao,Wang Cheng,2002a.Destriping Imaging Spectrometer Data by an Improved Moment Matching Method.Journal of Remote Sensing6(4),pp.279-284
YAN Yu-song,Long Teng,2010a.Real_-Time Cloud Detection in Optical Remote Sensing Image.Transactions of Beijing Institute of Technology,30(7),pp.817-821
Guo Hongtao,Xie Huanhuan,Ma Ying,et,al,2012a.Analysis of cloud phase based on support vector machine.Journal of PLA University of Science and Technology,13(2),pp.226-231