Ca
2
+
Signals
Gregor Moenke1, Martin Falcke1, Keven Thurley1,2*
1Mathematical Cell Physiology, Max Delbru¨ck Center for Molecular Medicine, Berlin, Germany,2Institute for Theoretical Biology, Charite´ Universita¨tsmedizin, Berlin, Germany
Abstract
Important biological processes like cell signalling and gene expression have noisy components and are very complex at the same time. Mathematical analysis of such systems has often been limited to the study of isolated subsystems, or approximations are used that are difficult to justify. Here we extend a recently published method (Thurley and Falcke, PNAS 2011) which is formulated in observable system configurations instead of molecular transitions. This reduces the number of system states by several orders of magnitude and avoids fitting of kinetic parameters. The method is applied toCa2z
signalling.Ca2z is a ubiquitous second messenger transmitting information by stochastic sequences of concentration
spikes, which arise by coupling of subcellularCa2zrelease events (puffs). We derive analytical expressions for a mechanistic Ca2z model, based on recent data from live cell imaging, and calculate
Ca2z spike statistics in dependence on cellular
parameters like stimulus strength or number ofCa2z channels. The new approach substantiates a genericCa2z model,
which is a very convenient way to simulateCa2zspike sequences with correct spiking statistics.
Citation:Moenke G, Falcke M, Thurley K (2012) Hierarchic Stochastic Modelling Applied to Intracellular Ca2+Signals. PLoS ONE 7(12): e51178. doi:10.1371/
journal.pone.0051178
Editor:Jordi Garcia-Ojalvo, Universitat Politecnica de Catalunya, Spain
ReceivedJuly 30, 2012;AcceptedOctober 30, 2012;PublishedDecember 27, 2012
Copyright:ß2012 Moenke et al. This is an open-access article distributed under the terms of the Creative Commons Attribution License, which permits unrestricted use, distribution, and reproduction in any medium, provided the original author and source are credited.
Funding:GM was supported by the German Research Foundation funded graduate school GRK 1772: http://www2.hu-berlin.de/biologie/theorybp/index. php?goto = PhD%20program%20CS. The funders had no role in study design, data collection and analysis, decision to publish, or preparation of the manuscript.
Competing Interests:The authors have declared that no competing interests exist.
* E-mail: [email protected]
Introduction
The molecular state transitions and interactions inside cells forming pathways and functional units are inherently random [1– 3]. Some cellular subsystems involve sufficiently large molecule numbers to be well described by deterministic mean field dynamics, but many are best described as stochastic processes. Additionally, cells show considerable heterogeneity even within clonal populations. Biological noise and cell-to-cell variability have been identified and studied in chemotaxis [4], gene expression [5], cell signalling [6–8] and cell differentiation [9,10]. A variety of mathematical strategies can be used to analyse these stochastic dynamical systems, including approximation techniques such as Langevin and Fokker-Planck Equations [11,12], and exact methods like the chemical master equation or its simulation by the Gillespie algorithm [13]. Approximation techniques are often based on the assumption of Gaussian white noise, which is only valid for large copy-numbers of identical components and fluctuations which are small compared to the mean value. However, in biological processes like gene expression [1] or
Ca2z
dynamics [14,15], the change of state of a single molecule may have a huge impact on systems dynamics (see also [16]). To describe such systems without rough approximations, we recently developed a new modelling framework based on emergent behaviour of biomolecules [17–19].
Ca2z
is a ubiquitous second messenger transmitting informa-tion in many cases by repetitive cytosolic concentrainforma-tion spikes [14,15,18]. An important class of Ca2z
signals is mediated by Inositol-1,4,5-trisphosphate (IP3 ), which is produced in response
to hormonal activation of cell surface receptors [14,15].IP3then bindsIP3 receptors (IP3Rs) in the endoplasmic reticulum (ER) and thus sensitises them for activation by Ca2z
. IP3Rs are organised as clusters of about 1 to 20IP3R molecules [20–22]. ActiveIP3Rsact asCa2zchannels, releasingCa2zions from the ER lumen into the cytosol. Upon sensitisation byIP3 they are successively activated by Ca2z
-induced Ca2z
release (CICR). This mechanism is based on the opening probability of IP3Rs, which increases with the local Ca2z
concentration, up to a threshold value where further increase of theCa2z
concentration becomes inhibitory [23,24]. The outflux ofCa2z
eventually stops either because of depletion of the ERCa2z
stores or the threshold
½Ca2z
for channel inhibition is reached. Sarco-endoplasmic reticulum Ca2z
ATPases pump Ca2z
back into the ER after release. The transient increases in cytosolic ½Ca2z
trigger downstream effects like activation of protein kinase C [15,25]. The clustering ofIP3Rsimplies that global cell-wideCa2zsignals result from a hierarchic cascade of single channel opening (‘blips’) over cluster opening (‘puffs’) to opening of several clusters (‘wave’ or ‘spike’), which arise when open clusters open neighbouring clusters due to Ca2+ diffusion and CICR. This cascade is well characterised by live cell imaging and mathematical modelling studies [14,15]. We and others have recently demonstrated that cellularCa2z
signals are repetitive stochastic events [6,18,26,27], although at certain conditions they appear regular and have long been analysed with deterministic mathematical models [28,29].
Thus, theCa2z
intracellularCa2z
signalling, what are the experimental observa-tions such a theory should explain? Ca2z
spike sequences are random with average interspike intervals (ISI) from a few tens of seconds to hundreds of seconds. Due to this random spiking, simulation of individual time series of theCa2z
concentration is less meaningful than with deterministic limit cycle oscillators. There are, however, well defined properties of the stochastic sequences characterising the system. The moment relation between the standard deviations and the averageTav of ISI is linear with a positive slope between 0.2 and 1 [6], the slope of the moment relation of individual cells agrees with the population relation [30,31], i.e. it is robust against cell-to-cell variability and cell type specific [32]. These results were established by single cell experiments with astrocytes, microglia, PLA stem cells and HEK cells [6]. The ISI obey simple two-parameter distributions [6]. Weakening spatial coupling between IP3R clusters by Ca2z buffers like EGTA destroys cellular spikes and any variation of
Ca2z
signalling on their time scale [27]. Therefore, a mechanistic theory should be able to explain the emergence of cellular spiking on the basis of cluster properties and cluster coupling only. Moreover, the theory should link the statistical properties to biological parameters like stimulation strength and buffer concen-trations.
We can meet all those requirements by an approach called hierarchic stochastic modelling [17]. What is measuredin vivocan be correctly described only by waiting-time probabilities since it represents transitions between observable states like ‘open’ or ‘closed’ of a specificIP3Rcluster. Hierarchic stochastic modelling deals with waiting-time probabilities for state-changes in a reduced state-space. The reduction of the state space focuses on functional or observational aspects of the system. In contrast the full state space contains all biochemically possible states of the involved molecules. Their dynamics can then be described by rate laws yielding the usual chemical master equation. To avoid computa-tional overhead by computing non observable state transitions and facilitate analytic solutions, all microscopic states corresponding to one function (e.g. for an ion channel ‘open’) are subsumed into one observable state. The set of all observable states forms the reduced state-space. This entails non-exponential waiting-time probabilities instead of rate-laws for the description of transitions between the observable states.
Here, we develop a convenient solution technique for hierarchic stochastic systems by the Laplace transform, which directly leads to analytical expressions for statistical properties of important system variables. Moreover, we present a minimal mechanistic model for stochasticCa2z
spikes based on recent data from live cell imaging. We provide analytic approximations for the dependence of system statistics on biological parameters. Finally, based on the observation of a very robust time scale separation in the mechanistic model, we find a surprisingly convenient description of Ca2z
spike statistics, which is in excellent agreement with mechanistic models and with experimental data.
Results
CellularCa2z
dynamics is a multiscale stochastic process driven by huge gradients in the cytosolic Ca2z
concentration, and detailed computer simulations are difficult to implement and time-consuming [14,32]. A concise, analytically treatable mechanistic model was published only recently by two of us [17]. In the following, we start by explaining the method that made this possible and presenting an extension to the method, which is solution by Laplace transform of generalised exponential distri-butions. After that, we construct the input data required for the
modelling approach in terms of analytical functions of cellular parameters. The third section analyzes a minimal mechanistic
Ca2z
model, which allows for analytical solutions and and elucidates the role of a global negative feedback. Finally, based on that analysis, we present a proper derivation of a very simple description of stochastic Ca2z
dynamics called generic model, which very nicely describes the experimentalCa2z
spike statistics.
Hierarchic Stochastic Modelling Analysed by the Laplace Transform
The traditional formulation of a stochastic model starts from the state transitions of theIP3Rsubunits [14]. In most single channel models [33], three binding sites are assumed for each of the four subunits, one activating and one inhibiting site forCa2z
and one site forIP3. A complete stochastic description determines the time course of the probability for each system state. Their dynamics are described by the master equation [11].
L LtP
j i(t)~
XN
l~1
qliPjl(t){qilPji(t)
h i
: ð1Þ
N is the number of system states (N~? is possible) and Pji(t)~P(i,tDj,0)is the conditional probability that the system is in
stateiat timetconditioned by being in statejat timet~0. Theqil
are the rates for state transitionsi?l(see Table 1 for a summary of the notation). Figure 1A illustrates the state scheme of a hypothetical receptor channel molecule x with only four states
x1,. . .,x4 (3 closed states, 1 open state). This case can easily be treated directly by Eq. 1. However, if we consider several interacting molecules with more than 100 possible states each, like those in typical ion channels [33–35], Eq. 1 becomes intractable due to the large number of system states.
When describing a biological system with a mathematical model, we are often not interested in all the molecular details, but rather in few states that are accessible to experimental quantifi-cation or are important for system function. In the case ofCa2z
dynamics the main question is whether the channel is closed or not, and not which of the many possible closed states it is in. Nevertheless, the channel state depends on the dynamics between all its closed states, such that a rigorous treatment demands the inclusion of all possible microscopic state changes into Eq. 1. We circumvent state space explosion by lumping microscopic states belonging to the same observable state (Fig. 1B). Consider stochastic transitions between observable system states Sl, each representing a set of microscopic system states. Because a sequence of microscopic transitions occurs between two consecutive transitions, each transition Sl?Sk is not governed by a simple rate-law with exponentially distributed waiting-time, as in Eq. 1. The sequence of microscopic transitions causes a non-exponential waiting time distribution (Fig. 1C). These waiting time distribu-tions introduce memory into the process such that the Markov property is lost (see Text S1). The probability densities of the waiting times until specific state transitionsi?loccur,Yil(t), are considered as input data for our Ca2z
model (see Section Materials and Methods).
For analytical analysis, we need to solve a non-Markovian master equation determined by theYil(t). As an extension to the
the often awkward inverse Laplace transform. We can obtain the average and standard deviation of interevent times which are key characteristics of biological processes like Ca2z
signalling or chemotaxis [17,36]. The expressions for the moments StnT of
interevent times are particularly convenient if the system can be represented as a linear chain with N distinct states
X[f0,1,. . .,N{1gand state transitions0<1<. . .<N{1(see Section Materials and Methods). For instance, in the case ofN~3
we obtain.
StnT~({1)n L n
Lsn ~ Y
Y01(s)YY~12(s)
1{YY~01(s)YY~10(s)
" #
D
s~0
,
ð2Þ
whereYY~il(s)denotes the Laplace transformed conditioned waiting times. From Eq. 2, average StT and standard deviation s~pffiffiffiffiffiffiffiffiffiffiffiffiffiffiffiffiffiffiffiffiffiffiffiSt2T{StT2
of interevent times are readily computable. A limiting step in this solution strategy is the availability of the Laplace transform YY~il(s). Multistep processes like the ones considered here (see Fig. 1) are often well described by c -distributions [11], which are also frequently observed in biological dynamical systems [27,37,38]. However, expressions like Eq. 2 are impractical forc-distributed conditioned waiting times. Instead of that, we found that generalised exponential (GE) distributions [39].
y(t)~al(1{e{lt)a{1e{lt ð3Þ
are very convenient for operations in Laplace space and approximate the multistep processes leading to Ca2z
spikes
equally well asc-distributions (see below). In Eq. 3, a§1is the shape parameter andlw0is the scale parameter. Note that for a~1, Eq. 3 is an exponential distribution with parameterl.
With the use of Laplace transformed GE distributions, we have found a straight-forward strategy to solve for dynamic properties of non-Markovian systems. Importantly, computational effort is essentially reduced to solution of a linear algebraic system, and thus the strategy can easily be extended to larger systems, in contrast to the Voltera integral equations discussed in Ref. [17].
Waiting Times ofCa2z
Dynamics and their Dependence on Cellular Parameters
Intracellular Ca2z
dynamics can be described in terms of an observable open and an observable closed state of clusters of
IP3Rs[14,17,18]. All microscopic states in which all channels of the cluster are closed belong to the observable closed state. All other states belong to the observable open state. The subunits of individual IP3Rs continuously change states by binding and unbinding of regulatory molecules (microscopic dynamics), but only the closing of the last open channel and the first opening when all channels are closed represent transitions between the observable states of a cluster ofIP3Rs(see Fig. 1). The waiting times until a cluster opens or closes are determined by true probability densities, which we denote by yo(t) and yc(t), respectively. Cellular Ca2z
dynamics consist of the action of several interacting clusters, constituting a state spaceS1,. . .,SNof possible configurations of open and closed clusters. The condi-tioned waiting times Yij(t) are products of the basic transition
probabilityyo(t)oryc(t)of a cluster and the probabilities that all other clusters remain in their states.yc(t) can be derived from experimental data (see Ref. [17] and Text S1 for details).yo(t)
depends on the number ofIP3Rsper clusterNchand on theIP3
Figure 1. Schematic illustration of hierarchic stochastic modelling.(A) Markovian models consider all possible changes of a moleculex, e.g. binding of regulatory factors, production, degradation. Thus, microscopic state transitionsxi?xjare governed by rate parametersqij. In the case of
IP3Rs, theqijrefer to binding (unbinding) ofIP3andCa2zto (of) their respective binding sites on certainIP3Rsubunits. (B) A typical path of state
changes according to (A) includes repetitive switches between individual states before a specific state of interest (here,x4) is reached. The observable
statesSlare subsets of all microscopic states (here e.g.S1~fx1,x2,x3g). InCa2zdynamics, observable states may represent open or closed clusters
ofIP3Rs. (C) Microscopic transitionsxi?xjwith parametersqijinduce exponential waiting time probabilitiesqijexp ({Pjqijt). Observable state
concentration, which represents the strength of a hormonal stimulus in our model. Intracellular IP3 dynamics are still an open question and beyond our scope here. Because of CICR, the individual opening probabilities depend on the local Ca2z
concentration, which is a function of the number of open clusters. The value of the Ca2z
concentration rise caused by an open cluster at the locations of the other clusters gives the strength of spatial coupling between clusters.
All parameters that modify properties ofCa2z
diffusion in the cell and describe the spatial configuration of clusters affect the coupling [14]. Therefore, we seek for a valid analytical approx-imation ofyo(t) and its dependence on½Ca2z
, Nch and ½IP3, which was not available in our previous article [17]. Recent data from TIRF microscopy revealed key properties ofyo(t) [27,40], but are not sufficient for a closed mathematical model, because the dependencies of the Ca2z
and IP3 concentration have not yet been established. A good approximation was achieved by using two-parametric probability distributions like the waiting time density of the inhomogeneous Poisson process or thec -distribu-tion, indicating recovery times between successive opening events [27]. However, in some cases, simple exponential distributions without any recovery process described the data equally well [27,40]. This coincides with our observation that single channel models generate approximately exponential distributions at low (basal) localCa2z
concentration [17]. This is probably because intermediate inhibitory states are rarely reached at low½Ca2z
in
these models [14]. Based on these findings, we assume for the purposes of this study that the transition from 0 to 1 open clusters (puff probability) is governed by a pure exponential distribution with average interpuff interval as recorded for SH-SY5Y cells for typical values of cellular parameters. For subsequent cluster openings (1?2,2?3,. . .open clusters), we use GE distributions (see Eq. 3), which fit the data equally well as c-distributions (Fig. 2A) but are more convenient for operations in Laplace space. That means, for the puff probability distribution, we seta~1and identifyl~l0with the puff rate.
As we have determined the functional form of the yo(t), it remains to establish the dependencies of the distribution param-eterslandaon the cellular parameters½Ca2z
,Nch and ½IP3. Unfortunately, for such dependencies no directly usable experi-mental data are available. However, earlier work has shown that yo(t)can be computed from single channel models by solution of a Markovian master equation [41]. The single channel models were partly based on data from in vitro studies, and the new in vivo experimental data [27] confirmed the type of distributions resulting from those models. In particular, we adopt an implementation of the De Young Keizer model [34,41], one of the most accepted single channel models in the field (see Table S1 and Text S1 for details). To obtain an analytical description of the parametersaandl, we performed simulations of the De Young Keizer model with varying cellular parameters and inspected functional forms matching the simulations. The base-levelCa2z
Table 1.Important mathematical symbols used in this work.
Symbol Meaning Unit
qil Markovian transition rate from stateitol s{1
Pji(t) conditional probabilityP(i,tDj,0)
Iilj probability flux from stateitolconditioned withPj(0)~1 s{1
Yil(t) conditioned waiting time to go fromitol s{1
fj
il(t) initial function for the Volterra integral equation s
{1
~ g
g(s) Laplace transform of functiong(t)
Fij(t) first passage time density (FPT) for the first visit inistarting inj
vtnw n-th moment of the FPT sn
yo(t) opening probability density s{1
yc(t) closing probability density s{1
Nch mean number ofCa2zchannels involved in a puff event per cluster
½IP3 cytosolicIP3concentration mM
c Ca2zchannel closing rate s{1
a shape parameter of the GE distribution
l scale parameter of the GE distribution s{1
l0 puff rate s{1
Tav average interspike interval (ISI) s
s standard deviation of ISIs s
k(t) time dependent spike rate s{1
k0 localized spike rate s{1
j recovery rate of global feedback s{1
C1N,i coupling strength of clusteri
C14 homogeneous coupling strength for the tetrahedron model
p(t) probability density of a spike occurring at epocht s{1
concentration, an important (and experimentally undetermined) parameter needed for the simulations, was chosen by comparison with the measured puff rate [27].
We found (Fig. 2B–C) that the parameter dependencies of the puff ratel0can be approximated by a Hill function.
l(x)~ Uxx mx
Lx
ð Þmxzxmx, ð4Þ
wherex~[IP3] orNch. Note thatNch is a discrete variable, and Eq. 4 should only be evaluated at integer values in this case. This is also true for the dependencies of the parameter l of the GE distribution onx~Ca2+,
[IP3]orNch(Fig. 2D–F). Dependencies of l0 on Nch and of l0 on ½Ca2zare close to the linear regime (Fig. 2C,F). Thea-dependence of all parameters (Fig. 2G–I) can be fit by another Hill equation,
a(x)~ Vxx nx
Kx
ð Þnxzxnxz1, ð5Þ
where the ‘+1’ in Eq. 5 reflects the fact that GE-distributions have a different shape at av1. The fits of analytical functions to computed opening probabilitiesyoat varying cellular parameters provide all the information needed to perform calculations of the hierarchic stochastic model (see Text S1). Fit parameters for the examples shown in Fig. 2 are given in Table S2.
The analytical parameter dependencies of waiting times presented here are a huge advantage over the approach followed in Ref. [17], where the single channel models were evaluated de novo for each of model simulation at a certain set of cellular parameters. In particular, Eqs. 5–4 allow for integration of the hierarchic stochastic model into models of signal transduction networks in future research.
Analysis of a Minimal MechanisticCa2z Model
Solution of the hierarchic stochastic model by the Laplace transform is most convenient in the case of a linear chain (see Section Materials and Methods). As applied to stochasticCa2z
dynamics, cluster arrangements with equal distances between all clusters and identical clusters lead to linear chain models. That can be achieved only up to 4 clusters in a tetrahedral arrangement, but this number of clusters leads to physiologically meaningful results concerning spike statistics already [17], in particular in conjunc-tion with the generic model introduced below. Further details needed to derive theCa2z
model are given in Text S1. By using the analytic approximations, Eqs. 3–4, we can relate cellular parameters like the cytosolicIP3concentration to the parameters of the opening and closing waiting time densities.
Figure 3 shows a typical model calculation with realistic parameters and spiking statistics. The opening probabilities (Fig. 3A–B) are split into two temporal regimes for opening of the first cluster with the constant ratel0(puff probability, inset) and successive cluster openings. If the first cluster has opened, the probability for the opening of successive clusters is greatly enhanced. This reflects CICR in our stochastic model. The stationary occupancy probabilities (Fig. 3C) for the different states can be computed from Eq. 14. We performed delayed stochastic simulations (Fig. 3D) by methods similar to the Gillespie algorithm [13,17] to provide a picture of the actual dynamics.
We define a spike in the tetrahedron model by opening of all four clusters. The average ISI StT:Tav([IP3],Nch) can then be
calculated analytically by Eq. 15. Figure 4A shows that Tav changes by about one order of magnitude with varyingNch and
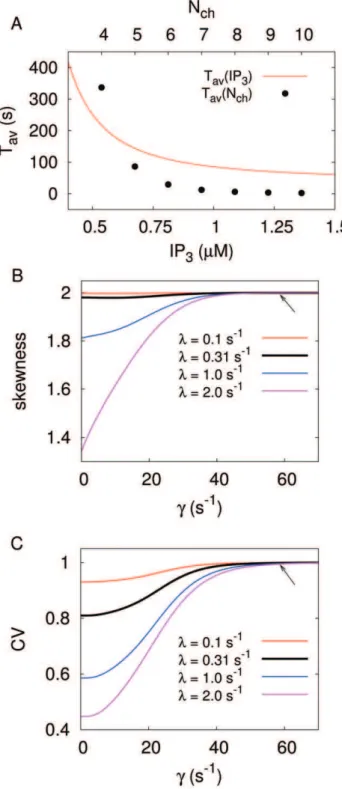
½IP3, respectively. If we suppose a realistic coverage of the cellular parameter range, a strong cell to cell variability in terms ofTav should be expected in experiments, and is indeed reported [6,26]. Even though we can not calculate the ISI density directly, apart from very simple cases (see Text S1) where the inverse Laplace transform is feasible, we can characterise it with higher moments, which are directly available from our theory (see Methods, Eq. 15). For standard cellular parameters as used above, we obtain a skewness of 2 (Fig. 4B) and an excess kurtosis of 6. These are exactly the values fulfilled by an exponential distribution, and indeedTav (IP3, Nch ) =s (IP3, Nch ) also holds for our results (Fig. 4C). Thus, we conclude that the tetrahedron model yields an exponential ISI density in the realistic parameter regime.
The surprisingly simple result of an exponential ISI density for a large range of the biological parameters is due to the strong time-scale separation between the relatively slow puff dynamics and the faster excitation process up to the spiking state (see Fig. 3A). If a puff occurs the system decides rather quickly, in comparison to the interpuff intervals, whether it generates a global spike or relaxes back to the ground state with all clusters closed. Hence, the system spends most of its time in the ground state, waiting for the next puff to occur, and the constant puff probability dominates the ISI density. The ISI density is different from an exponential distribution for smaller time scale separation, i.e., smaller values ofc(Fig. 4B–C). Remarkably, we find parameter regions where the coefficient of variation (CV = standard deviation/average) drops significantly whereas the input distribution (puff-distribution) is purely exponential (CV = 1). This indicates array enhanced coherence resonance [42,43], a phenomenon that has been intensively studied in physics and is a characteristic of coupled noisy excitable systems. See Text S1 for a simple example where array enhanced coherence resonance can be demonstrated analytically.
The exponential dependence on time of the ISI density entailing s=Tavis quite robust with respect to even strong variations of the puff rate with realistic channel closing rates (arrows in Fig. 4B–C). This is in agreement with our earlier result [17] that a global feedback is necessary to reach the regime s,Tav, which is typically observed in experiments [6]. Unfortunately, global feedback does not allow for an exact analytical solution for the moments of the FPT density. However, based on the robust time-scale separation observed in the mechanistic model (Fig. 4), we found a valid approximation of the spike process incorporating a global feedback and the local dynamics, which we call generic model.
A Generic Model Based on Local Puff Dynamics
We use the simple model for the global spike process introduced in Ref. [6] to introduce a global feedback into the hierarchic stochastic process. The global feedback is included as a slow recovery of the spike rate after a spike occurred, which leads to an inhomogeneous Poisson process with time dependent spike rate.
k(t)~k0(1{e{jt), ð6Þ
with the Poisson spike ratek0and the recovery ratej. With this formulation the probability for a spike att~0equals zero. This represents an inhibitory or negative global feedback, at highCa2z
concentrations, which naturally occurs after a globalCa2z
model this means to go from one open cluster to four open clusters before reaching the ground state with all clusters closed again. It is analytically given by [17].
C14~
C12C23C34
1zC12(C23{1)zC23(C34{1)
, ð7Þ
with the one-step splitting probabilities Ci,iz1~ Ð?
0 Yi,iz1(t)dt. Figure 5 shows the dependence ofC14on cellular parameters. As in Ref. [17], we formulate puff generation as inhomogeneous Poisson process with time-dependent ratel0(1{e{jt), wherejis the recovery rate. This effectively inhibits the occurrence of a local puff event right after a spike and hence incorporates global negative feedback. The puff rate asymptotically approaches the stationary valuel0as time increases. We now resample the puff process into the global spike process with probabilityC14 and its complementary process with probability (1{C14). The comple-mentary process is the Poisson process describing the failed puffs, the ones that did not lead to a globalCa2z
spike.
In general, a cellular spike will require N open clusters, the splitting probability should therefore be denoted byC1N. Clusters are heterogeneous with respect to the number of channels per cluster as well as to their distance to neighbouring clusters. Hence, the puff probability as well as the splitting probability are cluster specific. We introduce the individual puff ratel0,i and splitting
probability C1N,i for every cluster i. Some failed puffs occurs
between two spikes. The probability for the interspike intervaltis then given by the sum over the probabilities for all possible numbers of puffs in between two spikes from 0 to?. This finally
leads to the expressions constituting the inhomogeneous Poisson splitting (see also Text S1).
k(t)~X N
i~1
l0,iC1N,i(1{e{jt) ð8Þ
p(t)~k(t)e{L(t), ð9Þ
Figure 2. Parameter dependencies of the opening probabilitiesyo.(A) Comparison of fits of Gamma and GE distributions to the De Young-Keizer model (see Ref. [34] and Table S1) at½Ca2z
= 0.6mM. (B–I) Circles are fits of results from the De Young-Keizer model to GE distributions (Eq. 3) with parametersaandl, as in A. Lines are (B,D,E) nonlinear fits to Eq. 4, (C,F) linear fits, (G–I) nonlinear fits to Eq. 5. (B–C) show the dependencies for the puff-rate, i.e. at base-level½Ca2z
= 0.1mM(see Text S1). (D–H) show parameter dependencies in the regime of a puff, i.e. with one nearby cluster already open, yielding½Ca2z
= 0.6mM(see Text S1). Other parameter values (if not varied on the x-axis) areNch= 5,½IP3= 1mM.
where L(t)~PNi~1l0,iC1N,iÐ0t(1{e{jt)dt is the intensity and p(t)is the density function of the probability that a globalCa2z
spike occurs at timetafter the previous spike.
Comparison with Eq. 6 shows that we found an expression of the Poisson spike ratek0in terms of cluster properties,
k0~ XN
i~1
l0,iC1N,i: ð10Þ
Thus, k0 can be taken as total spike rate, summing up the individual contributions of clustersito the spike rate. That is, the individual puff ratesl0,iof clusteriare rescaled with the coupling
strength C1N,i. The average interspike interval Tav and the standard deviations can then be calculated analytically with the results given in Ref. [6].
To confirm the validity of the generic model in the presence of global feedback, we performed stochastic simulations of the hierarchic stochastic model as described in Ref. [17] and compared them with the analytic results of the generic model. For the homogeneous tetrahedron cluster arrangement, Eq. 10 gives k0~4l0C14. This new generic model approximates the average ISI very well (Fig. 6A). The experimental moment relations are in very good agreement with the moment relations obtained forj~const(Fig. 6B). For a single cell the specific value ofk0positions the cell on that moment relation as indicated by the symbols in Fig. 6. Note that very small slopes of the moment relation below 0.3, which have been reported for HEK293 cells [6], can be generated by adding cooperativity to the generic model [18]. The saturation for bothl0andC14with respect to theIP3 concentration (see Figs. 2 and 5) gives rise to an intrinsic minimal
ISI in the model (Fig. 6A–B). The relation of this minimal ISI to the physiological minimal ISI reported from single cell measure-ments [6] should be elucidated by further research.
By applying Poisson splitting (see Text S1 for details), we implicitly neglect the possible dynamics between the puff and the spike events. Most notably we completely miss the duration of the failed puffs. The number of those failed puffs is given on average by1=C14, so we expect the error we make by using the splitting scales exactly with1=C14. By comparing our exact analytic results for the tetrahedron model with our generic model without recovery we show that this is indeed the case (Fig. S1). Moreover we have computed the relative error and state that it is bounded and smaller than 10% (see Text S1). The great advantage of the generic model is its capability of providing a closed expression for the ISI distribution reproducing the moment relation between the standard deviation s and the average Tav of ISIs found experimentally, incorporating the local puff dynamics. The key parameter for the local dynamics is the coupling strength C14 obtained by hierarchic stochastic modelling.
Discussion
We present an extension to a description of complex stochastic networks in terms of observable states and non-exponential transition time distributions. The approach can be used for very efficient stochastic simulations and in many cases analytical solutions can be obtained. We apply hierarchic stochastic modelling to spatially resolved stochasticCa2z
dynamics. Apart from using a new solution method, we made further progress in the Ca2z
model published in [17] by developing analytic approximations of model dependencies on cellular parameters and taking into account recent experimental data for model
Figure 3. Minimal hierarchic stochastic model ofCa2z
dynamics.The colours in (A,B,C) depict the system state in terms of the number of open clusters (Si, i = 0,1,2,3,4). (A) Individual opening time (Yo,i) and closing time (Yc) probability densities. (B) Conditioned waiting time densities for
the consecutive opening transitions, constructed out of the individual closing (yc) and opening (yo,i) densities for the tetrahedron model. Note the
time-scale difference between the opening of the first cluster (Y01) and the consecutive openings, this effectively covers the CICR mechanism. (C)
Stationary probabilities for the possible states of the system as function of the cytosolicIP3concentration, as computed from Eq. 14. (D) Stochastic
simulations of spike trains for½IP3= 1mM. Note the frequent puff events with less than four clusters open and the rather isolated global spike events.
The number of channels per cluster isNch= 5. All calculations are based on the analytic approximations of parameter dependencies shown in Fig. 2.
calibration. This permitted us to rationalise time scale separation between puffs and waves in a physiological setting, and subsequently to find a derivation of a generic description of the stochastic spike generating process.
The theory presented here is able to calculate the statistical properties of cellular Ca2z
spiking from cluster properties and spatial coupling. We have derived the moments of the ISI distribution by Laplace transform of the non-Markovian master equation, and we approximated the complete ISI distribution with the generic model. This simplistic description was postulated earlier in the Falcke group [6] but only now we can give a mechanistic explanations for its validity. The generic model is only applicable for a large time scale separation between the interpuff intervals and the ISIs. However, this separation was shown experimentally for many cell types [27,44]. As is often the case with approximate solutions, the generic model allows for deeper insight than the direct solution of the integro-differential equa-tions. The theory explains the role of spatial arrangement of clusters and strength of spatial coupling in the spike probability in a simple and intuitive way. We introduced a phenomenological factork0which rescales the local puff dynamics to the global spike dynamics. This factor also explains the observed large cell-to-cell variability as differences in cluster properties and cluster arrange-ment. While we started with the assumption that the puff probability slowly recovers from negative feedback, Eqs. 8 also allows for a time dependency of the splitting probability C1N.
Hence, more complicated recovery processes arising from a variety of feedbacks could replace the simple relaxation chosen here. The model exhibits almost linear moment relations between standard deviation and average in agreement with experimental results. Changes in k0 of an individual cell by experimental manipulations or between cells due to cell-to-cell variability do not alter the slope of the moment relation. That explains its robustness against changes of local properties and coupling strength, i.e. cell-to-cell variability within a given cell type, which has been observed [17,32]. The rate of recovery from global feedback strengthjis cell type specific, which explains the cell type specificity of the moment relation.
Figure 4. Statistical analysis of Ca2z
interspike intervals (ISI).(A) The average ISI Tav decreases with theIP3 concentration
(Nch= 5) and withNch(½IP3= 1mM). The other parameter is kept at Nch= 5 and½IP3= 1mM, respectively. (B) Skewness and (C) coefficient
of variation (CV = standard deviation/mean) increase with the channel closing ratec, which controls the time scale separation betweenCa2z
puffs (single cluster opening) andCa2z
spikes (all clusters open). The solid lines are calculated for a realistic puff ratel0. The dotted lines
indicate that the time-scale separation becomes weaker with growing puff rate (see text). The parameter values used for the stochasticCa2z
model (Fig. 3) are indicated by the arrows. doi:10.1371/journal.pone.0051178.g004
Figure 5. Parameter dependencies for the splitting probability
C14to reach the spiking stateS4out of a single puff stateS1for the tetrahedron model.Note the different axis scaling for the cytosolicIP3 concentration and the mean number ofCa2z channels
per cluster participating in an opening event (Nch ) respectively. The
splitting probability saturates for both parameters, however for theNch
dependency only for a unrealistic high number of Ca2z
channels (Nchw100).
Our theory is based on recent experimental data from live cell imaging for opening and closing transition times ofCa2z
channel clusters. A description of cellularCa2z
dynamics further requires information about the coupling of individual Ca2z
channel clusters and the dependence on cellular parameters like strength of the upstream signal (IP3 concentration) and cluster size. These functional relations could, up to now, only be obtained from single channel models, which are well established and have successfully been used in earlier modelling studies [14,17,32]. Based on this, we suggest analytical approximations for model dependencies on cellular parameters. This approach can be used for integration of the model into mathematical descriptions of larger signalling cascades.
We calculated the splitting probabilityCi
1NforN~4, whereN
is the number of open clusters forming a cellular release spike. Typically, a cellular spike will consist of more than 4 open clusters. However, the calculation provides a good description of cellular spiking, if a cell has a preferred nucleation area initiating most of the cellular spikes. The stronger the release in such an area is, the more likely is the nucleation of a wave due toCa2z
diffusion and CICR. At a sufficient value, this probability will be very close to one. The tetrahedron model is a good description of cellular spiking with nucleation areas, if that value is reached by 4 open clusters. Preferred nucleation areas have indeed been observed, e.g. in hepatocytes [45]. In the spirit of hierarchical modelling, the results with one nucleation area can then easily be generalised to several such areas.
We find that the minimal tetrahedral system considered here stays in the regime of a Poisson process for Ca2z
spikes, characterized by a coefficient of variation equal to one, even for relatively large deviations from the physiological parameters. Only a drastic reduction of the time scale separation (or increase of the coupling strength between clusters), mediated by increased puff ratel0and reduction of the channel closing ratec, can reduce the noise level by means of array enhanced coherence resonance [42,43]. Therefore, we suppose that the lower noise levels observed in many cell types [6] indeed stems from feedback processes, as suggested by earlier results [17]. However, the experimental proof for the importance of such feedback processes forCa2z
spike statistics is still lacking. Given an inhomogeneous Poisson process for the formation of a puff, the subsequent nucleation process (one to many open clusters) is very fast
compared to a typical ISI. This time scale separation is the key assumption behind the generic model. By incorporation of a negative feedback it leads to ISI distributions close to experimental data.
Hierarchic stochastic modelling uses non-exponential transition times to reflect microscopic state changes occurring during sojourns in observable states. Remarkably, such non-exponential transition times have already been measured or computed for other cellular systems like gene expression [37,38], autocatalytic reactions [46,47] or signal transduction cascades [48,49]. Using non-exponentially distributed transition times instead of kinetic constants can also be interpreted as dynamic modelling with stochastic delay – the delay arises from the underlying microscopic dynamics (see Fig. 1). Biological systems with stochastic delay were previously investigated [50–53], but these studies lack the possibility to implement molecular interactions on the lumped state level, and have not been generalised to hierarchic networks. Hierarchic stochastic modelling can also be related to published methods which exploit the hierarchic structure of networks [54– 56]. Similar to our approach, such methods reduce the state space based on emergent behaviour of biomolecules arising by the dynamic hierarchy from molecular interactions to cellular properties [19,57,58]. However, to our knowledge, these studies have been limited to a reduction of the state space or inference of system parameters in deterministic systems so far. Since complex stochastic networks are frequently observed in cell biology [1,2], we expect that our approach has a wide range of potential applications. On the one hand, pure Markov modelling means that one has to take into account all microscopic variables to make an exact description of the system. This is impossible for most, if not all, processes analysed in cell biology due to the large numbers of system states and because microscopic state transitions can rarely be measuredin vivo. On the other hand, the assumption of Gaussian white noise, which is often used in approximation techniques, is questionable for many biological systems because the number of independent identical processes is too small for application of the law of large numbers. Therefore, hierarchic stochastic modelling brings theoretical concepts closer to exper-imental data.
The application to intracellularCa2z
dynamics presented here makes an important step forward in the development of a mechanistic but comprehensive mathematical description of the
Figure 6. The generic model is a valid approximation of the hierarchic stochastic model and providess–Tav relations close to experimental data.(A) Comparison of numeric results for the tetrahedron model with the results forTavof the generic model with different
feedback strengths represented byj(see also S1). Forj??, the model approaches the analytically treatable case, where the slope of the relation
equals one. (B)s–Tavrelation of the generic model. To demonstrate the impact of the coupling strengthC14, we added the individual values ofTav
for three different values ofC14(0.05, 0.01, 0.008) to each line. Modification of the coupling strength merely leads to a shift of the cell along thes–Tav
process. We are now in a position to characterise the stochastic process in the physiologic parameter regime. A key finding is that the time scale separation between single cluster puffs and subsequent openings is very strong. And that despite the non-Markovian nucleation process, a coefficient of variation smaller than one can not be realised without a negative feedback. These results pave the road to the generic description in the form of a time-dependent Poisson process, which can be sampled by standard methods. Our derivation shows how the phenomenolog-ical parameters of the generic model depend on cellular parameters. The generic model can therefore be used to generate
Ca2z
spikes with correct statistics in models of larger signalling cascades in future research.
Materials and Methods
The Conditioned Waiting TimesYil(t) In the mechanistic stochasticCa2z
model recently published by two of us [17], we not only lumped the microscopic states of individual IP3Rs but the whole ensemble of Ca2z channels forming a cluster. Therefore, our effective reduced state space just contains the time dependent cluster configuration, i.e. the number of open and closedCa2z
clusters at a specific time point. In the theoretical framework of semi-Markov processes (see Text S1 for details) transitions within that state space can be described by the probability given by pi,lYi,l(t). The first factor describes the transition probability of an ordinary discrete time Markov chain for the transitioni?l, the latter gives the possibly non-exponential waiting time distribution. The Yil(t) are not true probability densities for more than two possible state transitions, as they are not normalised individually, but rather by the condition P
l
Ð?
0 Yil(t)dt~ P
lpi,l~1. Therefore the term conditioned
waiting times (or conditioned dwell times) is appropriate. The waiting times can be calculated from a mathematical model or measured directly (see Section Results). Exact definitions of the Yil(t)and for the considered semi-Markovian stochastic process
are given in Text S1. Apart from the analytical approach given below, the Yil(t) can also be used very efficiently in stochastic simulations [17].
Solution of the Non-Markovian Master Equation
State-transition with non-exponential waiting times are not covered by Eq. 1, but rather by a generalised (non-Markovian) master equation [17,59].
L LtP
j i(t)~
XN
l~1
Ilij(t){Ij il(t)
h i
, ð11Þ
with the probability fluxes given by [59]
Iilj(t)~
ðt
0
Yil(t{t)X Nin
k
Ikij(t)dtzfilj(t): ð12Þ
Note that the probability fluxesIilj(t)can no longer be expressed in terms of the Pji(t) like in Eq. 1, but are solutions of a Voltera integral equation determined by the conditioned waiting times Yil(t)and appropriate initial functionsfilj(t). The initial functions
are related to the initial probabilities Pji(0) in Eq. 11, e.g.
Pj(0)~1,Pi(0)~0setsfjlj(t)~Yjl(t)andfilj(t)~0for alli=jand alll.
The form of Eq. 11 suggests a solution based on the Laplace transformLff(t)g~Ð?
0 e
{stf(t)dt~~ff(s) (see also [60]), because
the convolution theorem implies.
~
IIilj(s)~YY~il(s)X Nin
k ~
IIkij(s)z~ffilj(s): ð13Þ
This constitutes a linear system of equations for the probability fluxes in Laplace space. We obtain the stationary occupancy probabilities as.
lim t??P
j i(t)~lims
?0
XN
l~1
~
IIlij(s){~IIilj(s)
h i
( )
, ð14Þ
where the limits in Eq. 14 are equal due to the final value theorem of the Laplace transform.
Certain dynamical system properties can be characterised by statistical moments of the density function of the first passage time (FPT)Fij(t)giving the probability for the first visit of stateiwhen
starting at statej. The moments ofFij(t)obey [11]:
StnT~({1)nLn
LsnFF~ j
i(s)Ds~0, ð15Þ where the Laplace transformed FPT density can be found by the formula FF~ij(s)~PP~ji(s)=PP~i
i(s) [11]. By using the property LfL
Ltf(t)g~s~ff(s){f(0), the next step is to apply the Laplace
transform to Eq. 11. This yields
sPP~ji(s){dij~
X
l
½~IIlij(s){~IIilj(s), ð16Þ
stating thatP(i,0Dj,0)~1fori~jand zero otherwise. From this, we find
~ F Fij(s)~
PN
l~1
~
IIlij(s){~IIilj(s)
h i
PN
l~1
~ IIi
li(s){~IIili(s)
z1
: ð17Þ
This expression is particularly simple in the case of a linear chain withN~Kz1 distinct statesX[f0,1,:::,Kg, where we have to compute the 2K probability fluxes I0,1,I1,0,. . ., IK{1,K,IK,K{1.
Suppose the system is in state0 at time t~0and we want to calculate the moments of the FPT distribution to reach the highest stateKusing Eq. 15 derived above. In the case of a linear chain, we arrive at
~ F F0
K(s)~ ~II0
K{1,K(s){~IIK0,K{1(s)
~IIK
K{1,K(s){~IIKK,K{1(s)z1
: ð18Þ
The conditioning on either state 0 or state K at t~0 leads effectively to two distinct non-homogeneous linear systems of equations for the fluxes. They differ only with respect to the initial functions, namely f0
il~Y01 and filS~YK,K{1. Therefore, in the
Model Calculations
Details of the mechanisticCa2z
model are given in Text S1. We used Wolfram’s Mathematica 8 for linear algebra and a home-made simulation tool [17] for stochastic simulations.
Supporting Information
Figure S1 Comparison of the generic model with the exact analytic results provided by the hierarchic sto-chastic model. Shown are the results for the realistic channel closing ratec(black lines) and two examples with lower time scale separation. (A) The approximation error grows linear with the average number of failed puffs, given by1=C14. (B) The relative approximation error is smaller than 10% for the realistic closing rate.
(PDF)
Table S1 Parameter values for the De Young-Keizer model.The De Young-Keizer model with the parameters in this table is used to compute the opening transition timesyo. (PDF)
Table S2 Analytical approximation of the GE distribu-tion parameters.The values in this table result from nonlinear
fitting to Eqs. 4–5 (see Fig. 2) and are used for the dependencies of the GE distribution parametersa and l on cellular parameters
Nch,½IP3andCa2z (see Text S1 for details). In each row, only one parameter is varied, and other parameters are kept constant at
Nch= 5,½IP3= 1mM, and½Ca2zgiven by Eq. 41 in Text S1. Every system state is described by the number of open clusters (o. cl.) and has its own set of parameters.
(PDF)
Text S1
(PDF)
Acknowledgments
We thank Pa˚l O Westermark for critical reading of the manuscript, Hanspeter Herzel for discussions and two anonymous reviewers for helpfull suggestions.
Author Contributions
Conceived and designed the experiments: MF KT. Performed the experiments: GM KT. Analyzed the data: GM KT. Contributed reagents/materials/analysis tools: GM KT. Wrote the paper: GM MF KT.
References
1. Raj A, van Oudenaarden A (2008) Nature, nurture, or chance: stochastic gene expression and its consequences. Cell 135: 216–26.
2. Balazsi G, van Oudenaarden A, Collins JJ (2011) Cellular decision making and biological noise: from microbes to mammals. Cell 144: 910–25.
3. Altschuler JS, Wu LF (2010) Cellular heterogeneity: do differences make a difference? Cell 141: 559–63.
4. Alon U, Surette MG, Barkai N, Leibler S (1999) Robustness in bacterial chemotaxis. Nature 397: 168–71.
5. Elowitz MB, Levine AJ, Siggia ED, Swain PS (2002) Stochastic gene expression in a single cell. Science 297: 1183–6.
6. Skupin A, Kettenmann H, Winkler U, Wartenberg M, Sauer H, et al. (2008) How does intracellular Ca2+oscillate: by chance or by the clock? Biophys J 94: 2404–11.
7. Feinerman O, Veiga J, Dorfman JR, Germain RN, Altan-Bonnet G (2008) Variability and robustness in T cell activation from regulated heterogeneity in protein levels. Science 321: 1081–4.
8. Fritsche-Guenther R,Witzel F, Sieber A, Herr R, Schmidt N, et al. (2011) Strong negative feedback from Erk to Raf confers robustness to MAPK signalling. Mol Syst Biol 7: 489.
9. Cagatay T, Turcotte M, Elowitz MB, Garcia-Ojalvo J, Suel GM (2009) Architecture-dependent noise discriminates functionally analogous differentia-tion circuits. Cell 139: 512–22.
10. Mariani L, Schulz EG, Lexberg MH, Helmstetter C, Radbruch A, et al. (2010) Short-term memory in gene induction reveals the regulatory principle behind stochastic IL-4 expression. Mol Syst Biol 6: 359.
11. Van Kampen NG (2002) Stochastic Processes in Physics and Chemistry. Amsterdam: Elsevier Science B.V.
12. Tanase-Nicola S, ten Wolde P (2008) Regulatory control and the costs and benefits of biochemical noise. PLoS Comput Biol 4: e1000125.
13. Gillespie DT (1977) Exact stochastic simulation of coupled chemical reactions. J Phys Chem 81: 2340–2361.
14. Falcke M (2004) Reading the patterns in living cells - the physics of Ca2+
signaling. Adv Phys 53.
15. Berridge MJ, Lipp P, Bootman MD (2000) The versatility and universality of calcium signalling. Nat Rev Mol Cell Biol 1: 11–21.
16. Thul R, Falcke M (2004) Stability of membrane bound reactions. Phys Rev Lett 93: 188103.
17. Thurley K, Falcke M (2011) Derivation of Ca2+
signals from puff properties reveals that pathway function is robust against cell variability but sensitive for control. Proc Natl Acad Sci U S A 108: 427–32.
18. Thurley K, Skupin A, Thul R, Falcke M (2012) Fundamental properties of Ca(2+) signals. Biochim Biophys Acta 1820: 1185–94.
19. Skupin A, Thurley K (2012) Calcium Signaling: From Single Channels to Pathways. Adv Exp Med Biol 740: 531–51.
20. Marchant JS, Callamaras N, Parker I (1999) Initiation of IP3-mediated Ca2+
waves in Xenopus oocytes. EMBO J 18: 5285–5299.
21. Taufiq Ur R, Skupin A, Falcke M, Taylor CW (2009) Clustering of InsP3 receptors by InsP3 retunes their regulation by InsP3 and Ca2+. Nature 458: 655–
9.
22. Smith IF, Parker I (2009) Imaging the quantal substructure of single IP3R channel activity during Ca2+puffs in intact mammalian cells. Proc Natl Acad
Sci U S A 106: 6404–9.
23. Bezprozvanny I, Watras J, Ehrlich BE (1991) Bell-shaped calcium-response curves of Ins(1,4,5)P3- and calcium-gated channels from endoplasmic reticulum of cerebellum. Nature 351: 751–4.
24. Taylor CW, Tovey SC (2010) IP3 Receptors: Toward Understanding Their Activation. Cold Spring Harb Perspect Biol 2: a004010.
25. Oancea E, Meyer T (1998) Protein kinase C as a molecular machine for decoding calcium and diacylglycerol signals. Cell 95: 307–18.
26. Dupont G, Abou-Lovergne A, Combettes L (2008) Stochastic aspects of oscillatory Ca2+dynamics in hepatocytes. Biophys J 95: 2193–202.
27. Thurley K, Smith IF, Tovey SC, Taylor CW, Parker I, et al. (2011) Timescales of IP(3)-Evoked Ca(2+) Spikes Emerge from Ca(2+) Puffs Only at the Cellular Level. Biophys J 101: 2638–44.
28. Meyer T, Stryer L (1988) Molecular model for receptor-stimulated calcium spiking. Proc Natl Acad Sci U S A 85: 5051–5.
29. Schuster S, Marhl M, Hofer T (2002) Modelling of simple and complex calcium oscillations. From single-cell responses to intercellular signalling. Eur J Biochem 269: 1333–55.
30. Skupin A, Falcke M (2007) Statistical properties and information content of calcium oscillations. Genome Inform 18: 44–53.
31. Skupin A, Falcke M (2009) From puffs to global Ca2+
signals: how molecular properties shape global signals. Chaos 19: 037111.
32. Skupin A, Kettenmann H, Falcke M (2010) Calcium signals driven by single channel noise. PLoS Comput Biol 6.
33. Sneyd J, Falcke M (2005) Models of the inositol trisphosphate receptor. Prog Biophys Mol Biol 89: 207–45.
34. De Young GW, Keizer J (1992) A single-pool inositol 1,4,5-trisphosphate-receptor-based model for agonist-stimulated oscillations in Ca2+
concentration. Proc Natl Acad Sci U S A 89: 9895–9.
35. Sneyd J, Falcke M, Dufour JF, Fox C (2004) A comparison of three models of the inositol trisphosphate receptor. Prog Biophys Mol Biol 85: 121–140. 36. Ueda M, Shibata T (2007) Stochastic signal processing and transduction in
chemotactic response of eukaryotic cells. Biophys J 93: 11–20.
37. Harper CV, Finkenstadt B, Woodcock DJ, Friedrichsen S, Semprini S, et al. (2011) Dynamic analysis of stochastic transcription cycles. PLoS Biol 9: e1000607.
38. Suter DM, Molina N, Gatfield D, Schneider K, Schibler U, et al. (2011) Mammalian genes are transcribed with widely different bursting kinetics. Science 332: 472–4.
39. Gupta RD, Kundu D (2007) Generalized exponential distribution: Existing results and some recent developments. J Statist Plann Inference 137. 40. Dickinson G, Swaminathan D, Parker I (2012) The probability of triggering
calcium puffs is linearly related to the number of Inositol Trisphosphate receptors in a cluster. Biophys J 102: 1826–1836.
41. Higgins ER, Schmidle H, Falcke M (2009) Waiting time distributions for clusters of IP3 receptors. J Theor Biol 259: 338–349.
43. Zhou C, Kurths J, Hu B (2001) Array-enhanced coherence resonance: nontrivial effects of heterogeneity and spatial independence of noise. Phys Rev Lett 87: 098101.
44. Marchant JS, Parker I (2001) Role of elementary Ca2+puffs in generating
repetitive Ca2+oscillations. EMBO J 20: 65–76.
45. Dupont G, Swillens S, Clair C, Tordjmann T, Combettes L (2000) Hierarchical organisation of calcium signals in hepatocytes: from experiments to models. Biochim Biophys Acta 1498: 134–152.
46. Delbru¨ck M (1945) The burst size distribution in the growth of bacterial viruses (bacteriophages). J Bacteriol 50: 131–5.
47. Delbru¨ck M (1940) Statistical Fluctuations in Autocatalytic Reations. J Chem Phys 8: 120–124.
48. Bel G, Munsky B, Nemenman I (2010) The simplicity of completion time distributions for common complex biochemical processes. Phys Biol 7: 016003. 49. Lu T, Shen T, Zong C, Hasty J, Wolynes PG (2006) Statistics of cellular signal transduction as a race to the nucleus by multiple random walkers in compartment/phosphorylation space. Proc Natl Acad Sci U S A 103: 16752–7. 50. Schlicht R, Winkler G (2008) A delay stochastic process with applications in
molecular biology. J Math Biol 57: 613–648.
51. Barrio M, Burrage K, Leier A, Tian T (2006) Oscillatory Regulation of Hes1: Discrete Stochastic Delay Modelling and Simulation. PloS Comput Biol 2: 1017–1030.
52. Bratsun D, Volfson D, Tsimring LS, Hasty J (2005) Delay-induced stochastic oscillations in gene regulation. Proc Natl Acad Sci U S A 102: 14593–8. 53. Josic K, Lopez JM, Ott W, Shiau L, Bennett MR (2011) Stochastic delay
accelerates signaling in gene networks. PLoS Comput Biol 7: e1002264. 54. Borisov NM, Markevich NI, Hoek JB, Kholodenko BN (2005) Signaling through
receptors and scaffolds: independent interactions reduce combinatorial com-plexity. Biophys J 89: 951–66.
55. Lade SJ, Gross T (2012) Early warning signals for critical transitions: a generalized modelling approach. PLoS Comput Biol 8: e1002360.
56. Blochl F, Wittmann DM, Theis FJ (2011) Effective parameters determining the information flow in hierarchical biological systems. Bull Math Biol 73: 706–25. 57. Laughlin RB, Pines D (2000) The theory of everything. Proc Natl Acad Sci U S A
97: 28–31.
58. Penzlin H (2009) The riddle of ‘‘life,’’ a biologist’s critical view. Naturwis-senschaften 96: 1–23.
59. Prager T, Falcke M, Schimansky-Geier L, Zaks MA (2007) Non-Markovian approach to globally coupled excitable systems. Phys Rev E 76: 011118. 60. Thul R, Falcke M (2007) Waiting time distributions for clusters of complex
![Figure 5 shows the dependence of C 14 on cellular parameters. As in Ref. [17], we formulate puff generation as inhomogeneous Poisson process with time-dependent rate l 0 (1{e { jt ), where j is the recovery rate](https://thumb-eu.123doks.com/thumbv2/123dok_br/16398644.193344/6.918.93.827.89.651/dependence-parameters-formulate-generation-inhomogeneous-poisson-dependent-recovery.webp)