ACPD
12, 4165–4184, 2012Histories of heavy PFCs
D. J. Ivy et al.
Title Page
Abstract Introduction
Conclusions References
Tables Figures
◭ ◮
◭ ◮
Back Close
Full Screen / Esc
Printer-friendly Version Interactive Discussion
Discussion
P
a
per
|
Dis
cussion
P
a
per
|
Discussion
P
a
per
|
Discussio
n
P
a
per
|
Atmos. Chem. Phys. Discuss., 12, 4165–4184, 2012 www.atmos-chem-phys-discuss.net/12/4165/2012/ doi:10.5194/acpd-12-4165-2012
© Author(s) 2012. CC Attribution 3.0 License.
Atmospheric Chemistry and Physics Discussions
This discussion paper is/has been under review for the journal Atmospheric Chemistry and Physics (ACP). Please refer to the corresponding final paper in ACP if available.
Atmospheric histories and growth trends
of C
4
F
10
, C
5
F
12
, C
6
F
14
, C
7
F
16
and C
8
F
18
D. J. Ivy1, T. Arnold2, C. M. Harth2, L. P. Steele3, J. M ¨uhle2, M. Rigby1,*, P. K. Salameh2, M. Leist3,**, P. B. Krummel3, P. J. Fraser3, R. F. Weiss2, and R. G. Prinn1
1
Center for Global Change Science, Massachusetts Institute of Technology, Cambridge, Massachusetts, USA
2
Scripps Institution of Oceanography, Univ. of California San Diego, La Jolla, California, USA 3
Centre for Australian Weather and Climate Research, CSIRO Marine and Atmospheric Research, Aspendale, Victoria, Australia
*
now at: Atmospheric Chemistry Research Group, University of Bristol, Bristol, UK **
now at: Defence Science and Technology Organisation, Department of Defence, Melbourne, Victoria, Australia
Received: 11 January 2012 – Accepted: 27 January 2012 – Published: 3 February 2012
Correspondence to: D. J. Ivy ([email protected])
ACPD
12, 4165–4184, 2012Histories of heavy PFCs
D. J. Ivy et al.
Title Page
Abstract Introduction
Conclusions References
Tables Figures
◭ ◮
◭ ◮
Back Close
Full Screen / Esc
Printer-friendly Version Interactive Discussion
Discussion
P
a
per
|
Dis
cussion
P
a
per
|
Discussion
P
a
per
|
Discussio
n
P
a
per
|
Abstract
The first atmospheric observations and trends are presented for the high molecu-lar weight perfluorocarbons (PFCs): decafluorobutane (C4F10), dodecafluoropentane
(C5F12), tetradecafluorohexane (C6F14), hexadecafluoroheptane (C7F16) and octade-cafluorooctane (C8F18). Their atmospheric histories are based on measurements of
5
38 Northern Hemisphere and 46 Southern Hemisphere archived air samples collected between 1973 to 2011 using the Advanced Global Atmospheric Gases Experiment (AGAGE) “Medusa” preconcentration gas chromatography-mass spectrometry sys-tems. A new calibration scale was prepared for each PFC, with estimated accuracies of 6.8 % for C4F10, 7.8 % for C5F12, 4.0 % for C6F14, 6.6 % for C7F16 and 7.9 % for
10
C8F18. Based on our observations the 2011 globally averaged dry air mole fractions of these heavy PFCs are: 0.18 parts-per-trillion (ppt, i.e., parts per 1012) for C4F10, 0.12
ppt for C5F12, 0.28 ppt for C6F14, 0.12 ppt for C7F16 and 0.09 ppt for C8F18. These atmospheric mole fractions combine to contribute to a global average radiative forc-ing of 0.35 mW m−2, which is 3.6 % of the total PFC radiative forcing. The globally 15
averaged mean atmospheric growth rates of these PFCs during 1973–2011 are 4.58 parts per quadrillion (ppq, i.e., parts per 1015) per year (yr) for C4F10, 3.29 ppq yr−
1
for C5F12, 7.50 ppq yr− 1
for C6F14, 3.19 ppq yr− 1
for C7F16 and 2.51 ppq yr− 1
for C8F18.
The growth rates of the heavy perfluorocarbons were largest in the early 1990s for C4F10 and C5F12 and in the mid-to-late 1990s for C6F14, C7F16 and C8F18. The more
20
ACPD
12, 4165–4184, 2012Histories of heavy PFCs
D. J. Ivy et al.
Title Page
Abstract Introduction
Conclusions References
Tables Figures
◭ ◮
◭ ◮
Back Close
Full Screen / Esc
Printer-friendly Version Interactive Discussion
Discussion
P
a
per
|
Dis
cussion
P
a
per
|
Discussion
P
a
per
|
Discussio
n
P
a
per
|
1 Introduction
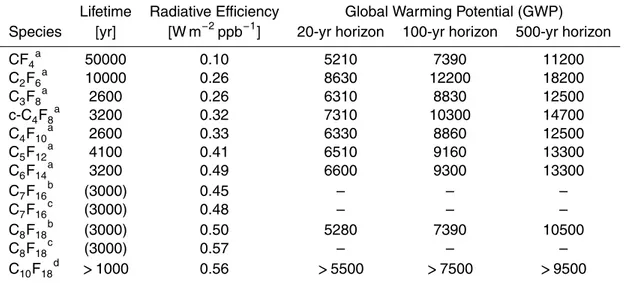
Perfluorocarbons (PFCs) are powerful greenhouse gases regulated under the Kyoto Protocol to the United Nations Framework Convention on Climate Change (UNFCCC). Due to their long lifetimes and strong absorption in the infrared, PFCs are considered to have a permanent effect on the Earth’s radiative budget and have global warming
5
potentials (GWPs) 3 to 4 orders of magnitude higher than that of carbon dioxide (CO2),
see Table 1, (Forster et al., 2007). Observations and optimized emission estimates are available for the lower molecular weight PFCs: carbon tetrafluoride (CF4),
hex-afluoroethane (C2F6), octafluoropropane (C3F8) and octafluorocyclobutane (c-C4F8)
(M ¨uhle et al., 2010; Oram et al., 2012; Saito et al., 2010). CF4 is the most abundant
10
PFC and has a significant natural abundance (Deeds et al., 2008; Harnisch et al., 1996a,b; M ¨uhle et al., 2010). The predominant anthropogenic emissions of the lower molecular weight PFCs are from the production of aluminum, usage in the semicon-ductor industry and as refrigerants (M ¨uhle et al., 2010; Oram et al., 2012). Both the aluminum and semiconductor industries have made efforts to reduce emissions of the
15
lower molecular weight PFCs to the atmosphere, although global bottom-up invento-ries do not agree with atmospheric measurement based top-down emission estimates (M ¨uhle et al., 2010; International Aluminium Institute, 2011; Semiconductor Industry Association, 2001; World Semiconductor Council, 2005).
Currently, there are no published observations or top-down emission estimates
20
based on atmospheric measurements for the higher molecular weight PFCs: decafluo-robutane (C4F10), dodecafluoropentane (C5F12), tetradecafluorohexane (C6F14), hex-adecafluoroheptane (C7F16) and octadecafluorooctane (C8F18). These PFCs have
emission sources similar to other halocarbons, e.g. their usage as refrigerants, sol-vents, fire suppressants and foam blowing agents; they were initially suggested as
25
ACPD
12, 4165–4184, 2012Histories of heavy PFCs
D. J. Ivy et al.
Title Page
Abstract Introduction
Conclusions References
Tables Figures
◭ ◮
◭ ◮
Back Close
Full Screen / Esc
Printer-friendly Version Interactive Discussion
Discussion
P
a
per
|
Dis
cussion
P
a
per
|
Discussion
P
a
per
|
Discussio
n
P
a
per
|
source from their use as heat transfer fluids in the semiconductor industry (Tsai, 2009; Tuma and Tousignant, 2001). In this study, the first atmospheric observations of C4F10, C5F12, C6F14, C7F16 and C8F18 are presented based on measurements of Northern
Hemisphere (NH) and Southern Hemisphere (SH) archived air samples. These sam-ples cover a 39-year period, from 1973 to 2011, and include 38 NH and 46 SH
sepa-5
rate samples. Additionally, long-term growth trends are presented based on the atmo-spheric histories for the high molecular weight PFCs.
2 Experimental methods
2.1 Instrumentation
The cryogenic preconcentration gas chromatography-mass spectrometry (GC-MS:
Ag-10
ilent 6890-5973/5975) “Medusa” systems (Miller et al., 2008) were used to measure the heavy PFC mole fractions in archived air samples at the Scripps Institution of Oceanog-raphy (SIO), University of California, San Diego (San Diego, CA) and at the Common-wealth Scientific and Industrial Research Organisation (CSIRO), Division of Marine and Atmospheric Research (CMAR, Aspendale, Australia). These instruments are part of
15
the Advanced Global Atmospheric Gases Experiment (AGAGE) network. For each measurement, the condensables in a 2-l air sample are preconcentrated onto a micro-trap and then cyrofocused onto a second micro-micro-trap (both micro-micro-traps are initially held at−160◦C and subsequently heated for desorption) before injection onto a capillary
column. Currently, the Medusa systems in AGAGE use a CP-PoraBOND Q fused silica
20
PLOT column (25 m, 0.32 mm ID, 5 µm, Agilent Technologies) as the main column for separation of all analytes (except CF4) (see Miller et al. (2008) for details). However for the measurements at CSIRO, the Medusa was fitted with a GS-GasPro column (60 m, 0.32 mm ID, Agilent Technologies) as the main column, which had improved separa-tion for these analytes. To maximize the measurements precisions, the quadrupole
25
ACPD
12, 4165–4184, 2012Histories of heavy PFCs
D. J. Ivy et al.
Title Page
Abstract Introduction
Conclusions References
Tables Figures
◭ ◮
◭ ◮
Back Close
Full Screen / Esc
Printer-friendly Version Interactive Discussion
Discussion
P
a
per
|
Dis
cussion
P
a
per
|
Discussion
P
a
per
|
Discussio
n
P
a
per
|
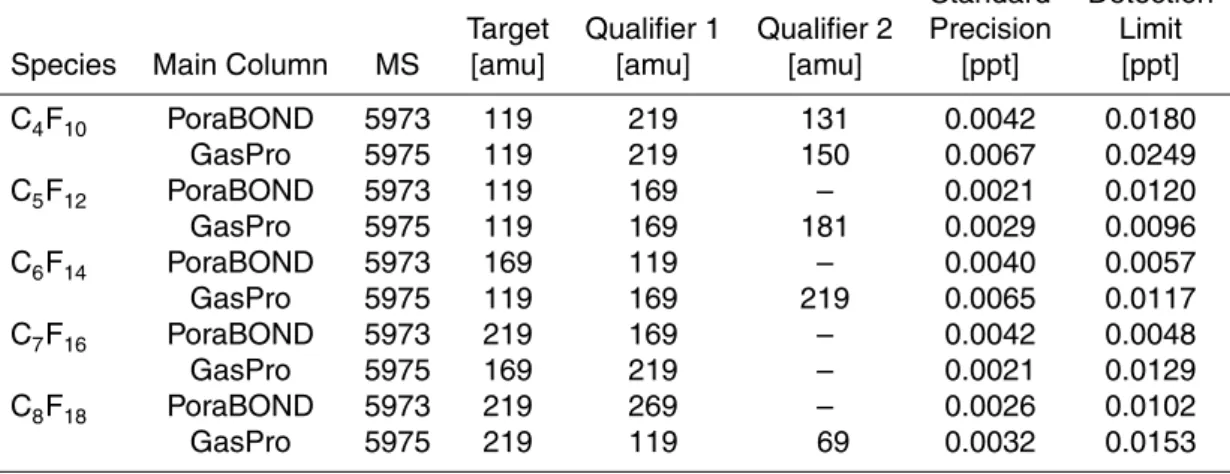
species were measured in this experiment to further improve sample precisions, as compared to the 50+species typically measured as part of the AGAGE network. Each sample measurement was bracketed by a reference gas analysis, allowing for correc-tion of short-term instrumental drift (Prinn et al., 2000). A small blank was detected for C6F14, C7F16 and C8F18, most likely due to the Nafion dryers used in the Medusa,
5
and the observations were corrected accordingly. The detection limits for each species on both instruments were estimated as three times the baseline noise of the target ion immediately preceding and following the elution of the species and are presented in Table 2. The differences in the detection limits between the two instruments are due to the improved separation on the GS-GasPro column used on the CSIRO Medusa and
10
the newer model of MS (5975) used at SIO.
Two experiments were done to assess whether the instrument responses of the Medusa systems were linear over the required range of mixing ratios for each species. In general, the instrument response,R, is related to the sample mole fractions,χ, by
R∝χ(1−ǫ), whereǫis the nonlinearity parameter (Prinn et al., 2000). A dry-air sample 15
from a 2010 Cape Grim Air Archive (CGAA) tank was decanted into a 35-l stainless steel tank (Essex Cryogenics), and spiked with a small volume of high-purity methane (CH4) to increase the CH4mole fractions from ambient to ca. 8 parts per million. From this spiked air sample, six subsamples were prepared in 6-l stainless steel SilcoCan flasks (Restek Inc.) using a vacuum manifold. Each subsample was then diluted by
20
adding “zero-air” (Scott Marrin, that was further purified using a trap of glass beads, activated charcoal, Molecular Sieve 13X and Carboxen 1000 in a dry ice/ethanol bath at−97◦C). The amount of zero-air added was varied to give a range of dilution factors
(nominally from 6.25 % to 75 %). The actual dilution factors for each subsample were determined by precisely measuring the CH4mole fractions (including that of the spiked
25
ACPD
12, 4165–4184, 2012Histories of heavy PFCs
D. J. Ivy et al.
Title Page
Abstract Introduction
Conclusions References
Tables Figures
◭ ◮
◭ ◮
Back Close
Full Screen / Esc
Printer-friendly Version Interactive Discussion
Discussion
P
a
per
|
Dis
cussion
P
a
per
|
Discussion
P
a
per
|
Discussio
n
P
a
per
|
The second experiment to characterize the instrument response involved sampling different volumes from a single air sample (Miller et al., 2008). The range of relative volumes sampled was from 6 % to 200 % of the standard 2-l sample. The volume method has the advantage of characterizing instrument responses at mole fractions above present day background levels, which could not be easily achieved through the
5
dilution subsamples unless more concentrated samples were prepared. However as the atmospheric samples measured in the air archives were all below current atmo-spheric background mole fractions, the volume method served only to complement the dilution method’s instrument response experiment. Generally, the systems exhibited a linear response over much of the required range of mole fractions, with departures
10
from linearity at mole fractions corresponding to those of the oldest archive samples, which have the lowest mole fractions. Based on these dilution experiment measure-ments, a nonlinearity parameter, ǫ, was estimated for each PFC on each instrument and was used to correct the observations.
2.2 Calibration
15
Primary standards were prepared at SIO to identify and quantify the heavy PFCs on the Medusa. The primary standards were prepared following the bootstrap method by step-wise dilution, with dichlorodifluoromethane (CCl2F2, CFC-12) used as the bootstrap gas (Prinn et al., 2000). The high-purity compounds were purchased from Synquest Laboratories with purities of: C4F10 (98 % min.), C5F12 (99 % min.), C6F14 (98.5 %
20
min.), C7F16(98 % min.) and C8F18(99 % min.); the nitrous oxide (N2O) was purchased from Scott Specialty Gases and had a purity of 99.9997 %, and CFC-12 had a purity of 99.99 %. Each high-purity compound was vacuum distilled for further purification by repeated cycles of freezing with liquid nitrogen, vacuum removal of noncondensable contaminants and then thawing.
25
First a gravimetric PFC/CFC-12/N2O mixture was prepared with a molar ratio of
PFC to CFC-12 of 1.85–3.7×10⁻³, with CFC-12 being used as the bootstrap gas
ACPD
12, 4165–4184, 2012Histories of heavy PFCs
D. J. Ivy et al.
Title Page
Abstract Introduction
Conclusions References
Tables Figures
◭ ◮
◭ ◮
Back Close
Full Screen / Esc
Printer-friendly Version Interactive Discussion
Discussion
P
a
per
|
Dis
cussion
P
a
per
|
Discussion
P
a
per
|
Discussio
n
P
a
per
|
these standards were prepared as standard additions and the expected final N2O mole fractions would have been beyond the range of the currently available SIO calibration scale. Therefore, CFC-12 was used as the bootstrap gas, as the resulting final mole fractions of CFC-12 have been shown to be within the linear range on the Medusa.
A primary standard was prepared by spiking a real air sample filled at La Jolla, CA
5
(32.87◦N, 117.25◦W) with the PFC/CFC-12/N
2O mixture. The real air sample was
measured on the Medusa to measure it’s initial CFC-12 mole fractions and instrument response for each PFC. The additional mole fractions added to the real air sample from the PFC/CFC-12/N2O spike were ca. 2 parts per trillion (ppt) of C6F14, 1 ppt of
the other PFCs and 540 ppt of CFC-12. The dilution factor of the PFC/CFC-12/N2O
10
mixture added to the real air sample was determined by measuring the final CFC-12 mole fractions on the Medusa. The final atmospheric mole fractions in the primary standard were estimated as described by Ellison and Thompson (2008).
The primary standard was measured on the Medusa to determine the retention times and mass spectra of the heavy PFCs as well as to quantify the atmospheric
observa-15
tions. Table 2 shows the target and qualifier mass-to-charge ratios used on the SIO and CSIRO Medusa systems; the target mass-to-charge ratio is used for identification and quantitation, while the qualifiers are only used for ensuring the proper identification of the species. Four primary standards were prepared and the calibration scales have estimated accuracies of 6.8 % for C4F10, 7.8 % for C5F12, 4.0 % for C6F14, 6.6 % for
20
C7F16and 7.9 % for C8F18.
3 Archived air samples
The atmospheric histories of these heavy PFCs are based on measurements made at SIO and CSIRO of NH and SH archived air samples, which cover a 39-year period. In total, 38 NH separate samples (35 measured at SIO and 3 measured at CSIRO)
25
ACPD
12, 4165–4184, 2012Histories of heavy PFCs
D. J. Ivy et al.
Title Page
Abstract Introduction
Conclusions References
Tables Figures
◭ ◮
◭ ◮
Back Close
Full Screen / Esc
Printer-friendly Version Interactive Discussion
Discussion
P
a
per
|
Dis
cussion
P
a
per
|
Discussion
P
a
per
|
Discussio
n
P
a
per
|
or Trinidad Head, California (41.05◦N, 124.05◦W) during baseline conditions and are
from the laboratories of the late C.D. Keeling; R.F. Keeling; and R.F. Weiss at SIO. The fill techniques, tank materials, tank sizes and fill purposes of the tanks varied. Two tanks were rejected as they were clearly identified as outliers with atmospheric mole fractions significantly higher than present day values. From 2003, a collection of tanks
5
containing NH air have been maintained at R.F. Weiss’s laboratory at SIO as an air archive. These tanks were filled at Trinidad Head, California using a modified oil-free compressor (Rix Industries) in 35-l internally electropolished stainless steel cylinders (Essex Cryogenics). Recent filled archive tanks agree with in situ measurements made by the Medusa system at the time of the tank filling for the high molecular weight PFCs
10
studied here, confirming that the modified Rix compressor does not contribute to the integrity of these samples for the high molecular weight PFCs.
Forty-six separate SH samples filled between 1978 and 2010 were also measured (6 at SIO and 40 at CSIRO). All but three of these tanks, which were from the M.A. Whalen laboratory at SIO, are part of the CGAA collection (Krummel et al., 2007; Langenfelds
15
et al., 1996). The CGAA samples analyzed as part of this study consist of whole air samples cryogenically filled in 35-l internally electropolished stainless steel cylin-ders at the Cape Grim Baseline Air Pollution Station in Tasmania, Australia (40.68◦S,
144.69◦E), except for three which were cryogenically collected in 48-l aluminum
cylin-ders; these latter three samples were rejected for their C8F18 values as they were
sig-20
nificantly higher than present-day background mole fractions. Four archive samples, all collected in 2001, had significantly higher than current baseline mole fractions for C7F16 and these values were consequently flagged as contaminated; these included
the three tanks from the M.A. Whalen laboratory and one CGAA tank.
Seven subsamples of the CGAA, covering the time period of 1986 to 2008, were
25
ACPD
12, 4165–4184, 2012Histories of heavy PFCs
D. J. Ivy et al.
Title Page
Abstract Introduction
Conclusions References
Tables Figures
◭ ◮
◭ ◮
Back Close
Full Screen / Esc
Printer-friendly Version Interactive Discussion
Discussion
P
a
per
|
Dis
cussion
P
a
per
|
Discussion
P
a
per
|
Discussio
n
P
a
per
|
Generally, the measurements on the two systems agreed well within the measure-ment uncertainty, with a maximum difference of 0.0088 ppt for C8F18. For both sets
of archived samples, at least 3 replicate measurements were made of each sample; for younger samples, 5 to 6 replicate measurements were made since more air was available. The measurement errors on the samples are estimated as the 1-σ standard
5
deviations of the repeat measurements.
4 Results and discussion
The atmospheric histories from 1973 to 2011 for the high molecular weight PFCs stud-ied here are shown in Fig. 1. C4F10 and C5F12 are present in the earliest archived
samples at 0.015 ppt and 0.011 ppt, respectively. C4F10 and C5F12 exhibit
quasi-10
exponential growth in the 1980s and early 1990s and then grow linearly to present day globally averaged background atmospheric mole fractions of 0.18 ppt and 0.12 ppt, respectively. The slow-down in growth rates in the mid-1990s suggest that emissions were decreasing, as is supported by the decreases in the inter-hemispheric gradients, for C4F10 and C5F12. Emissions of these high molecular weight PFCs are of
anthro-15
pogenic origin and primarily released in the Northern Hemisphere. Therefore as is expected, we see higher atmospheric mole fractions in the Northern Hemisphere than in the Southern Hemisphere due to the 1 to 2 year mixing time between the two hemi-spheres. Additionally, higher variability in the NH samples can be seen, as compared to the SH samples. This is attributed to sampling of less well mixed air due to
emis-20
sions originating primarily in the NH, although efforts are made to fill the archive tanks during baseline conditions.
C6F14 and C7F16 are not detectable in the archived samples until 1985 and grow quasi-exponentially until 1999. C8F18 follows a similar trend to those of C6F14 and
C7F16, although it is not detectable until the mid-1990s, which could be due to its
25
higher detection limit than for C6F14 and C7F16. After 1996 the growth rates of C6F14, C7F16 and C8F18 slow, suggesting a decline in global emissions. The most abundant
ACPD
12, 4165–4184, 2012Histories of heavy PFCs
D. J. Ivy et al.
Title Page
Abstract Introduction
Conclusions References
Tables Figures
◭ ◮
◭ ◮
Back Close
Full Screen / Esc
Printer-friendly Version Interactive Discussion
Discussion
P
a
per
|
Dis
cussion
P
a
per
|
Discussion
P
a
per
|
Discussio
n
P
a
per
|
fraction of 0.28 ppt in 2011. The globally averaged atmospheric mole fraction in 2011 is 0.12 ppt for C7F16, and C8F18 is the least abundant of all of these PFCs at 0.09 ppt. In general, the NH archived air samples have higher atmospheric mole fractions than the SH samples with similar fill dates, suggesting that the emissions are primarily in the NH, as was seen for C4F10 and C5F12. There is one anomalous NH tank with
5
a fill date in 1986 for C6F14, C7F16 and C8F18, which has lower atmospheric mole
fractions than the SH tanks with similar fill dates. However, this 1986 NH air sample is below the detection limit of the SIO instrument; additionally, the tank was not filled for the purpose of an air archive and has been to shown to have non-background mole fractions for C2F6, C3F8and sulfur hexafluoride (SF6).
10
Due to the sparseness of the available data set, the presented growth rates are based on cubic smoothed spline fits to the observations. The observations were weighted by their measurement uncertainty and a 50 % attenuation period of 5 years was used, which is slightly larger than the mean data-spacing, in estimating the smoothing splines (Enting et al., 2006). The smoothed spline fits are shown along
15
with the observations in Fig. 1. Table 3 shows the 2011 globally averaged background atmospheric mole fractions, and the average global mole fractions and growth rates from 1973 to 2011, which are based on the cubic smoothed spline fits to the obser-vations. Figure 2 shows the annual growth rates estimated from the cubic smoothed spline fit to each PFC observations in each hemisphere. The fastest growth rates were
20
in the late 1980s and early 1990s for C4F10 and C5F12, while the growth rates for
C6F14, C7F16and C8F18peaked later in the 1990s. Additionally, we see the SH growth
rates generally lagging the NH growth rates, also confirming that the emissions are primarily in the NH. The growth rates of these heavy PFCs have been decreasing for the past 10 to 15 years to the 2011 globally averaged growth rates of: 2.31 ppq yr−1 25
for C4F10, 1.38 ppq yr−1for C
5F12, 5.58 ppq yr− 1
for C6F14, 3.68 ppq yr−1for C
7F16 and
0.99 ppq yr−1 for C
8F18. This decrease in growth rates, suggest a decrease in
emis-sion rates; although, C7F16 appears to have a more constant growth rate at the end,
ACPD
12, 4165–4184, 2012Histories of heavy PFCs
D. J. Ivy et al.
Title Page
Abstract Introduction
Conclusions References
Tables Figures
◭ ◮
◭ ◮
Back Close
Full Screen / Esc
Printer-friendly Version Interactive Discussion
Discussion
P
a
per
|
Dis
cussion
P
a
per
|
Discussion
P
a
per
|
Discussio
n
P
a
per
|
Based on the globally averaged 2011 atmospheric mole fractions (Table 3), the global radiative forcing of each PFC can be estimated using the radiative efficiencies pre-sented in Table 1. For C4F10, C5F12 and C6F14 we use the radiative efficiencies given
by Forster et al. (2007), and for C7F16 and C8F18, we use the radiative efficiencies
given by Ivy et al. (2012). C6F14 contributes the most of these high molecular weight
5
PFCs to the global radiative forcing in 2011, and is similar to that of C3F8. The other
PFCs in this study contribute approximately equally to global radiative forcing; and in total the high molecular weight PFCs 2011 atmospheric mole fractions contribute to a globally averaged radiative forcing of 0.35 mW m−2.
5 Conclusions and future implications
10
Atmospheric histories and long-term growth trends have been presented for the first time for the high molecular weight PFCs: C4F10, C5F12, C6F14, C7F16 and C8F18. The
histories and trends are based on new measurements of a collection of NH archived air samples and a subset of the CGAA. The measurements were made with the Medusa systems and are calibrated against new primary standards for these PFCs. The
contri-15
bution of all of the heavy PFCs studied here to global radiative forcing is 0.35 mW m−2.
While this is relatively small compared to the total radiative forcing of 2434 mW m−2 in
2008 for all species regulated under the Kyoto Protocol, the heavy PFC atmospheric mole fractions in 2011 contribute up to 3.6 % of the total PFC radiative forcing (Montzka and Reimann, 2011; M ¨uhle et al., 2010; Oram et al., 2012).
20
The heavy PFCs in this study exhibited the largest growth in the 1980s and 1990s and have since slowed, suggesting that recent emissions may be decreasing as alter-native compounds, with most likely lower GWPs, are used. Based on previous studies, atmospheric observations are crucial in providing measurement-based emission esti-mates to verify bottom-up inventories, which often show large discrepancies (M ¨uhle
25
ACPD
12, 4165–4184, 2012Histories of heavy PFCs
D. J. Ivy et al.
Title Page
Abstract Introduction
Conclusions References
Tables Figures
◭ ◮
◭ ◮
Back Close
Full Screen / Esc
Printer-friendly Version Interactive Discussion
Discussion
P
a
per
|
Dis
cussion
P
a
per
|
Discussion
P
a
per
|
Discussio
n
P
a
per
|
industries, which primarily focus on the low molecular weight PFCs, are indeed reduc-ing global PFC emissions. Although PFCs contribute a relatively small amount to global radiative forcing, as compared to other greenhouse gases, due to their long lifetimes PFCs are considered to have a permanent effect on the Earth’s radiative budget.
Acknowledgements. This research is supported by the NASA Upper Atmospheric Research
5
Program in the US with grants NNX07AE89G to MIT, NNX07AF09G and NNX07AE87G to SIO, Defra and NOAA in the UK, CSIRO and the Australian Government Bureau of Meteorology in Australia to the AGAGE network and a consortium of 40 industrial and foundation sponsors of the MIT Joint Program on the Science and Policy of Global Change (see http://globalchange. mit.edu/sponsors/current.html. We’d additionally like to thank Randy Dickau, Jeremy Ward, 10
Nigel Somerville and the late Laurie Porter for their meticulous work at the Trinidad Head, California and Cape Grim, Tasmania stations and Rebecca Gregory and Stephanie Mumma for their help at CSIRO and SIO. We thank the late Charles D. Keeling and Ralph F. Keeling for Northern Hemisphere archived air samples.
References
15
Bravo, I. A., Aranda, A., Hurley, M. D., Marston, G., Nutt, D. R., Shine, K. P., Smith, K., and Wallington, T. J.: Infrared absorption spectra, radiative efficiencies, and global warming po-tentials of perfluorocarbons: comparison between experiment and theory, J. Geophys. Res., 115, D24317, doi:10.1029/2010JD014771, 2010. 4180
Deeds, D. A., Vollmer, M. K., Kulongoski, J. T., Miller, B. R., M ¨uhle, J., Harth, C. M., 20
Izbick, J. A., Hilton, D. R., and Weiss, R. F.: Evidence for crustal degassing of CF4 and SF6 in Mojave Desert groundwaters, Geochim. Cosmochi. Ac., 72(4), 999–1013, doi:10.1016/j.gca.2007.11.027, 2008. 4167
Ellison, S. L. R. and Thompson, M.: Standard additions: myth and reality, The Analyst, 133, 992–997, doi:10.1039/b717660k, 2008. 4171
25
Enting, I. G., Trudinger, C. M., and Etheridge, D. M.: Propagating data uncertainty through smoothing spline fits, Tellus B, 58, 305–309, doi:10.1111/j.1600-0889.2006.00193.x, 2006. 4174
ACPD
12, 4165–4184, 2012Histories of heavy PFCs
D. J. Ivy et al.
Title Page
Abstract Introduction
Conclusions References
Tables Figures
◭ ◮
◭ ◮
Back Close
Full Screen / Esc
Printer-friendly Version Interactive Discussion
Discussion
P
a
per
|
Dis
cussion
P
a
per
|
Discussion
P
a
per
|
Discussio
n
P
a
per
|
Agency (PBL): Emission Database for Global Atmospheric Research (EDGAR), Release 4.0, available at: http://edgar.jrc.ec.europa.eu, last access: 15 December 2011, 2009.
Forster, P., Ramaswamy, V., Artaxo, P., Berntsen, T., Betts, R., Fahey, D. W., Haywood, J., Lean, J., Lowe, D. C., Myhre, G., Nganga, J., Prinn, R., Raga, G., Schulz, M., and Van Dor-land, R.: Changes in atmospheric constituents and in radiative forcing, in: Climate Change 5
2007: The Physical Science Basis. Contribution of Working Group 1 to the Fourth Assess-ment Report of the IntergovernAssess-mental Panel on Climate Change, edited by: Solomon, S., Qin, D., Manning, M., Chen, Z., Marquis, M., Averyt, K. B., Tignor, K. B., and Miller, H. L., Cambridge Univ. Press, Cambridge, UK and New York, NY, USA, 2007. 4167, 4175, 4180 Francey, R. J., Steele, L. P., Spencer, D. A., Langenfelds, R. L., Law, R. M., Krummel, P. B., 10
Fraser, P. J., Etheridge, D. M., Derek, N., Coram, S. A., Cooper, L. N., Allison, C. E., Porter, L., and Baly, S.: The CSIRO (Australia) measurement of greenhouse gases in the global atmo-sphere, in: Baseline Atmospheric Program Australia 1999–2000, edited by: Tindale, N. W., Derek, N., and Fraser, P. J., Bur. of Meteorol., Melbourne, Victoria, Australia, 42–53, 2003. 4169
15
Harnisch, J., Borchers, R., Fabian, P., G ¨aggeler, H. W., and Schotterer, U.: Effect of natural tetrafluoromethane, Nature, 384, p. 32, doi:10.1038/384032a0, 1996a. 4167
Harnisch, J., Borchers, R., Fabian, P., and Maiss, M.: Tropospheric trends for CF4 and C2F6 since 1982 derived from SF6 dated stratospheric air, Geophys. Res. Lett., 23(10), 1099– 1102, doi:10.1029/96GL01198, 1996b. 4167
20
International Aluminium Institute: Results of the 2010 Anode Effect Survey: Report on the Aluminum Industry’s Global Perfluorocarbon Gases Emissions Reduction Programme, Inter-national Aluminium Institute, London, UK, 2011. 4167
Ivy, D. J., Rigby, M., Baasandorj, M., Burkholder, J. B., and Prinn, R. G.: Global emission estimates and radiative impact of the high molecular weight perfluorocarbons: C4F10, C5F12, 25
C6F14, C7F16and C8F18, in preparation, 2012. 4175, 4180
Krummel, P. B., Langenfelds, R. L., Fraser, P. J., Steele, L. P., and Porter, L. W.: Archiv-ing of Cape Grim air, in: Baseline Atmospheric Program (Australia) 2005–2006, edited by: Cainey, J. M., Derek, N., and Krummel, P. B., Bur. of Meteorol., Melbourne, Victoria, Aus-tralia, 55–57, 2007. 4172
30
ACPD
12, 4165–4184, 2012Histories of heavy PFCs
D. J. Ivy et al.
Title Page
Abstract Introduction
Conclusions References
Tables Figures
◭ ◮
◭ ◮
Back Close
Full Screen / Esc
Printer-friendly Version Interactive Discussion
Discussion
P
a
per
|
Dis
cussion
P
a
per
|
Discussion
P
a
per
|
Discussio
n
P
a
per
|
Meteorol., Melbourne, Victoria, Australia, 53–70, 1996. 4172
Miller, B. R., Weiss, R. F., Salameh, P. K., Tanhua, T., Greally, B. R., M ¨uhle, J., and Sim-monds, P. G.: Medusa: a sample preconcentration and GC/MS detector system for in situ measurements of atmospheric trace halocarbons, hydrocarbons, and sulfur compounds, Anal. Chem., 80(5), 1536–1545, doi:10.1021/ac702084k, 2008. 4168, 4170
5
Montzka, S. A. and Reimann, S.: Ozone-depleting substances (ODSs) and related chemicals, in: Scientific Assessment of Ozone Depletion: 2010, Global Ozone Research and Monitoring Project, Rep. 52, World Meteorol. Org., Geneva, Switzerland, 1–108, 2011. 4175
M ¨uhle, J., Ganesan, A. L., Miller, B. R., Salameh, P. K., Harth, C. M., Greally, B. R., Rigby, M., Porter, L. W., Steele, L. P., Trudinger, C. M., Krummel, P. B., O’Doherty, S., Fraser, P. J., 10
Simmonds, P. G., Prinn, R. G., and Weiss, R. F.: Perfluorocarbons in the global atmo-sphere: tetrafluoromethane, hexafluoroethane, and octafluoropropane, Atmos. Chem. Phys., 10, 5145–5164, doi:10.5194/acp-10-5145-2010, 2010. 4167, 4175
Oram, D. E., Mani, F. S., Laube, J. C., Newland, M. J., Reeves, C. E., Sturges, W. T., Pen-kett, S. A., Brenninkmeijer, C. A. M., R ¨ockmann, T., and Fraser, P. J.: Long-term tropospheric 15
trend of octafluorocyclobutane (c-C4F8 or PFC-318), Atmos. Chem. Phys., 12, 261–269, doi:10.5194/acp-12-261-2012, 2012. 4167, 4175
Prinn, R. G., Weiss, R. F., Fraser, P. J., Simmonds, P. G., Cunnold, D. M., Alyea, F. N., O’Doherty, S., Salameh, P., Miller, B. R., Huang, J., Wang, R. H. J., Hartley, D. E., Harth, C., Steele, L. P., Sturrock, G., Midgley, P. M., and McCulloch, A.: A history of chemically and 20
radiatively important gases in air deduced from ALE/GAGE/AGAGE, J. Geophys. Res., 105(D14), 17751–17792, 2000. 4169, 4170
Saito, T., Yokouchi, Y., Stohl, A., Taguchi, S., and Mukai, H.: Large emissions of perfluoro-carbons in East Asia deduced from continuous atmospheric measurements, Environ. Sci. Technol., 44(11), 4089–4095, doi:10.1021/es1001488, 2010. 4167
25
Semiconductor Industry Association: Semiconductor Industry Association Announces PFC Re-duction and Climate Partnership with US EPA, Semiconductor Industry Association Press Release, 2001. 4167
Shine, K. P., Gohar, L. K., Hurley, M. D., Marston, G., Martin, D., Simmonds, P. G., Walling-ton, T. J., and Watkins, M.: Perfluorodecalin: global warming potential and first detection 30
in the atmosphere, Atmos. Environ., 39, 1759–1763, doi:10.1016/j.atmosenv.2005.01.001, 2005. 4180
ACPD
12, 4165–4184, 2012Histories of heavy PFCs
D. J. Ivy et al.
Title Page
Abstract Introduction
Conclusions References
Tables Figures
◭ ◮
◭ ◮
Back Close
Full Screen / Esc
Printer-friendly Version Interactive Discussion
Discussion
P
a
per
|
Dis
cussion
P
a
per
|
Discussion
P
a
per
|
Discussio
n
P
a
per
|
greenhouse gases, Environ. Int., 35(2), 418–424, doi:10.1016/j.envint.2008.08.009, 2009. 4167, 4168
Tuma, P. and Tousignant, L.: Reducing emissions of PFC heat transfer fluids, presented at SEMI Technical Symposium, 3M Specialty Materials, 1–8, San Francisco, CA, 16 July 2001. 4168
5
UNEP Technology and Economic Assessment Panel: The implications to the Montreal Protocol of the inclusion of HFCs and PFCs in the Kyoto Protocol, in: Report of the TEAP HFC and PFC Task Force, Ozone Secretariat, United Nations Environment Programme, Nairobi, Kenya 1–86, 1999. 4167
World Semiconductor Council: Semiconductor manufacturers reduce PFC emissions, World 10
ACPD
12, 4165–4184, 2012Histories of heavy PFCs
D. J. Ivy et al.
Title Page
Abstract Introduction
Conclusions References
Tables Figures
◭ ◮
◭ ◮
Back Close
Full Screen / Esc
Printer-friendly Version Interactive Discussion
Discussion
P
a
per
|
Dis
cussion
P
a
per
|
Discussion
P
a
per
|
Discussio
n
P
a
per
|
Table 1.Lifetimes, Radiative Efficiencies and Global Warming Potentials of Perfluorocarbons.
Lifetime Radiative Efficiency Global Warming Potential (GWP) Species [yr] [W m−2ppb−1] 20-yr horizon 100-yr horizon 500-yr horizon
CF4a 50000 0.10 5210 7390 11200
C2F6a 10000 0.26 8630 12200 18200
C3F8a 2600 0.26 6310 8830 12500
c-C4F8a 3200 0.32 7310 10300 14700
C4F10a 2600 0.33 6330 8860 12500
C5F12a 4100 0.41 6510 9160 13300
C6F14a 3200 0.49 6600 9300 13300
C7F16b (3000) 0.45 – – –
C7F16c (3000) 0.48 – – –
C8F18b (3000) 0.50 5280 7390 10500
C8F18c (3000) 0.57 – – –
C10F18d >1000 0.56 >5500 >7500 >9500
ACPD
12, 4165–4184, 2012Histories of heavy PFCs
D. J. Ivy et al.
Title Page
Abstract Introduction
Conclusions References
Tables Figures
◭ ◮
◭ ◮
Back Close
Full Screen / Esc
Printer-friendly Version Interactive Discussion
Discussion
P
a
per
|
Dis
cussion
P
a
per
|
Discussion
P
a
per
|
Discussio
n
P
a
per
|
Table 2.Target and Qualifier Mass-to-Charge Ratios, Standard Precisions and Detection Limits for C4F10, C5F12, C6F14, C7F16and C8F18.
Standard Detection Target Qualifier 1 Qualifier 2 Precision Limit
Species Main Column MS [amu] [amu] [amu] [ppt] [ppt]
C4F10 PoraBOND 5973 119 219 131 0.0042 0.0180
GasPro 5975 119 219 150 0.0067 0.0249
C5F12 PoraBOND 5973 119 169 – 0.0021 0.0120
GasPro 5975 119 169 181 0.0029 0.0096
C6F14 PoraBOND 5973 169 119 – 0.0040 0.0057
GasPro 5975 119 169 219 0.0065 0.0117
C7F16 PoraBOND 5973 219 169 – 0.0042 0.0048
GasPro 5975 169 219 – 0.0021 0.0129
C8F18 PoraBOND 5973 219 269 – 0.0026 0.0102
ACPD
12, 4165–4184, 2012Histories of heavy PFCs
D. J. Ivy et al.
Title Page
Abstract Introduction
Conclusions References
Tables Figures
◭ ◮
◭ ◮
Back Close
Full Screen / Esc
Printer-friendly Version Interactive Discussion
Discussion
P
a
per
|
Dis
cussion
P
a
per
|
Discussion
P
a
per
|
Discussio
n
P
a
per
|
Table 3. Global Mean (from 1973 to 2011) Mole Fractions and Growth Rates, 2011 Mole Fractions and Radiative Forcing of C4F10, C5F12, C6F14, C7F16and C8F18.
Mean Mean 2011 2011
Mole Fractions Growth Rate Mole Fractions Radiative Forcing
Species [ppt] [ppq yr−1] [ppt] [mW m−2]
C4F10 0.101 4.58 0.18 0.059
C5F12 0.072 3.29 0.12 0.049
C6F14 0.119 7.50 0.28 0.137
C7F16 0.053 3.19 0.12 0.058
ACPD
12, 4165–4184, 2012Histories of heavy PFCs
D. J. Ivy et al.
Title Page
Abstract Introduction
Conclusions References
Tables Figures
◭ ◮
◭ ◮
Back Close
Full Screen / Esc
Printer-friendly Version Interactive Discussion
Discussion
P
a
per
|
Dis
cussion
P
a
per
|
Discussion
P
a
per
|
Discussio
n
P
a
per
|
0 0.1 0.2
C 4
F 10
[ppt]
0 0.05 0.1
C 5
F 12
[ppt]
0 0.1 0.2
C 6
F 14
[ppt]
0 0.05 0.1
C 7
F 16
[ppt]
1975 1980 1985 1990 1995 2000 2005 2010 0
0.05 0.1
Northern Hemisphere
Southern Hemisphere
C 8
F 18
[ppt]
ACPD
12, 4165–4184, 2012Histories of heavy PFCs
D. J. Ivy et al.
Title Page
Abstract Introduction
Conclusions References
Tables Figures
◭ ◮
◭ ◮
Back Close
Full Screen / Esc
Printer-friendly Version Interactive Discussion
Discussion
P
a
per
|
Dis
cussion
P
a
per
|
Discussion
P
a
per
|
Discussio
n
P
a
per
|
0 5 10
C 4 F 10
[ppq/yr]
0 5
C 5 F 12
[ppq/yr]
0 10 20
C 6 F 14
[ppq/yr]
0 5
C 7 F 16
[ppq/yr]
1975 1980 1985 1990 1995 2000 2005 2010 0
5 10
Northern Hemisphere
Southern Hemisphere
C 8 F 18
[ppq/yr]

![Fig. 2. Annual Northern Hemisphere and Southern Hemisphere atmospheric growth rates based on cubic smoothed splines to the observations in parts per quadrillion [ppq] per year, see Sect](https://thumb-eu.123doks.com/thumbv2/123dok_br/16368811.190892/20.918.99.624.107.490/northern-hemisphere-southern-hemisphere-atmospheric-smoothed-observations-quadrillion.webp)
