AMTD
7, 9453–9479, 2014Measurements of CH3O2NO2 in the
upper troposphere
B. A. Nault et al.
Title Page
Abstract Introduction
Conclusions References
Tables Figures
◭ ◮
◭ ◮
Back Close
Full Screen / Esc
Printer-friendly Version
Interactive Discussion
Discussion
P
a
per
|
Discus
sion
P
a
per
|
Discussion
P
a
per
|
Discussion
P
a
per
|
Atmos. Meas. Tech. Discuss., 7, 9453–9479, 2014 www.atmos-meas-tech-discuss.net/7/9453/2014/ doi:10.5194/amtd-7-9453-2014
© Author(s) 2014. CC Attribution 3.0 License.
This discussion paper is/has been under review for the journal Atmospheric Measurement Techniques (AMT). Please refer to the corresponding final paper in AMT if available.
Measurements of CH
3
O
2
NO
2
in the upper
troposphere
B. A. Nault1, C. Garland2, S. E. Pusede2,*, P. J. Wooldridge2, K. Ullmann3, S. R. Hall3, and R. C. Cohen1,2
1
Department of Earth and Planetary Science, University of California at Berkeley, Berkeley, CA, USA
2
Department of Chemistry, University of California at Berkeley, Berkeley, CA, USA
3
Atmospheric Chemistry Division, National Center for Atmospheric Research, Boulder, CO, USA
*
now at: NASA Langley Research Center, Hampton, VA, USA
Received: 2 September 2014 – Accepted: 10 September 2014 – Published: 17 September 2014
Correspondence to: R. C. Cohen ([email protected])
AMTD
7, 9453–9479, 2014Measurements of CH3O2NO2 in the
upper troposphere
B. A. Nault et al.
Title Page
Abstract Introduction
Conclusions References
Tables Figures
◭ ◮
◭ ◮
Back Close
Full Screen / Esc
Printer-friendly Version
Interactive Discussion
Discussion
P
a
per
|
Discus
sion
P
a
per
|
Discussion
P
a
per
|
Discussion
P
a
per
|
Abstract
The non-acyl peroxy nitrates, HO2NO2and CH3O2NO2, are predicted to be important
for photochemistry at low temperatures characteristic of the upper troposphere. We report the first measurements of methyl peroxy nitrate (CH3O2NO2). During the Deep Convective Clouds and Chemistry (DC-3) and the Studies of Emissions and
Atmo-5
spheric Composition, Clouds, and Climate Coupling by Regional Surveys (SEAC4RS) experiments, different inlet configurations for the UC Berkeley Thermal Dissociation-Laser Induced Instrument were tested to optimize measurements of CH3O2NO2 from
the NASA DC-8. In addition, the inlet modifications were optimized for measurements of NO2 without CH3O2NO2 interferences. The CH3O2NO2 measurements we report
10
have a detection limit (S/N=2) of 15 pptv (parts per trillion by volume) at 1 min aver-aging on a background of 200 pptv NO2and an accuracy of±40 %. Both observations
and theoretical calculations were used to constrain the interference of pernitric acid (HO2NO2), which partially decomposes (∼11 %) along with CH3O2NO2in our heated
CH3O2NO2 channel. Evaluation of the accuracy of the CH3O2NO2 measurements is 15
presented.
1 Introduction
Non-acyl peroxy nitrates, such as pernitric acid (HO2NO2) and methyl peroxy nitrate
(CH3O2NO2), have lower thermal stability and shorter lifetimes than acetyl peroxy nitrates such as peroxy acetyl nitrate (PAN) and peroxy proionyl nitrate (PPN). Both
20
classes of peroxy nitrates are temporary reservoirs of NOx (NOx≡NO+NO2) and in
that role indirectly modulate the rate of ozone production.
The non-acyl peroxy nitrates, HO2NO2(thermal lifetime at 300 K of less than 1 min)
and CH3O2NO2 (thermal lifetime at 300 K of less than 1 s), are most important to the
chemistry of the troposphere at low temperatures (below ∼260 K for HO2NO2 and 25
AMTD
7, 9453–9479, 2014Measurements of CH3O2NO2 in the
upper troposphere
B. A. Nault et al.
Title Page
Abstract Introduction
Conclusions References
Tables Figures
◭ ◮
◭ ◮
Back Close
Full Screen / Esc
Printer-friendly Version
Interactive Discussion
Discussion
P
a
per
|
Discus
sion
P
a
per
|
Discussion
P
a
per
|
Discussion
P
a
per
|
2002; Murphy et al., 2004; Kim et al., 2007; Browne et al., 2011) and at high NOx mixing ratios (Spencer et al., 2009). HO2NO2is also important for the chemistry of the
stratosphere (e.g., Wennberg et al., 1999). The non-acyl peroxy nitrates are produced through the reaction of the methyl peroxy radical or hydroperoxy radical with nitrogen dioxide (Reactions R1 and R2). More complex analogs exist, such as ethyl peroxy
5
nitrate and acetone peroxy nitrate, but their abundance in the atmosphere is expected to be much lower than HO2NO2or CH3O2NO2(e.g., Murphy et al., 2004; Browne et al., 2011). Laboratory experiments have shown these more complex analogs have similar thermal lifetimes to CH3O2NO2 (e.g., Zabel et al., 1989; Elfers et al., 1990; Sehested
et al., 1998).
10
Peroxy nitrates are chemically destroyed by thermal decomposition (the reverse of Reactions R1 and R2) followed by reaction of the peroxy radical with NO or HO2.
Photolysis, including near-IR wavelengths for HO2NO2, and the reaction of OH with
HO2NO2are additional loss mechanisms (Reactions R3–R5).
CH3O2+NO2+M ↔ CH3O2NO2+M (R1) 15
HO2+NO2+M ↔ HO2NO2+M (R2)
HO2NO2(CH3O2NO2)+hν → HO2(CH3O2)+NO2 (R3)
or → OH(CH3O)+NO3 (R4)
HO2NO2+OH → H2O+NO2+O2 (R5)
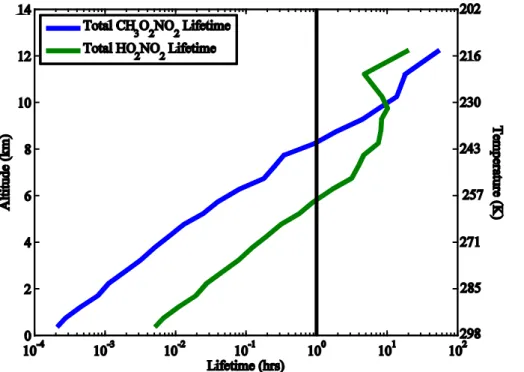
In the upper troposphere (temperature∼225 K), HO2NO2has a shorter lifetime (∼7 h) 20
than CH3O2NO2(∼15 h) during the daytime due to photolysis and photooxidation
(Re-actions R3–R5) while at nighttime, CH3O2NO2 has a shorter lifetime (∼22 h) than
HO2NO2(∼540 h) due to thermal stability (Reactions R1–R2).
Browne et al. (2011) investigated the role of CH3O2NO2 for NOx and O3 chemistry
using the GEOS-Chem global chemical transport model. They showed that at
temper-25
AMTD
7, 9453–9479, 2014Measurements of CH3O2NO2 in the
upper troposphere
B. A. Nault et al.
Title Page
Abstract Introduction
Conclusions References
Tables Figures
◭ ◮
◭ ◮
Back Close
Full Screen / Esc
Printer-friendly Version
Interactive Discussion
Discussion
P
a
per
|
Discus
sion
P
a
per
|
Discussion
P
a
per
|
Discussion
P
a
per
|
by 14–28 % while increasing HO2 by 10–25 %. These changes are accompanied by 12–70 pptv less NOx, 15–40 pptv less HNO3, and 1.3–2.6 ppbv less O3.
Another impact of non-acyl peroxy nitrates is that they are a possible positive inter-ference to in-situ NO2 measurements in the upper troposphere because the non-acyl peroxy nitrates dissociate in the instruments’ inlet prior to detection of ambient NO2 5
(Browne et al., 2011). Browne et al. quantified the CH3O2NO2interference to NO2
mea-surements using the UC Berkeley Thermal Dissociation-Laser Induced Fluorescence (TD-LIF) in the NASA DC-8 and the interference was as much as∼43 %, increasing
as ambient temperatures decreased in the range 255 to 225 K. As the instrument com-pares well with other measurements of NO2 and as the physical mechanism of the
10
interference is understood, it should be presumed that most other NO2 instruments suffer from the same interferences. Thus, it is essential to either correct the NO2for the
presence of thermally dissociated non-acyl peroxy nitrates or interpret the NO2
mea-surements as XNO2, where XNO2 is the sum of ambient NO2 and some or all of the non-acyl peroxy nitrates (Browne et al., 2011).
15
In order to make unambiguous measurements of NO2 and CH3O2NO2, we
devel-oped new configurations of the TD-LIF inlet. In this paper, we describe the design and performance of the modified inlet, provide recommendations for minimizing and elimi-nating CH3O2NO2interference with NO2, and present observations of CH3O2NO2from
DC-3 and SEAC4RS. These measurements are the first to isolate CH3O2NO2directly.
20
2 Thermal dissociation-laser induced fluorescence detection of CH3O2NO2
2.1 Thermal dissociation-laser induced fluorescence
The TD-LIF instrument has been described previously (Thornton et al., 2000; Day et al., 2002; Wooldridge et al., 2010). Briefly, NO2 is measured by laser induced fluores-cence (Thornton et al., 2000) with supersonic expansion (Cleary et al., 2002). A 7 kHz,
25
AMTD
7, 9453–9479, 2014Measurements of CH3O2NO2 in the
upper troposphere
B. A. Nault et al.
Title Page
Abstract Introduction
Conclusions References
Tables Figures
◭ ◮
◭ ◮
Back Close
Full Screen / Esc
Printer-friendly Version
Interactive Discussion
Discussion
P
a
per
|
Discus
sion
P
a
per
|
Discussion
P
a
per
|
Discussion
P
a
per
|
∼20 ns pulses at 585 nm and a bandwidth of 0.06 cm−1. The laser light is focused
through two multipass White cells. Red-shifted fluorescence (wavelengths greater than 700 nm) from the excited NO2 molecules is detected at a right angle to the excitation using a red sensitive photomultiplier tube (Hamamatsu H7421-50). Scattered light is eliminated using time gated detection and dielectric band pass filters that block light at
5
wavelengths less than 700 nm. Fluorescence counts are collected at 4 Hz and recorded as one second averages. The dye laser is tuned on (9 s) and off(3 s) an isolated rovi-bronic feature of the jet-cooled NO2at 585 nm. The ratio between the peak and
back-ground NO2 fluorescence is 10 : 1 sampling from 1 atm ambient pressure. Calibration is performed at least every hour during a level flight leg or after a significant change in
10
altitude using a 4.67 (±0.26) ppmv NO2standard (Praxair) diluted to∼2–8 ppbv in zero
air. The accuracy and stability of the reference is compared against a library of other NO2standards in our laboratory on a regular basis. Fluorescence quenching by water
vapor (Thornton et al., 2000) is estimated using the Diode Laser Hygrometer (DLH) measurements of H2O (Sachse et al., 1987; Diskin et al., 2002).
15
The TD-LIF instrument used here had two detection cells. A large flow is brought from the undisturbed free stream either by ram pressure from a partially plugged shroud at the inlet tip (ARCTAS, DC-3), or by a 120 L min−1 sample pump (SEAC4RS). The
core of that flow was subsampled by a short (∼0.10 m long) tube where air had a
resi-dence time of∼0.03 s and then split into multiple sample lines for detection of specific
20
categories of NOy (Fig. 2). For CH3O2NO2 detection, the sample is passed directly through a heated quartz tube (internal diameter∼4.3 mm, T ≈60◦C) for 0.06–0.08 s
followed by PFA tubing (i.d.∼3.2 mm) to the NO2 detection cell. The residence time
between the heater and the detector is∼0.4–0.5 s. The temperature (∼60◦C) for the
heated quartz was determined by calculating the temperature that would maximize the
25
amount of CH3O2NO2 dissociated while minimizing the amount of HO2NO2
dissoci-ated (Fig. 3). This also ensures that PAN and its analogs (e.g., PPN) did not dissociate in the CH3O2NO2channel. N2O5has similar thermodynamics to HO2NO2at this
AMTD
7, 9453–9479, 2014Measurements of CH3O2NO2 in the
upper troposphere
B. A. Nault et al.
Title Page
Abstract Introduction
Conclusions References
Tables Figures
◭ ◮
◭ ◮
Back Close
Full Screen / Esc
Printer-friendly Version
Interactive Discussion
Discussion
P
a
per
|
Discus
sion
P
a
per
|
Discussion
P
a
per
|
Discussion
P
a
per
|
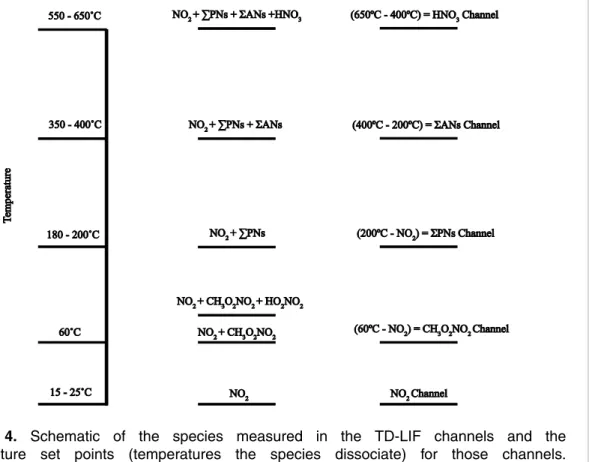
day is negligible due to the short lifetime of the NO3 radical, making it an unimpor-tant interference. Also, we chose the temperature set point based on a scan of air containing acyl peroxy nitrates and non-acyl peroxy nitrates. The mixing ratio of ambi-ent CH3O2NO2is determined by subtracting the measurements from the NO2channel from the CH3O2NO2channel (60◦C, Fig. 4). Similarly, the mixing ratio of ambient sum 5
of peroxy nitrates (ΣPNs = PAN + PPN +CH3O2NO2+HO2NO2+. . .) is determined
by subtracting the measurements from the NO2channel from the ΣPNs channel, and the mixing ratio of ambient sum of alkyl and multifunctional nitrates (ΣANs) is deter-mined by subtracting the measurements from theΣPNs channel from theΣANs chan-nel (Fig. 4).
10
2.2 Interference free NO2measurements
Measuring NO2 free of CH3O2NO2 interference is desirable for understanding upper
tropospheric chemistry and essential to correctly derive the CH3O2NO2 and ΣPNs
mixing ratios from the heated channels (Fig. 4). Measurements of NO2 at ambient temperatures lower than 240 K, where non-acyl peroxy nitrates are more abundant
15
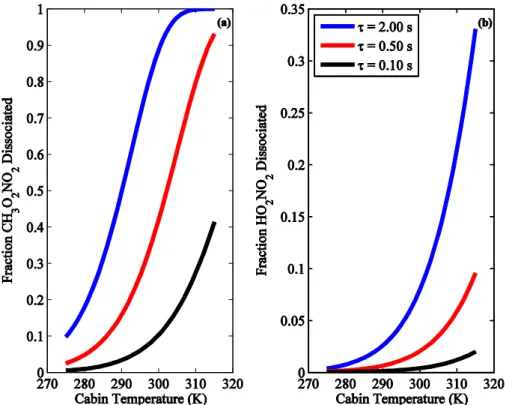
due to longer thermal lifetimes (Fig. 1), are not free of interferences if the sample res-idence time in the aircraft is long (Browne et al., 2011). Figure 5 shows the fraction of CH3O2NO2and HO2NO2thermally dissociating in the NO2inlet prior to measuring NO2 for different residence times and as a function of cabin temperature. At a cabin
temperature of 300 K, approximately 90−+510%, 40+−116 % and 10−+32% of CH3O2NO2and 20
approximately 8±2 %, 2 %, and less than 1 % of HO2NO2will thermally decompose at
residence times of 2 s, 0.5 s, and 0.1 s, respectively. The uncertainties are based on the 2σ range reported for the decomposition rates of CH3O2NO2and HO2NO2.
Eliminat-ing the influence of CH3O2NO2 and HO2NO2 on the observations thus NO2 requires residence times of less than 0.1 s.
AMTD
7, 9453–9479, 2014Measurements of CH3O2NO2 in the
upper troposphere
B. A. Nault et al.
Title Page
Abstract Introduction
Conclusions References
Tables Figures
◭ ◮
◭ ◮
Back Close
Full Screen / Esc
Printer-friendly Version
Interactive Discussion
Discussion
P
a
per
|
Discus
sion
P
a
per
|
Discussion
P
a
per
|
Discussion
P
a
per
|
2.3 Inlet configurations and effects on NO2and CH3O2NO2measurements
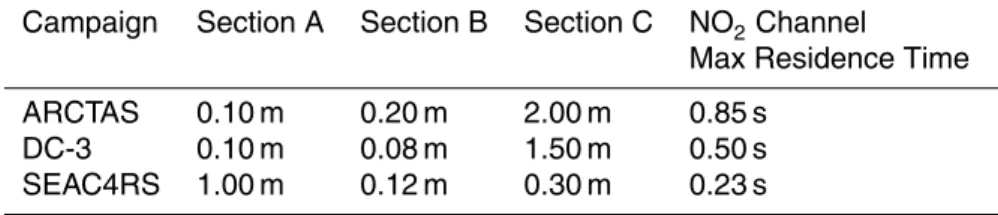
Figure 2 shows the schematic of the TD-LIF inlet. Table 1 has the lengths and resi-dence times of the different inlets used in three recent experiments: ARCTAS, DC-3, and SEAC4RS. The residence time is set by the measured length of tubing, the diam-eter of the tubing, and the flow speed of the sample pumps. Unless stated otherwise,
5
the tubing has an internal diameter of approximately 3.2 mm. Following the recom-mendations of Wooldridge et al. (2010) and Browne et al. (2011), we shortened the residence time for the NO2sample after the ARCTAS experiment for the DC-3
exper-iment to make interference free NO2 measurements. In ARCTAS, the NO2 channel went through 0.2 m of tubing heated to∼50◦C (Section B) and then through 2 m
un-10
heated tubing (Section C) to the LIF cell (Fig. 2). For DC-3, we reduced Section B from 0.2 to 0.08 m, reducing the amount of time the NO2 sample is heated to 50◦C. Also,
we reduced Section C from 2 to 1.5 m. This reduced the maximum residence time for NO2from 0.85 to 0.5 s. For typical cabin temperatures of 300 K, approximately 42 % of
CH3O2NO2still decomposes in the NO2channel at 0.5 s residence time. 15
After examining the results from the DC-3 configuration, we reduced the length and residence time to further minimize the thermal decomposition of CH3O2NO2in the
un-heated NO2 channel. For SEAC4RS, we used a bypass pump to bring large flow of
ambient air as near to the NO2 detection cell as possible, thereby reducing the NO2 sample residence time. We also moved the dissociation heaters from near the window
20
inlet to near the LIF cells, increasing the length of Section A from 0.1 to 1 m and re-ducing Section C from 1.5 to 0.3 m. Also, the Section A internal diameter went from
∼3.2 to 15.9 mm. Finally, Section B slightly increased from 0.08 to 0.12 m; however,
Section B was not heated for SEAC4RS. The combined reduction of the overall tub-ing length was small, from 1.68 to 1.42 m, but the added sample pump reduced the
25
maximum residence time from 0.5 s (DC-3) to 0.23 s (SEAC4RS). This reduced the fractional thermal dissociation of CH3O2NO2 in the NO2 channel from approximately
AMTD
7, 9453–9479, 2014Measurements of CH3O2NO2 in the
upper troposphere
B. A. Nault et al.
Title Page
Abstract Introduction
Conclusions References
Tables Figures
◭ ◮
◭ ◮
Back Close
Full Screen / Esc
Printer-friendly Version
Interactive Discussion
Discussion
P
a
per
|
Discus
sion
P
a
per
|
Discussion
P
a
per
|
Discussion
P
a
per
|
We obtain an NO2measurement by correcting for the partial thermal dissociation of CH3O2NO2 in the XNO2 channel (Eq. 1) and CH3O2NO2by subtracting NO2 and the
fractional thermally dissociated HO2NO2from the CH3O2NO2,CHANNEL(Eq. 2).
XNO2=NO2+f1·CH3O2NO2 (1)
CH3O2NO2,CHANNEL=NO2+CH3O2NO2+f2·HO2NO2 (2)
5
We use the cabin temperature we measured near the TD-LIF NO2 sample line along with the thermal rate constant (Table 2) to calculate the fraction of CH3O2NO2 (f1 in
Eq. 1) that dissociates in the NO2 sample line. We use the measured oven
tempera-ture (∼60◦C) along with the thermal rate constant (Table 2) to calculate the fraction
10
of HO2NO2(f2in Eq. 2) that has dissociated in the CH3O2NO2channel. With the two
Eqs. (1) and (2), we can solve for the NO2 and CH3O2NO2 mixing ratios observed if
there is an independent measurement or calculation of HO2NO2. During DC-3, the cor-rection for the thermal dissociation of CH3O2NO2in XNO2ranged from a 0 to 17 pptv
(0–40 %) of the NO2mixing ratios at temperatures less than 240 K. During SEAC4RS, 15
the correction ranged from 0 to 23 pptv (0–21 %).
2.4 Accuracy, uncertainty and limit of detection for CH3O2NO2
The accuracy of the CH3O2NO2 measurements depends on the accuracy of our
pri-mary measurement of NO2, the conversion efficiency in our inlet, and the interference of HO2NO2 dissociating with CH3O2NO2. The uncertainty of the NO2 calibration stan-20
dard is∼5 % (Sect. 2.1). Using the rate constant and 2σuncertainty recommendation
from JPL-2011 (Sander et al., 2011) at 60◦C, the thermal decomposition rate constant
of CH3O2NO2 is 36.0+ 19.0
−13.0s −1
, indicating between 85–99 % of CH3O2NO2 is
decom-posed at this temperature and a residence time of 0.08 s. Including the uncertainty estimated for the oven temperature (±5◦C), the amount of CH3O2NO2decomposed is 25
70–100 %.
The similarity in the bond strength between HO2NO2 and CH3O2NO2 (∼100 and
AMTD
7, 9453–9479, 2014Measurements of CH3O2NO2 in the
upper troposphere
B. A. Nault et al.
Title Page
Abstract Introduction
Conclusions References
Tables Figures
◭ ◮
◭ ◮
Back Close
Full Screen / Esc
Printer-friendly Version
Interactive Discussion
Discussion
P
a
per
|
Discus
sion
P
a
per
|
Discussion
P
a
per
|
Discussion
P
a
per
|
separates the two species (Fig. 3). For the oven temperature selected to decom-pose CH3O2NO2 (60◦C) and the residence time in the oven (0.08 s), we calculate
approximately 11+−106 % of HO2NO2dissociates in the CH3O2NO2channel. Combining
the uncertainties from thermal decomposition of CH3O2NO2 and the fractional ther-mal decomposition of HO2NO2 in the CH3O2NO2 oven, we estimate the accuracy of 5
the CH3O2NO2 measurements to be ±40 %. We note that the sum of the NO2 and
CH3O2NO2measurement (CH3O2NO2,CHANNEL) is more accurate (∼5 %) than the
sep-arate quantities.
The precision of the CH3O2NO2 measurements depends on the shot noise of the
photon counting rate, the precision of the NO2measurement, the concentration of NO2,
10
and the concentration of CH3O2NO2. Using the median NO2 measured between 10
and 11 km (∼200 pptv of NO2), and using the lower end of the sensitivity observed
during DC-3 (0.100 cts pptv−1), the detection limit for CH3O2NO2 is 15 pptv at 60 s− 1
forS/N=2. The median limit of detection (S/N=2 and 60 s averaged data) for the DC-3 campaign is shown vs. altitude in Fig. 7b (red line).
15
3 Ambient measurements of CH3O2NO2
CH3O2NO2 measurements were obtained during the DC-3 (2012) and SEAC4RS (2013) campaigns. All data used is located in the NASA public archives for these two missions (http://www-air.larc.nasa.gov/cgi-bin/ArcView/dc3-seac4rs and https:// www-air.larc.nasa.gov/cgi-bin/ArcView/seac4rs).
20
A time series of CH3O2NO2 during the flight of 30 May 2012 is shown in Fig. 6.
HO2NO2 measured (grey line) by chemical ionization-mass spectrometry (Kim et al.,
2007) and calculated at instantaneous photostationary steady state (Eq. 3, red line) are also shown in the figure. The reactions included in the photostationary steady state calculations for HO2NO2 are shown in Table 2, and the calculations were constrained 25
AMTD
7, 9453–9479, 2014Measurements of CH3O2NO2 in the
upper troposphere
B. A. Nault et al.
Title Page
Abstract Introduction
Conclusions References
Tables Figures
◭ ◮
◭ ◮
Back Close
Full Screen / Esc
Printer-friendly Version
Interactive Discussion
Discussion
P
a
per
|
Discus
sion
P
a
per
|
Discussion
P
a
per
|
Discussion
P
a
per
|
less than 85◦and HO
2NO2lifetime less than 12 h.
[HO2NO2]=
k2[HO2] [NO2]
j1+j2+k−2+k3[OH]
(3)
Kim et al. (2007) observed that instantaneous photostationary steady state calculations were approximately a factor of 2 higher than observations. In Kim et al. (2007), the
au-5
thors concluded the factor of∼2 is due to HO2NO2and HOxmeasurements not being
consistent with our current understanding of photochemistry in the upper troposphere stemming from either unknown uncertainties in the measurements, the formation is too fast, or the loss is too slow. We observe a similar result; therefore, we divide the calculations by 2 to reflect that result.
10
As seen in Fig. 6, between the time 7.5 and 8×10⁴s, CH3O2NO2is fluctuating near
the limit of detection (0–50 pptv), whereas HO2NO2 spikes in both the measurement
and steady state calculations. During this time, the CH3O2NO2 lifetime is less than
10 min, indicating the CH3O2NO2 mixing ratios should be low. We utilize these ob-servations to calculate an upper limit for the thermal dissociation of HO2NO2 in the 15
CH3O2NO2 channel. The median measured and calculated HO2NO2 are 94+ 11
−35 and
78+−204 pptv (plus 75th quartile and minus 25th quartile), respectively. In the CH3O2NO2
channel, we observed 24+−106 pptv (median and inter-quartile). Assuming zero for the CH3O2NO2 mixing ratio, this gives an upper limit to the HO2NO2 present in the
CH3O2NO2 channel of∼25 % (observed) and∼30 % (calculated) HO2NO2 thermally 20
dissociated. Calculations (Sect. 2.4) suggest the most likely amount of HO2NO2 ther-mally dissociated is ∼11 % with an upper limit based on propagating uncertainties
in rate constants of 25 to 30 %. The observed values are consistent with this upper limit. We conclude that some (∼6 pptv calculated assuming photostationary steady
state similar to Browne et al., 2011) CH3O2NO2 should be present. If we assume this 25
CH3O2NO2is correct, the HO2NO2fraction dissociated is 19–23 %.
AMTD
7, 9453–9479, 2014Measurements of CH3O2NO2 in the
upper troposphere
B. A. Nault et al.
Title Page
Abstract Introduction
Conclusions References
Tables Figures
◭ ◮
◭ ◮
Back Close
Full Screen / Esc
Printer-friendly Version
Interactive Discussion
Discussion
P
a
per
|
Discus
sion
P
a
per
|
Discussion
P
a
per
|
Discussion
P
a
per
|
and 8.5–9×10⁴s correspond to measurements taken at lower altitudes and thus higher
temperatures. These measurements were taken in air where CH3O2NO2lifetimes were
less than 1 h. Higher CH3O2NO2mixing ratios occur at higher altitudes (colder temper-atures), corresponding to CH3O2NO2lifetimes greater than 10 h.
CH3O2NO2’s dependence on temperature and altitude is also seen in Fig. 7b which 5
shows the median CH3O2NO2 profile during DC-3 (black) and SEAC4RS (dark grey) along with the median CH3O2NO2 profile from ARCTAS-A (blue, as calculated by
Browne et al., 2011). At altitudes above 7 km, higher mixing ratios of CH3O2NO2
were observed during both DC-3 and SEAC4RS compared to ARCTAS-A due to the influence of deep convection, lightning NOx, and biomass burning. Also, DC-3 10
and SEAC4RS occurred later in the year (May–June 2012 for DC-3 and August– September 2013 for SEAC4RS) than ARCTAS-A (April 2008); thus, photochemistry is more active, producing more CH3O2NO2. This is consistent with Browne et al. (2011),
who calculated that CH3O2NO2 mixing ratios are higher in the summer than spring.
Finally, CH3O2NO2 during SEAC4RS at lower altitudes is higher due to the impact of
15
agricultural and biomass burning. Higher NO2mixing ratios from biomass burning shift
the equilibrium towards CH3O2NO2, similar to the higher NO2 concentrations
shift-ing the equilibrium towards HO2NO2 production near an urban area (Spencer et al., 2009). Higher CH3O2NO2mixing ratios due to biomass burning are also consistent to
the GEOS-Chem results from Browne et al. (2011). Even though temperatures in the
20
lower stratosphere are low enough for the CH3O2NO2lifetime to be greater than 10 h, the lower stratosphere has lower mixing ratios of the precursors (e.g., acetaldehyde) that produce methyl peroxy radicals, resulting in low mixing ratios of CH3O2NO2(Fig. 6
after 9×10⁴s and Fig. 7b above 11.5 km during DC-3).
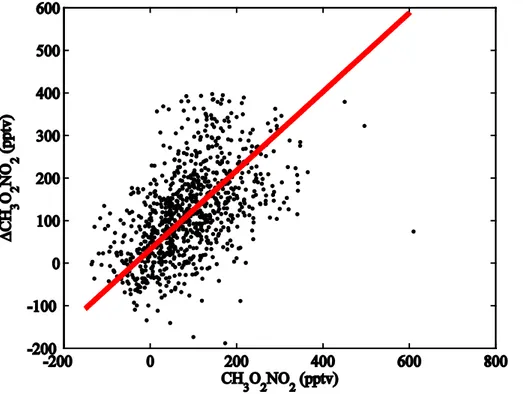
To evaluate the CH3O2NO2 measurement, we compare inferred CH3O2NO2 25
(∆CH3O2NO2≡ΣPNs −(HO2NO2+ PAN + PPN)) to measured CH3O2NO2 during
AMTD
7, 9453–9479, 2014Measurements of CH3O2NO2 in the
upper troposphere
B. A. Nault et al.
Title Page
Abstract Introduction
Conclusions References
Tables Figures
◭ ◮
◭ ◮
Back Close
Full Screen / Esc
Printer-friendly Version
Interactive Discussion
Discussion
P
a
per
|
Discus
sion
P
a
per
|
Discussion
P
a
per
|
Discussion
P
a
per
|
Using a weighted bivariate least-squares (Cantrell, 2008), we calculated a slope of 0.93 (±0.07) after removing the ∆CH3O2NO2 population greater than 400 pptv
(∆CH3O2NO2 observations that are ±3 standard deviation of the median value).
Us-ing photostationary state HO2NO2, we calculate a slope of 1.11 (±0.08) (not shown).
While not completely independent approaches, the two methods of CH3O2NO2 are 5
sufficiently independent to suggest the direct CH3O2NO2measurement is accurate to
at least the±40 % estimate above.
4 Discussion
In prior analysis of tropospheric air cooler than 240 K, Murphy et al. (2004) calculated the sum of HO2NO2 and CH3O2NO2 as the difference between ΣPNs measured by
10
TD-LIF and PAN and PPN measured using gas chromatography with electron capture detection (similar to ∆CH3O2NO2 above). Murphy et al. reported these two species
were a large fraction of the NOy budget at temperatures cooler than 240 K (17–22 %), impacting NOxand radical chemistry. Between 220 and 230 K during DC-3, CH3O2NO2
composed 7 % and HO2NO2composed 5±2 % of the median NOybudget, where NOy 15
is defined as the sum of NOx,ΣPNs, ΣANs, and HNO3. This is significant since many transport models neglect CH3O2NO2chemistry. During DC-3, these species comprise
a larger portion of the median NOybudget than HNO3(4 %), which is a terminal sink for
NOx. The percent composition for the non-acyl peroxy nitrates during DC-3 were lower than Murphy et al.’s (2004) observations because the sampling during DC-3 was biased
20
toward fresh convective outflow impacted by lightning NOx, meaning NOx composed
39 % of the NOy budget vs. the 5 % for the air observed by Murphy et al. (2004). For
background air (NOx/NOy<0.2) observed during DC-3, CH3O2NO2 still composed
a larger portion of the median NOybudget (12 %) than HNO3(6 %) and HO2NO2(5 %).
The contribution of the non-acyl peroxy nitrates to the background NOy budget during
25
AMTD
7, 9453–9479, 2014Measurements of CH3O2NO2 in the
upper troposphere
B. A. Nault et al.
Title Page
Abstract Introduction
Conclusions References
Tables Figures
◭ ◮
◭ ◮
Back Close
Full Screen / Esc
Printer-friendly Version
Interactive Discussion
Discussion
P
a
per
|
Discus
sion
P
a
per
|
Discussion
P
a
per
|
Discussion
P
a
per
|
The lower NOxmixing ratios characteristic of the air observed by Murphy et al. (2004) were also characteristic of the air observed by Browne et al. (2011) during ARCTAS-A, as both were springtime measurements in the Arctic. The comparison of ARCTAS-A, DC-3, and SEAC4RS is shown in Fig. 7. The lower NO2mixing ratios observed during ARCTAS-A meant the air masses were more dominated by CH3O2NO2 than by NO2 5
(CH3O2NO2/(NO2+CH3O2NO2) ratios closer to 1.0, Fig. 7c). In DC-3, the influence
of lightning NOxemissions made the median air masses for the entire campaign more dominated by NO2(ratios less than 0.5). The median CH3O2NO2/(NO2+CH3O2NO2)
ratios are slightly smaller than the ratios calculated in the GEOS-Chem model from Browne et al. (2011) for air influenced by deep convection and lightning. In
back-10
ground air sampled by the NASA DC-8 during DC-3, the median CH3O2NO2/(NO2+ CH3O2NO2) ratio was in the range 0.3–0.7 (Fig. 7c, green). We observed similar
me-dian ratios during SEAC4RS (Fig. 7c, dark grey). These values are closer to the values calculated during ARCTAS (Fig. 7c, blue; Browne et al., 2011). This indicates that as the air ages, the ratio shifts towards air more dominated by CH3O2NO2, impacting 15
the ozone chemistry of the upper troposphere, as previously demonstrated by Browne et al. (2011).
5 Conclusions
We report the first measurements of atmospheric CH3O2NO2, and we also report rec-ommendations for instrument design to sample NO2free of interferences from thermal 20
decomposition of non-acyl peroxy nitrates. We conclude that for an instrument temper-ature of 300 K, NO2 sampling times of less than 0.1 s are required to have less than
10 % thermal decomposition of CH3O2NO2 and less than 1 % thermal decomposition of HO2NO2in the NO2detector. The interference of CH3O2NO2from thermally
decom-posing in NO2sample lines can be corrected with measurements of CH3O2NO2. Dur-25
AMTD
7, 9453–9479, 2014Measurements of CH3O2NO2 in the
upper troposphere
B. A. Nault et al.
Title Page
Abstract Introduction
Conclusions References
Tables Figures
◭ ◮
◭ ◮
Back Close
Full Screen / Esc
Printer-friendly Version
Interactive Discussion
Discussion
P
a
per
|
Discus
sion
P
a
per
|
Discussion
P
a
per
|
Discussion
P
a
per
|
is a temporary reservoir of NOx, CH3O2NO2 being more abundant in the upper tro-posphere further supports the importance of including CH3O2NO2 in chemical
mod-els. Finally, similar to the GEOS-Chem calculations from Browne et al. (2011), we see increased CH3O2NO2mixing ratios from spring to summer season and increasing CH3O2NO2mixing ratios as temperatures decrease and altitudes increase.
5
Acknowledgements. This research was funded by NASA grant NNX08AR13G and based upon work supported by the National Science Foundation Graduate Research Fellowship under Grant No. DGE 1106400 to BAN. SEP acknowledges support from the NASA Postdoctoral Pro-gram. We thank William H. Brune for use of the OH and HO2measurements, L. Gregory Huey for the use of Georgia Institute of Technology CIMS data, Paul O. Wennberg for the use of
10
HNO3 data, and Thomas B. Ryerson for the use of NO data. We also thank the ground and flight crews of the DC-8 for their hard work and support during DC-3 and SEAC4RS and the DC-3 and SEAC4RS science team for their hard work.
References
Browne, E. C., Perring, A. E., Wooldridge, P. J., Apel, E., Hall, S. R., Huey, L. G., Mao, J.,
15
Spencer, K. M., Clair, J. M. St., Weinheimer, A. J., Wisthaler, A., and Cohen, R. C.: Global and regional effects of the photochemistry of CH3O2NO2: evidence from ARCTAS, Atmos. Chem. Phys., 11, 4209–4219, doi:10.5194/acp-11-4209-2011, 2011.
Cantrell, C. A.: Technical Note: Review of methods for linear least-squares fitting of data and application to atmospheric chemistry problems, Atmos. Chem. Phys., 8, 5477–5487,
20
doi:10.5194/acp-8-5477-2008, 2008.
Cleary, P. A., Wooldridge, P. J., and Cohen, R. C.: Laser-induced fluorescence detection of atmospheric NO2 with a commercial diode laser and a supersonic expansion, Appl. Optics, 41, 6950–6956, 2002.
Day, D. A., Wooldridge, P. J., Dillon, M. B., Thornton, J. A., and Cohen, R. C.: A thermal
dis-25
AMTD
7, 9453–9479, 2014Measurements of CH3O2NO2 in the
upper troposphere
B. A. Nault et al.
Title Page
Abstract Introduction
Conclusions References
Tables Figures
◭ ◮
◭ ◮
Back Close
Full Screen / Esc
Printer-friendly Version
Interactive Discussion
Discussion
P
a
per
|
Discus
sion
P
a
per
|
Discussion
P
a
per
|
Discussion
P
a
per
|
Diskin, G. S., Podolske, J. R., Sachse, G. W., and Slate, T. A.: Open-path airborne tunable diode laser hygrometer, in: Diode Lasers and Applications in Atmospheric Sensing, edited by: Fried, A., SPIE Proceedings, 4817, 196–204, 2002.
Elfers, G., Zabell, F., and Becker, K. H.: Determination of the rate constant ratio for the reactions of the ethylperoxy radical with NO and NO2, Chem. Phys. Lett., 168, 14–19, 1990.
5
Faloona, I. C., Tan, D., Lesher, R. L., Hazen, N. L., Frame, C. L., Simpas, J. B., Harder, H., Mar-tinez, M., Di Carlo, P., Ren, X., and Brune, W. H.: A laser-induced fluorescence instrument for detecting tropospheric OH and HO2: characteristics and calibration, J. Atmos. Chem., 47, 139–167, 2004.
Jiménez, E., Gierczak, T., Stark, H., Burkholder, J. B., and Ravishankara, A. R.: Reaction of
10
OH with HO2NO2 (peroxynitric acid): rate coefficients between 218 and 335 K and product yields at 298 K, J. Phys. Chem. A., 108, 1139–1149, doi:10.1021/jp0363489, 2004.
Kim, S., Huey, L. G., Stickel, R. E., Tanner, D. J., Crawford, J. H., Olson, J. R., Chen, G., Brune, W. H., Ren, X., Lesher, R., Wooldridge, P. J., Bertram, T. H., Perring, A., Cohen, R. C., Lefer, B. L., Shetter, R. E., Avery, M., Diskin, G., and Sokolik, I.: Measurement of HO2NO2
15
in the free troposphere during the Intercontinental Chemical Transport Experiment–North America 2004, J. Geophys. Res., 112, D12S01, doi:10.1029/2006Jd007676, 2007.
Murphy, J. G., Thornton, J. A., Wooldridge, P. J., Day, D. A., Rosen, R. S., Cantrell, C., Shet-ter, R. E., Lefer, B., and Cohen, R. C.: Measurements of the sum of HO2NO2and CH3O2NO2 in the remote troposphere, Atmos. Chem. Phys., 4, 377–384, doi:10.5194/acp-4-377-2004,
20
2004.
Sachse, G. W., Hill, G. F., Wade, L. O., and Perry, M. G.: Fast response, high precision carbon monoxide sensor using a tunable diode laser absorption technique, J. Geophys. Res., 92, 2071–2081, 1987.
Sander, S. P., Abbatt, J. Barker, J. R., Burkholder, J. B., Friedl, R. R., Golden, D. M., Huie, R. E.,
25
Kolb, C. E., Kurylo, M. J., Moortgat, G. K., Orkin, V. L., and Wine, P. H.: Chemical Kinetics and Photochemical Data for Use in Atmospheric Studies, Evaluation Number 17, JPL Publication 10-6, Jet Propulsion Laboratory, Pasadena, 2011.
Sehested, J., Christensen, L. K., Nielsen, O. J., Bilde, M. Wallington, T. J., Schneider, W. F., Orlando, J. J., and Tyndall, G. S.: Atmospheric chemistry of acetone: kinetic study
30
of the CH3C(O)CH2O2+NO/NO2 reactions and decomposition of CH3C(O)CH2O2NO2,
AMTD
7, 9453–9479, 2014Measurements of CH3O2NO2 in the
upper troposphere
B. A. Nault et al.
Title Page
Abstract Introduction
Conclusions References
Tables Figures
◭ ◮
◭ ◮
Back Close
Full Screen / Esc
Printer-friendly Version
Interactive Discussion
Discussion
P
a
per
|
Discus
sion
P
a
per
|
Discussion
P
a
per
|
Discussion
P
a
per
|
Shetter, R. E. and Müller, M.: Photolysis frequency measurements using actinic flux spectrora-diometry during the PEM-Tropics Mission: instrument description and some results, J. Geo-phys. Res., 104, 5647–5661, 1999.
Slusher, D. L., Huey, L. G., Tanner, D. J., Chen, G., Davis, D. D., Buhr, M., Nowak, J. B., Eisele, F. L., Kosciuch, E., Mauldin, R. L., Lefer, B. L., Shetter, R. E., and Dibb, J. E.:
Mea-5
surements of pernitric acid at the South Pole during ISCAT 2000, Geophys. Res. Lett., 29, 2001, doi:10.1029/2002GL015703, 2002.
Slusher, D., Huey, L. G., Tanner, D. J., Flocke, F. M., and Roberts, J. M.: A thermal dissocia-tion chemical ionizadissocia-tion mass spectrometry (TD-CIMS) technique for the simultaneous mea-surements of peroxacyl nitrates and dinitrogen pentoxide, J. Geophys. Res., 109, D19315,
10
doi:10.1029/2004JD004670, 2004.
Spencer, K. M., McCabe, D. C., Crounse, J. D., Olson, J. R., Crawford, J. H., Weinheimer, A. J., Knapp, D. J., Montzka, D. D., Cantrell, C. A., Hornbrook, R. S., Mauldin III, R. L., and Wennberg, P. O.: Inferring ozone production in an urban atmosphere using measurements of peroxynitric acid, Atmos. Chem. Phys., 9, 3697–3707, doi:10.5194/acp-9-3697-2009, 2009.
15
Thornton, J. A., Wooldridge, P. J., and Cohen, R. C.: Atmospheric NO2: in situ laser-induced fluorescence detection at parts per trillion mixing ratios, Anal. Chem., 72, 528–539, 2000. Wennberg, P. O., Salawitch, R. J., Donaldson, D. J., Hanisco, T. F., Lanzendorf, E. J.,
Perkins, K. K., Lloyd, S. A., Vaida, V., Gao, R. S., Hintsa, E. J., Cohen, R. C., Swartz, W. H., Kusterer, T. L., and Anderson, D. E.: Twilight observations suggest unknown sources of HOx,
20
Geophys. Res. Lett., 26, 1373–1376, 1999.
Wooldridge, P. J., Perring, A. E., Bertram, T. H., Flocke, F. M., Roberts, J. M., Singh, H. B., Huey, L. G., Thornton, J. A., Wolfe, G. M., Murphy, J. G., Fry, J. L., Rollins, A. W., LaFranchi, B. W., and Cohen, R. C.: Total Peroxy Nitrates (ΣPNs) in the atmosphere: the Thermal Dissociation-Laser Induced Fluorescence (TD-LIF) technique and comparisons to
25
speciated PAN measurements, Atmos. Meas. Tech., 3, 593–607, doi:10.5194/amt-3-593-2010, 2010.
AMTD
7, 9453–9479, 2014Measurements of CH3O2NO2 in the
upper troposphere
B. A. Nault et al.
Title Page
Abstract Introduction
Conclusions References
Tables Figures
◭ ◮
◭ ◮
Back Close
Full Screen / Esc
Printer-friendly Version
Interactive Discussion
Discussion
P
a
per
|
Discus
sion
P
a
per
|
Discussion
P
a
per
|
Discussion
P
a
per
|
Table 1.Lengths for tubing in the corresponding sections for Fig. 2.
Campaign Section A Section B Section C NO2Channel Max Residence Time
ARCTAS 0.10 m 0.20 m 2.00 m 0.85 s
DC-3 0.10 m 0.08 m 1.50 m 0.50 s
AMTD
7, 9453–9479, 2014Measurements of CH3O2NO2 in the
upper troposphere
B. A. Nault et al.
Title Page
Abstract Introduction
Conclusions References
Tables Figures
◭ ◮
◭ ◮
Back Close
Full Screen / Esc
Printer-friendly Version
Interactive Discussion
Discussion
P
a
per
|
Discus
sion
P
a
per
|
Discussion
P
a
per
|
Discussion
P
a
per
|
Table 2.Reactions and rates used in calculating dissociations in instrument and photostation-ary steady state calculations for HO2NO2.
Reaction Rate Constant
CH3O2NO2+M↔CH3O2+NO2+M Low Pressure Limit=1.0×10− 30
×(T/300)−4.8
High Pressure Limit=7.2×10⁻¹²
×(T/300)−2.1
Keq=9.5×10⁻²⁹
×exp(11234/T)a
HO2NO2+M↔HO2+NO2+M Low Pressure Limit=2.0×10⁻³¹×(T/300)−3.4
High Pressure Limit=2.9×10⁻¹²
×(T/300)−1.1
Keq=2.1×10⁻²⁷
×exp(10900/T)a
HO2NO2+OH→NO2+H2O+O2 8.8×10⁻¹⁹
×T2×exp(1130/T)b
HO2NO2+hν→HO2+NO2 Measured+1×10⁻⁵ c
HO2NO2+hν→OH+NO3 Measured
aJPL 2011 (Sander et al., 2011). bJiménez et al. (2004).
AMTD
7, 9453–9479, 2014Measurements of CH3O2NO2 in the
upper troposphere
B. A. Nault et al.
Title Page
Abstract Introduction
Conclusions References
Tables Figures
◭ ◮
◭ ◮
Back Close
Full Screen / Esc
Printer-friendly Version
Interactive Discussion
Discussion
P
a
per
|
Discus
sion
P
a
per
|
Discussion
P
a
per
|
Discussion
P
a
per
|
Table 3.Measurements used in this analysis and for photostationary steady state calculations for HO2NO2.
Species Method Reference
NO2, CH3O2NO2,ΣPNs Thermal dissociation-laser induced fluorescence Thornton et al. (2000)
Day et al. (2002)
HO2NO2, PAN, PPN Chemical ionization mass spectrometry Slusher et al. (2004)
Kim et al. (2007)
OH, HO2 Laser induced fluorescence Faloona et al. (2004)
AMTD
7, 9453–9479, 2014Measurements of CH3O2NO2 in the
upper troposphere
B. A. Nault et al.
Title Page
Abstract Introduction
Conclusions References
Tables Figures
◭ ◮
◭ ◮
Back Close
Full Screen / Esc
Printer-friendly Version
Interactive Discussion
Discussion
P
a
per
|
Discus
sion
P
a
per
|
Discussion
P
a
per
|
Discussion
P
a
per
|
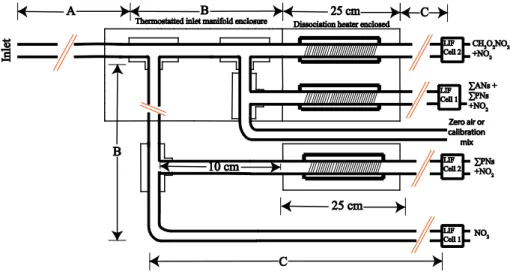
1. The total species measured is shown to the right of the LIF Cells, where ΣPNs ≡ PAN + PPN + … and ΣANs ≡ alkyl and multifunctional nitrates.
Figure 2. Schematic of the TD-LIF inlet. Arrows and letters refer to lengths referenced in Table 1. The total species measured is shown to the right of the LIF Cells, where
AMTD
7, 9453–9479, 2014Measurements of CH3O2NO2 in the
upper troposphere
B. A. Nault et al.
Title Page
Abstract Introduction
Conclusions References
Tables Figures
◭ ◮
◭ ◮
Back Close
Full Screen / Esc
Printer-friendly Version
Interactive Discussion
Discussion
P
a
per
|
Discus
sion
P
a
per
|
Discussion
P
a
per
|
Discussion
P
a
per
|
Figure 3. The calculated percent decomposition of non-acyl peroxy nitrates at various CH3O2NO2 oven temperatures at a pressure of 230 hPa and a residence time of 0.08 s. The blue line is the percent decomposition of CH3O2NO2, and the green line is the percent de-composition of HO2NO2. The black line represents the target temperature (∼60◦C) for optimal
AMTD
7, 9453–9479, 2014Measurements of CH3O2NO2 in the
upper troposphere
B. A. Nault et al.
Title Page
Abstract Introduction
Conclusions References
Tables Figures
◭ ◮
◭ ◮
Back Close
Full Screen / Esc
Printer-friendly Version
Interactive Discussion
Discussion
P
a
per
|
Discus
sion
P
a
per
|
Discussion
P
a
per
|
Discussion
P
a
per
|
ΣPNs ≡ PAN + PPN + + … and ΣANs ≡ alkyl and multifunctional nitrates.
Figure 4. Schematic of the species measured in the TD-LIF channels and the temperature set points (temperatures the species dissociate) for those channels.
AMTD
7, 9453–9479, 2014Measurements of CH3O2NO2 in the
upper troposphere
B. A. Nault et al.
Title Page
Abstract Introduction
Conclusions References
Tables Figures
◭ ◮
◭ ◮
Back Close
Full Screen / Esc
Printer-friendly Version
Interactive Discussion
Discussion
P
a
per
|
Discus
sion
P
a
per
|
Discussion
P
a
per
|
Discussion
P
a
per
|
(ΔCH