OSD
10, 1329–1342, 2013Decadal variability of heat content in South
China Sea
W. Song et al.
Title Page
Abstract Introduction
Conclusions References
Tables Figures
◭ ◮
◭ ◮
Back Close
Full Screen / Esc
Printer-friendly Version Interactive Discussion
Discussion
P
a
per
|
Dis
cussion
P
a
per
|
Discussion
P
a
per
|
Discussio
n
P
a
per
|
Ocean Sci. Discuss., 10, 1329–1342, 2013 www.ocean-sci-discuss.net/10/1329/2013/ doi:10.5194/osd-10-1329-2013
© Author(s) 2013. CC Attribution 3.0 License.
Geoscientiic Geoscientiic
Geoscientiic Geoscientiic
Open Access
Ocean Science
Discussions
This discussion paper is/has been under review for the journal Ocean Science (OS). Please refer to the corresponding final paper in OS if available.
Decadal variability of heat content in
South China Sea inferred from
observation data and an ocean data
assimilation product
W. Song1,2, J. Lan1, Q. Liu2, and D. Wang2
1
College of Physical and Environmental Oceanography, Ocean University of China, Qingdao, China
2
State Key laboratory of Tropical Oceanography, South China Sea Institute of Oceanology, Chinese Academy of Sciences, Guangzhou, China
Received: 2 May 2013 – Accepted: 4 June 2013 – Published: 8 August 2013
Correspondence to: D. Wang ([email protected])
OSD
10, 1329–1342, 2013Decadal variability of heat content in South
China Sea
W. Song et al.
Title Page
Abstract Introduction
Conclusions References
Tables Figures
◭ ◮
◭ ◮
Back Close
Full Screen / Esc
Printer-friendly Version Interactive Discussion
Discussion
P
a
per
|
Dis
cussion
P
a
per
|
Discussion
P
a
per
|
Discussio
n
P
a
per
|
Abstract
Using an observation dataset of temperature and the Simple Ocean Data Assimila-tion (SODA), the decadal variability of upper ocean heat content (0–400 m; hereafter, OHC) in the South China Sea (SCS) was investigated for the period from 1958 to 2007. Decadal variability was identified as the dominant mode of upper OHC besides
5
the seasonal cycle. According to deceasing or increasing OHC, four periods were cho-sen to discuss detailed processes behind OHC variability in the SCS; the four periods are 1958–1968, 1969–1981, 1982–1992, and 1993–2003. Results show that advection was the major factor for decreasing (increasing) OHC during 1958–1968 (1968–1981). During 1982–1992 and 1993–2003, the net surface heat flux was the main contributor
10
to the variability of OHC besides the advection. The OHC, advection and net surface heat flux had significant rising tendencies during 1992–2003. The spatial characteris-tics of OHC variability and heat budget in the Luzon Strait, west of Luzon Island, and Xisha warm eddy region were also discussed in this paper.
1 Introduction
15
The ocean has the greatest heat capacity in the climate system. Significant changes in the global ocean heat content were revealed for the past 50 years (Levitus et al., 2000). To understand ocean’s roles in the climate system, the global ocean’s ability to store and transport heat has been extensively studied by a number of researchers. Most of the recent studies focused on upper ocean warming (Levitus et al., 2000, 2005,
20
2009; Gouretski and Koltermann, 2007; Domingues et al., 2008) in association with the ocean’s significant contribution to global warming and climate change.
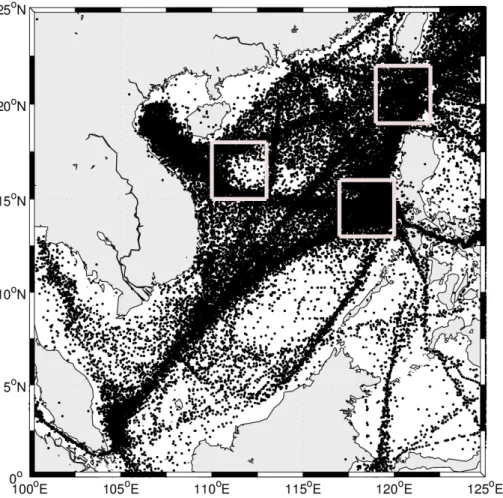
The South China Sea (SCS) is the largest marginal sea in Southeast Asian waters (Fig. 1). It is connected with the East China Sea through the Taiwan Strait, and with the Pacific Ocean through the Luzon Strait, and with the Sulu Sea via the Mindoro Strait.
25
OSD
10, 1329–1342, 2013Decadal variability of heat content in South
China Sea
W. Song et al.
Title Page
Abstract Introduction
Conclusions References
Tables Figures
◭ ◮
◭ ◮
Back Close
Full Screen / Esc
Printer-friendly Version Interactive Discussion
Discussion
P
a
per
|
Dis
cussion
P
a
per
|
Discussion
P
a
per
|
Discussio
n
P
a
per
|
and the Malacca Strait. In this paper, we choose a cross section covering the two straits and call it Sunda shelf (the location is given in Sect. 3). The interannual variability of latent and sensible heat fluxes in the SCS have been examined in the SCS (Zong et al., 2006). He et al. (1997) discussed the interannual and interdecadal variations in the upper ocean heat content (OHC) of the SCS, and pointed out that the vertically
5
averaged temperature trend changed from negative to positive in the recent decades. OHC contributes interdecadal variability to ENSO events, the Asian winter monsoon and the tropical atmospheric circulation anomalies. The OHC in the northern SCS has a propagation character, and that in southern SCS has a non-propagation feature (Yan et al., 2010). Studying interdecadal variability of the OHC itself is not enough, because
10
ocean circulations play an important role as well. A few studies (Fang et al., 2003; Qu et al., 2004; Willis et al., 2004; Liu et al., 2012) pointed out that the Luzon Strait allows the ENSO signal into the SCS, and therefore the role of advection should not be neglected. Horizontal advection is especially important to the OHC during the mature phase of ENSO events (Liu et al., 2012).
15
2 Data and methods
The data used in the present study includes the expendable bathythermograph (XBT) data from the World Ocean Database 09 (WOD09) and the Simple Ocean Data Assim-ilation (SODA), covering the period from 1958 to 2007. The ocean model used in mak-ing the SODA is based on Parallel Ocean Program (POP; Smith et al., 1992) physics
20
with an average resolution of 0.25◦
×0.4◦ and 40 levels. The observations include vir-tually all available hydrographic profile data, ocean station data, moored temperature and salinity time series, surface temperature and salinity observations of various types, and night-time infrared satellite sea-surface temperature (SST) data. The SODA output is in monthly-averaged form, mapped onto uniform 0.5◦
×0.5◦grids. Before the
analy-25
OSD
10, 1329–1342, 2013Decadal variability of heat content in South
China Sea
W. Song et al.
Title Page
Abstract Introduction
Conclusions References
Tables Figures
◭ ◮
◭ ◮
Back Close
Full Screen / Esc
Printer-friendly Version Interactive Discussion
Discussion
P
a
per
|
Dis
cussion
P
a
per
|
Discussion
P
a
per
|
Discussio
n
P
a
per
|
monthly, seasonal, and annual standard deviation checks. Detailed procedures are as follows. The data is flagged if it is more than n standard deviation (STD) from the cli-matological monthly mean at any one depth. For depths below 50 m,n=3 is assigned, while for depth above 50 m, n=4 is assigned to accommodate higher variability of upper ocean state (Locarnini et al., 2006). We then removed those profiles that did
5
not extend to 50 m; thus eliminating profiles over the shallow continental shelf, and those profiles with obviously erroneous records (e.g., temperature<10◦C) or
excep-tionally large vertical increment (>20 m) between two samples in the top 100 m. The final dataset contains a total of 23,356 temperature profiles in the SCS (Fig. 1), with irregular spatial and temporal distributions
10
A heat budget calculation was carried out: the heat content change is equal to the summation of surface heat fluxes, advection flux, and diffusion as in Na et al. (2012). The heat content used in calculation is the integration of top 400 m. The surface heat fluxes are from the NCEP/NCAR Reanalysis 1 dataset, which provides four kinds of air-sea fluxes from the study period. To discuss the monthly anomaly, the climatologically
15
seasonal cycle is removed.
3 Results
3.1 Decadal variability
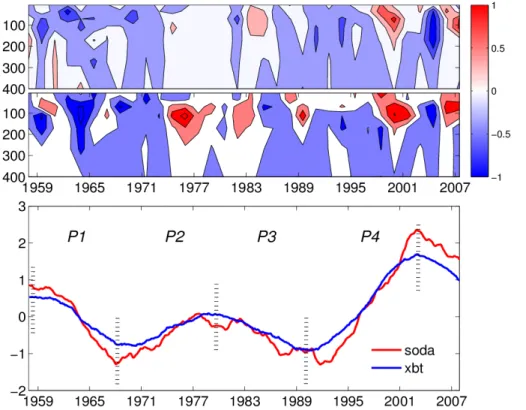
Figure 2 shows the decadal variability of vertical temperature profiles and OHC in the SCS (90–121◦E, 0–25◦N), which is enclosed by four channels with adjoining seas, the 20
Luzon Strait, the Taiwan Strait, Sunda shelf, and the Mindoro Strait. The results show that there are two dominant peaks and troughs from 1958 to 2007. The vertical temper-ature evolution averaged in the SCS inferred from the SODA dataset shows obvious decadal variability (Fig. 2, middle), which is more evident than that inferred from the XBT dataset. The strongest temperature anomalies in 100–200 m are likely related to
25
OSD
10, 1329–1342, 2013Decadal variability of heat content in South
China Sea
W. Song et al.
Title Page
Abstract Introduction
Conclusions References
Tables Figures
◭ ◮
◭ ◮
Back Close
Full Screen / Esc
Printer-friendly Version Interactive Discussion
Discussion
P
a
per
|
Dis
cussion
P
a
per
|
Discussion
P
a
per
|
Discussio
n
P
a
per
|
occurred in 1964 and 2000, respectively. In addition, the temperature appears to rise in the recent decades.
For the comparison of XBT data and SODA product, nine boxes are chosen where the XBT data are abundant. The results show that the two datasets are comparable in terms of heat content (not shown here), and an example is given in Fig. 2. The
5
XBT data and SODA product have similar variability, especially in terms of OHC time series (Fig. 2, bottom). So, only the SODA product will be used next for heat budget calculation.
3.2 Heat balance
According to the decadal variability of OHC in the SCS (Fig. 2, bottom), four periods are
10
chosen for studying heat budget, which are 1958–1968, 1969–1981, 1982–1992, and 1993–2003 (Table 1). All terms in the heat equation except the diffusion are calculated using the SODA product as in Hanna et al. (2012). The advection term is the summation of fluxes through the four channels (Luzon Strait: 120.25◦E, 18.25–22.25◦N; Taiwan
Strait: 117.25–120.25◦E, 20.25◦N; Sunda Shelf: 104.25–111.25◦E, 1.75◦N; Mindoro 15
Strait: 117.25–120.25◦E, 6.75–14.75◦N). The climatological heat budget is consistent
with a previous study based on the results from an ocean general circulation model (Qu et al., 2004).
Inferred from the terms in Table 1, the significant factors controlling the heat content change (HCC) in the SCS differ for the four chosen periods. During 1958–1968 (period
20
P1), the OHC in the SCS was decreasing with −18.72 TW, and cannot be explained by the net surface heat flux, which was 2.53 TW into the ocean. So the advective cool-ing was the major contributor to the HCC in this period. Advection can also explain the increase of OHC during 1969–1981 (period P2). Advection was the major factor causing the heat content variation before the climate shift in 1976, explaining up to
25
OSD
10, 1329–1342, 2013Decadal variability of heat content in South
China Sea
W. Song et al.
Title Page
Abstract Introduction
Conclusions References
Tables Figures
◭ ◮
◭ ◮
Back Close
Full Screen / Esc
Printer-friendly Version Interactive Discussion
Discussion
P
a
per
|
Dis
cussion
P
a
per
|
Discussion
P
a
per
|
Discussio
n
P
a
per
|
and 1993–2003, although the contribution of advection cannot be ignored with 31 % and 14 %, respectively, for these periods. After the climate shift, the net heat flux and ocean heat advection can explain about 78 % and 83 % of the HCC during 1982–1992 and 1993–2003, respectively, and the rest of HCC may be caused by vertical flux and diffusion. There was an evident rising trend in OHC from 1992 to 2003, which nearly
5
doubles the HCC in the years from 1982 to 1992 and was mainly caused by the strong cold anomaly in 1992 and warm anomaly in 2003 (Fig. 2, bottom panel).
3.3 Spatial differences
When comparing XBT data and SODA product, we found that the HCCs in different boxes have a general resemblance (Figs. 3, 4). Three key boxes (shown in Fig. 1)
10
are chosen to study the spatial characteristics of OHC and its budget due to HCC, net heat flux and advection. The boxes are for the Luzon strait, west of Luzon Island, and Xisha warm eddy region. It seems the warming propagated from the subsurface to surface near the Luzon Strait (Fig. 3, upper panel), but the data before the 1970s should be used carefully, so the detailed characteristics should be further investigated.
15
The net heat flux and advection cannot explain the variability of OHC in the Luzon Strait, which is mainly affected by the Kuroshio Current; the dynamical processes here are complicated (such as strong Kuroshio and associated with meso-scale eddy and diffusion etc). Both Boxes 2 and 3 are located in the interior SCS and influenced by the Pacific Ocean, but each has its own characters. The temperature profile in Box 3
20
(Xisha warm eddy) has some similarity with that in Box 2 (west of Luzon Island), but the oscillation of temperature in Box 3 is more rigorous than that in Box 2 (Fig. 3, bottom and middle panels). The results of heat budget shows that advection is the major contributor to the HCC in Boxes 2 and 3, with similar trends especially during the 1970s to 1990s (Fig. 4, middle and bottom panels). The net surface heat flux decreased
25
OSD
10, 1329–1342, 2013Decadal variability of heat content in South
China Sea
W. Song et al.
Title Page
Abstract Introduction
Conclusions References
Tables Figures
◭ ◮
◭ ◮
Back Close
Full Screen / Esc
Printer-friendly Version Interactive Discussion
Discussion
P
a
per
|
Dis
cussion
P
a
per
|
Discussion
P
a
per
|
Discussio
n
P
a
per
|
4 Summary and Discussion
Using the SODA, XBT, and NCEP/NCAR flux datasets, the decadal variability of OHC in the SCS was discussed. The results show that the decadal variability of OHC is evident with two peaks and troughs during the study period. The OHC in the whole SCS was decreasing in 1958–1968, 1982–1992, and increasing in 1968–1981 and
5
1993–2003. Before the climate shift in 1976, the advection was the major factor for the heat content variation, with 78 % and 93 % contributions in periods P1 and P2, respectively. The situations were different after the climate shift, and the net surface heat flux played an important role in regulating the decadal variability during 1982–1992 and 1993–2003, although the contributions of advection cannot be ignored, at 31 % and
10
14 %, respectively.
In this paper, the spatial characteristics of the OHC in the SCS were also discussed. In the Luzon Strait, the net heat flux and advection could not account for the variability of OHC there, perhaps due to the complicated ocean dynamic processes, such as strong Kuroshio and associated meso-scale eddies and diffusion. The trends of HCC
15
and net heat flux in the study period were negative, and it is difficult to explain the HCC with the net heat flux alone. In fact, the advection was the main factor to control the decadal variability of the OHC in the interior SCS, especially during the 1970s to 1990s.
The OHC time series actually indicates the timing of OHC minimum matched
vol-20
canic eruption. Church et al. (2005) noted that after a volcanic eruption, the volcanic ash can be sent into the stratosphere and remain stable; thus, the solar radiation can be reduced, leading to decreased heat content in the ocean. For either the whole SCS or the boxes chosen, however, the local solar radiation does not match the OHC variabil-ity. Each volcanic eruption affects the global solar radiation, and then the global OHC;
25
OSD
10, 1329–1342, 2013Decadal variability of heat content in South
China Sea
W. Song et al.
Title Page
Abstract Introduction
Conclusions References
Tables Figures
◭ ◮
◭ ◮
Back Close
Full Screen / Esc
Printer-friendly Version Interactive Discussion
Discussion
P
a
per
|
Dis
cussion
P
a
per
|
Discussion
P
a
per
|
Discussio
n
P
a
per
|
References
Carton, J. A. and Giese, B. S.: A Reanalysis of Ocean Climate Using Simple Ocean Data Assimilation (SODA), Mon. Weather Rev., 136, 2999–3017, 2008.
Domingues, C. M., Church, J. A., White, N. J., Gleckler, P. J., Wijffels, S. E., Barker, P. M., and Dunn, J. R.: Improved estimates of upper-ocean warming and multi-decadal sea-level rise, 5
Nature, 453, 1090–1093, doi:10.1038/nature07080, 2008.
Fang, G. H., Wei, Z. X., Choi, B. H., Wang, K., Fang, Y., and Li, W.: Inter-basin freshwater, heat and salt transport through the boundaries of the East and South China seas from a variable-grid global ocean circulation model, Sci. China, Ser. D, 46, 149–161, 2003.
Gouretski, V. and Koltermann, K. P.: How much is the ocean really warming? , Geophys. Res. 10
Lett., 34, L01610, doi:10.1029/2006GL027834, 2007.
He, Y. and Guan, C.: Interannual and interdecadal variability in heat content of the upper ocean of South China Sea, Trop. Oceanol., 16, 23–29, 1997.
John, A. C., White, N. J., and Arblaster, J. M.: Significant decadal-scale impact of volcanic erup-tions on sea level and ocean heat content, Nature, 438, 74–77, doi:10.1038/nature04237, 15
2005.
Lentini, C. A. D., Goni, G. J., and Olson, D. B.: Investigation of Brazil current rings in the con-fluence region, J. Geophys. Res., 111, C06013, doi:10.1029/2005JC002988, 2006.
Levitus, S., Antonov, J., Boyer, T., and Stephens, C.: Warming of theworld ocean, Science, 287, 2225–2229, doi:10.1126/science.287.5461.2225, 2000.
20
Levitus, S., Antonov, J., and Boyer, T.: Warming of the world ocean, 1955–2003, Geophys. Res. Lett., 32, L02604, doi:10.1029/2004GL021592, 2005.
Levitus, S., Antonov, J. I., Boyer, T. P., Locarnini, R. A., Garcia, H. E., and Mishonov, A. V.: Global ocean heat content 1955–2008 in light of recently revealed instrumentation problems, Geophys. Res. Lett., 36, L07608, doi:10.1029/2008GL037155, 2009.
25
Liu, Q., Huang, R., and Wang, D.: Implication of the South China Sea throughflow for the interannual variability of the regional upper-ocean heat content, Adv. Atmos. Sci., 29, 54– 63, 2012.
Locarnini, R. A., Mishonov, A. V., Antonov, J. I., Boyer, T. P., and Garcia, H. E.: World Ocean Atlas 2005, 3–6, in: NOAA Atlas NESDIS 61, edited by: Levitus, S., Vol. 1, Government 30
OSD
10, 1329–1342, 2013Decadal variability of heat content in South
China Sea
W. Song et al.
Title Page
Abstract Introduction
Conclusions References
Tables Figures
◭ ◮
◭ ◮
Back Close
Full Screen / Esc
Printer-friendly Version Interactive Discussion
Discussion
P
a
per
|
Dis
cussion
P
a
per
|
Discussion
P
a
per
|
Discussio
n
P
a
per
|
Na, H., Kim, K.-Y., Chang, K.-I., Park, J. J., Kim, K., and Minobe, S.: Decadal variability of the upper ocean heat content in the East/Japan Sea and its possible relationship to northwestern Pacific variability, J. Geophys. Res., 117, C02017, doi:10.1029/2011JC007369, 2012. Qiu, B. and Chen, S.: Multidecadal sea level and gyre circulation variability in the northwestern
tropical Pacific Ocean. J. Phys. Oceanogr., 42, 193–206, 2012. 5
Qu, T., Kim, Y. Y., Yaremchuk, M., Tozuka, T., Ishida, A., and Yamagata, T.: Can Luzon Strait transport play a role in conveying the impact of ENSO to the South China Sea?, J. Climate, 17, 3644–3657, 2004.
Smith, R. D., Dukowicz, J. K., and Malone, R. C.: Parallel ocean general circulation modeling, Physica D, 60, 38–61, 1992.
10
Tozuka, T., Qu, T., Masumoto, Y., and Yamagata, T.: Impacts of the South China Sea Through-flow on seasonal and interannual variations of the Indonesian ThroughThrough-flow, Dynam. Atmos. Oceans, 47, 73–85, 2009.
Wang, D., Liu, Q., Huang, R., Du, Y., and Qu, T.: Interannual variability of the South China Sea throughflow inferred from wind data and an ocean data assimilation product, Geophys. Res. 15
Lett., 33, L14605, doi:10.1029/2006GL026316 , 2006.
Wang, Y., Fang, G., Wei Z., Qiao, F., and Chen, H.: Interannual variation of the South China Sea circulation and its relation to El Ni ˜no, as seen from a variable grid global ocean model, J. Geophys. Res., 111, C11S14, doi:10.1029/2005JC003269, 2006.
Willis, J. K., Roemmich, D., and Cornuelle, B. : Interannual variability in upper ocean heat 20
content, temperature, and thermosteric expansion on global scales, J. Geophys. Res., 109, C12036, doi:10.1029/2003JC002260, 2004.
Yan, Y., Qi, Y., and Zhou, W.: Interannual heat content variability in the South China Sea and its response to ENSO, Dynam. Atmos. Oceans, 50, 400–414, 2010.
Zong, H., Liu, Y., Xiu, P., Xu, Q., and Rong, Z.: Interannual variability of latent and sensible heat 25
OSD
10, 1329–1342, 2013Decadal variability of heat content in South
China Sea
W. Song et al.
Title Page
Abstract Introduction
Conclusions References
Tables Figures
◭ ◮
◭ ◮
Back Close
Full Screen / Esc
Printer-friendly Version Interactive Discussion
Discussion
P
a
per
|
Dis
cussion
P
a
per
|
Discussion
P
a
per
|
Discussio
n
P
a
per
|
Table 1.The terms of heat budget for the climatological mean and in the four periods shown in Fig. 2. HCC denotes heat-content change in the upper 400 m. QNET (positive into the SCS) denotes the net surface heat flux. ADV (positive into the SCS) is the ocean heat advection, and
Ris the residual heat flux (vertical advection, diffusion, etc.) Units: TW, where 1 TW=1012W.
HCC QNET ADV R
Clim 3.3835 67.69 −51.022 −13.28
P1 −18.72 2.53 −14.92 −6.33
P2 14.36 −1.77 13.23 2.90
P3 −15.53 −7.24 −4.87 −3.42
OSD
10, 1329–1342, 2013Decadal variability of heat content in South
China Sea
W. Song et al.
Title Page
Abstract Introduction
Conclusions References
Tables Figures
◭ ◮
◭ ◮
Back Close
Full Screen / Esc
Printer-friendly Version Interactive Discussion
Discussion
P
a
per
|
Dis
cussion
P
a
per
|
Discussion
P
a
per
|
Discussio
n
P
a
per
|
Fig. 2. Temperature anomalies of the whole South China Sea (contour interval: 0.2, units: ◦C; seasonal cycle removed) of the XBT (top) and SODA (middle), and the heat-content time
OSD
10, 1329–1342, 2013Decadal variability of heat content in South
China Sea
W. Song et al.
Title Page
Abstract Introduction
Conclusions References
Tables Figures
◭ ◮
◭ ◮
Back Close
Full Screen / Esc
Printer-friendly Version Interactive Discussion
Discussion
P
a
per
|
Dis
cussion
P
a
per
|
Discussion
P
a
per
|
Discussio
n
P
a
per
|