Fine Mapping and Candidate Gene Prediction of a
Pleiotropic Quantitative Trait Locus for Yield-Related
Trait in
Zea mays
Ruixiang Liu1,2, Haitao Jia1, Xiaoliang Cao1,2, Jun Huang1, Feng Li1, Yongsheng Tao2, Fazhan Qiu1, Yonglian Zheng1, Zuxin Zhang1*
1National Key Laboratory of Crop Genetic Improvement, Huazhong Agricultural University, Wuhan, China,2College of Agronomy, Hebei Agricultural University, Baoding, China
Abstract
The yield of maize grain is a highly complex quantitative trait that is controlled by multiple quantitative trait loci (QTLs) with small effects, and is frequently influenced by multiple genetic and environmental factors. Thus, it is challenging to clone a QTL for grain yield in the maize genome. Previously, we identified a major QTL,qKNPR6, for kernel number per row (KNPR) across multiple environments, and developed two nearly isogenic lines, SL57-6 and Ye478, which differ only in the allelic constitution at the short segment harboring the QTL. Recently,qKNPR6was re-evaluated in segregating populations derived from SL57-66Ye478, and was narrowed down to a 2.8 cM interval, which explained 56.3% of the phenotypic variance of KNPR in 201 F2:3families. The QTL simultaneously affected ear length, kernel weight and grain yield. Furthermore, a large F2 population with more than 12,800 plants, 191 recombinant chromosomes and 10 overlapping recombinant lines placed
qKNPR6 into a 0.91 cM interval corresponding to 198Kb of the B73 reference genome. In this region, six genes with expressed sequence tag (EST) evidence were annotated. The expression pattern and DNA diversity of the six genes were assayed in Ye478 and SL57-6. The possible candidate gene and the pathway involved in inflorescence development were discussed.
Citation:Liu R, Jia H, Cao X, Huang J, Li F, et al. (2012) Fine Mapping and Candidate Gene Prediction of a Pleiotropic Quantitative Trait Locus for Yield-Related Trait inZea mays. PLoS ONE 7(11): e49836. doi:10.1371/journal.pone.0049836
Editor:Jinfa Zhang, New Mexico State University, United States of America
ReceivedJune 21, 2012;AcceptedOctober 12, 2012;PublishedNovember 21, 2012
Copyright:ß2012 Liu et al. This is an open-access article distributed under the terms of the Creative Commons Attribution License, which permits unrestricted use, distribution, and reproduction in any medium, provided the original author and source are credited.
Funding:This study was financially supported by the National Basic Research Program of China (2009CB118400; 2011CB100100) and the Hi-tech Research and
Development Program of China (2012AA10307). (http://www.973.gov.cn/) (http://www.863.gov.cn/). The funders had no role in study design, data collection and analysis, decision to publish, or preparation of the manuscript.
Competing Interests:The authors have declared that no competing interests exist.
* E-mail: [email protected]
Introduction
Maize grain yield (GY) is the most important breeding goal, and is one of the most complex traits [1], because it comprises several yield components including kernel number (KN) and kernel weight (KW). Furthermore, the KN per ear measurement can be further classified into kernel row number (KRN) and kernel number per row (KNPR). Previous studies suggested that yield components always show higher heritability than GY [1–2], and selection of certain yield components could be more effective than direct selection for GY itself [3–4]. Thus, geneticists and breeders have strived to understand the genetic basis underlying maize GY, and its components, by quantitative trait locus (QTL) mapping approaches. Numerous QTLs for GY-related traits have been identified on maize chromosomes [5]. Those identified chromo-some regions also provide targets for QTL pyramiding and gene cloning.
Our current knowledge of the molecular regulation and genetic basis of GY mainly comes from cloned mutant genes that are involved in the regulation of inflorescence architecture and development [6]. Typically, three ramosagenes, ra1 on 7.02bin,
ra2 on 3.03bin and ra3 on 7.04bin, separately encode a C2H2 Zinc-finger protein [7], a LOB domain protein [8] and a
Trehalose phosphatase [9]. Mutation of each of the three genes results in the spikelet-pair meristems (SPMs) at the base of inflorescence to transition into branch meristems (BMs), leading to branched ears and tassels with increased degrees of branching. The second type of cloned genes is associated with meristem initiation and maintenance. Barren stalk1 (ba1) encodes a non-canonical bHLH (basic helix-loop-helix) domain protein [10] that regulates the initiation of all axillary meristems. Mutations inba1
result in mutant plants lacking vegetative tillers, ear tassel branches and spikelets [11]. Barren inflorescence2 (bif2) encodes a serine/ threonine protein kinase that regulates polar transport of auxin [12]. Bif2 mutants produce rudimentary ears and tassels that occasionally produce spikelets [13]. Moreover, thick tassel dwarf1
(td1) andfascinated ear2(fea2) encode two homologs of Arabidopsis CLAVATA proteins [14–15]. Mutation of either of the two genes influences inflorescence development by affecting the size or maintenance of the inflorescence meristem (IM). Maize GY is highly associated with female inflorescence development. The cloning of mutant genes involved in the regulation of ear architecture and development is undoubtedly helpful to under-stand the developmental regulation of GY and its components, but the genetic basis of the quantitative variation of GY and its components remains unknown.
Numerous QTLs and/or QTL clusters for GY-related traits have been identified in diverse populations; however, the cloning of QTLs remains difficult in the maize genome because of its large size and highly repetitive sequence [16]. Among identified QTLs, a clustered QTL for GY and its components on 6.01–6.03bin of the maize genome was repeatedly detected in previous studies. Ajmone-Marsan et al. (1995) reported a clustered QTL for GY in
umc59a-umc21 of 6.02–6.03bin that explained 24.5% of the
phenotypic variance [17]. Frascaroli et al. (2009) detected a QTL for GY and KN inphi075-bnlg1371(6.01bin) in two testcross populations [18]. Peng et al. (2011) also found a pleiotropic QTL simultaneously controlling GY and KN on 6.02–6.03bin across multiple environments [19]. Moreover, many QTLs for GY-related traits were identified on 6S of the maize chromosome by multiple groups, such as a QTL for ear length (EL) in
phi126-bnlg1371 [20], bnlg1538-bnlg391 [21] and phi126-npi235 [1]. Liu
et al. (2011) identified a QTL for KNPR around phi031in
Y1-umc1257 (6.01–6.02bin) [22], and Tan et al. (2011) identified a
QTL for kernel weight inumc1656-umc1796(6.02–6.04bin) [23]. Our group identified a chromosome segment around gpc2
harboring a QTL for KNPR across four environments, designated
asqKNPR6[24].
These results highlight the importance of 6.01–6.03 bin for determining GY and its components, as well as providing a key target for QTL cloning. An optional strategy to finely map and clone a QTL is to create a large segregating population by crossing nearly isogenic lines (NILs) that differ only in the allelic constitution at the short chromosome segment harboring the target QTL (QTL-NILs). In such a population, because of the absence of other segregating QTLs, the target QTL becomes the major source of genetic variation, i.e., the QTL is considered Mendelized [25]. Thus, QTL detection power, resolution, and genetic effect can be significantly improved [16]. Previous studies in our laboratory confirmed a line, SL57, containing an introgressed segment flanked bygpc2andumc1857, which showed higher KNPR, longer ears and higher GY than the recurrent parent Ye478, an elite inbred in the Reid heterotic group. This implied that the introgressed segment encodes a pleiotropic gene, or several linked genes, which could affect the performance of multiple traits. In the present study, we used two inbred lines, SL57 and Ye478, to develop a new mapping population. We then combined linkage mapping and substitution mapping strategies to: 1) re-evaluate qKNPR6 and its genetic effect underlying the introgressed segment in SL57; 2) fine map qKNPR6to a,1 cM interval; and 3) infer potential candidate genes responsible for
qKNPR6.
Materials and Methods Plant Materials
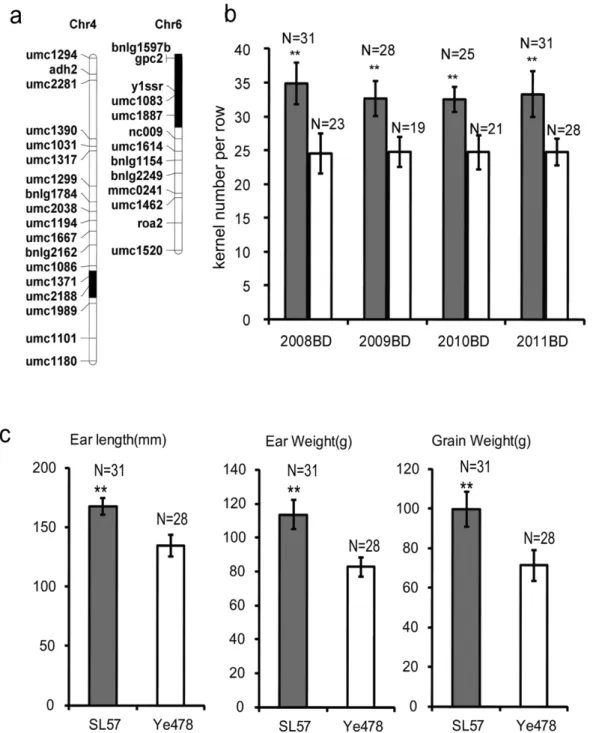
The SL57 is a chromosome segment substitution line that contains two chromosome segments, on chromosomes 4 and 6, introgressed in the Ye478 genetic background, as revealed by 173 simple sequence repeat (SSR) markers (Figure 1a). The GY-related traits: KNPR, EL, ear weight (EW) and grain weight (GW) in SL57 are significantly higher than in Ye478 (Figure 1b and 1c). A QTL for KNPR (qKNPR6) was identified across four environments within the introgressed segment on chromosome 6 [24]. SL57 and Ye478 were crossed to separate the introgression segment on chromosome 4 from the one on chromosome 6 in SL57, which created two new lines: SL57-4 containing an introgressed segment on chromosome 4, and SL57-6 containing single introgressed segment on chromosome 6. SL57-6 displayed a similar phenotype in terms of GY-related traits to that of SL57, but is genetically
more similar to Ye478 (Figure 1); thus, SL57-6 was defined as a QTL-NIL of Ye478.
Subsequently, Ye478 and SL57-6 were crossed to develop a QTL mapping population. Approximately 600 SL57-66Ye478 F2 plants were grown during the summer of 2009, of which 193 individuals were open-pollinated for linkage map construction and QTL mapping, 201 individuals were self-pollinated to develop F2:3 families for remapping of the target QTL, and the remaining individuals were genotyped to detect the recombinants that were then self-pollinated to develop homozygote recombinant lines. The phenotypes of the F2:3families and homozygote recombinant lines were evaluated by a field experiment using a randomized complete block with three replications, with twenty-two individ-uals per block, in summer 2010 at Baoding (Northern China). 12,800 F2plants were grown in summer 2011 to finely map the QTL. 1000 randomly selected F2plants were genotyped and used for QTL mapping. Using PCR-based markers within qKNPR6, 363 recombinants were selected. Of these recombinants, 191 plants carrying recombinant chromosomes were open-pollinated to evaluate the phenotype. The other recombinants were selfed to develop homozygous lines with overlapping in the introgression segment (hereafter termed sub-NIL). Ten sub-NILs, Ye478 and SL57-6 were grown at Sanya (Southern China) in winter 2011 with three replications, with twelve individuals per block. The GY-related traits were measured, including KNPR, EL, EW and GW per plant.
Molecular Marker Development and Linkage Analysis
The DNA sequence flanked by umc1656and umc1857in the B73 genome [26] was retrieved to develop SSR markers using the Simple Sequence Repeat Identification Tool [27], with the maximum motif-length set at four base pairs, and the minimum number of repeats set at 10 base pairs. Primers were designed using Primer Premier 5.0 with a product size under 300 bp. Similarly, PCR-based markers were developed in the chromo-somal interval flanked byN6M19and N6M66. Those developed SSRs from theUmc1656-Umc1857interval were used to identify the genotypes of the F2 population in summer 2009, and to construct a linkage map. The PCR-based markers within
N6M19-N6M66interval were used to identify the genotypes of the large F2
population in summer 2011. All of the developed markers that were used to screen the F2population for recombinant chromo-somes are listed in Table 1.
QTL Analysis
The phenotypic variance among NILs was estimated by analysis of variance (ANOVA). Broad-sense heritability was estimated on a family mean basis. QTL analysis was first performed by ANOVA, testing the significance of the difference between phenotypic values of the genotypic classes (homozygous for the SL57-6 allele and homozygous for the Ye478 allele) at each marker position. A significance threshold of P = 0.01 was chosen for declaring linkage between a marker and qKNPR6. QTL mapping was performed using QTL IciMapping [28].
Quantitative RT-PCR
1.0mg oligo dT on ice, and then heated to 70.0uC for 10 minutes, followed by three minutes on ice. First strand cDNA was synthesized using 1.0mL M-MLV reverse transcriptase according to the manufacturer’s instructions (Takara, Otsu, Japan). cDNA (1.0mL) was used as the template in PCR reactions, which contained 10.0mL 2 6 Smart SYBR QPCR Mix (DoGene, Shanghai, China), 0.8mL 10mM primer mixture and 8.2mL water. Reactions were performed using the Chromo4 Real-Time
PCR Detection System. The threshold value was empirically determined using the observed linear amplification phase of all primer sets. Sample cycle threshold (Ct) values were standardized for each template, based on an Actin (GRMZM2G030169) control reaction. The comparative Ct method (DDCt) was used to determine the relative transcript abundance of each gene [29]. Figure 1. Distribution of the introgressed segments and phenotype of SL57.1a: Distribution of the introgressed segments on maize chromosome 4 and 6 in SL57. The introgressed segments were identified by SSR screening. The white box represents the chromosome with the same genotype as Ye478, and the black box represents the introgressed segment. The genetic similarity between Ye478 and SL57 is 97.6%. 1b: The kernel number per row of SL57 and Ye478 under four environments. The white bar represents Ye478, and the black bar represents SL57. The horizontal axis shows four environments: Baoding in 2008 (2008BD), Baoding in 2009 (2009BD), Baoding in 2010 (2010BD) and Baoding in 2011 (2011BD). The vertical-axis shows the kernel number per row. N: The number of samples. 1c: The ear length, ear weight and grain weight of SL57 and Ye478 detected in 2010 at Baoding (northern China).
doi:10.1371/journal.pone.0049836.g001
Fine Mapping and Gene Prediction of a Maize QTL
Results
qKNPR6 Mapping
Using 193 F2 plants developed by crossing SL576Ye478 in 2009, qKNPR6 was remapped to the umc1656-umc1857 interval (24.6 cM) on 6.02–6.04 bin, explaining 39.45% of the phenotypic variance. No QTL was detected in the introgression segment on 4.08 bin (Figure 2). The allele of SL57 showed a positive additive effect and a negative dominant effect. Individuals with only one introgression segment on 6.02–6.04bin or on 4.08 bin were selected on the basis of marker genotype and were self-pollinated to produce two segmental isolines: SL57-6 harboring theqKNPR6, and SL57-4 with an introgressed segment on 4.08bin (Table 2). Comparing the phenotype among SL57-4, SL57-6 and Ye478, the KNPR was significantly greater in SL57-6 than in Ye478 across three environments (Table 2). However, the KNPR of SL57-4 was not significantly different from that of Ye478. The result agreed with the QTL mapping, and indicated that the introgressed segment within SL57-6 contains an allele that can increase KNPR relative to the Ye478 allele.
Furthermore, QTL mapping using 201 F2:3families provided more credible information on qKNPR6. ANOVA showed that variances of KNPR, EL, EW, and GW among families were significant at the p,0.001 level. These traits showed high heritability, from 83% to 91%, and were highly positively correlated with each other. For example, coefficient correlations between KNPR and EL, EW and GW were higher than 0.8 (Table 3). Those developed markers in the umc1656-umc1857 interval were used to construct a dense linkage map and identify the QTL. Thus,qKNPR6was narrowed down to a 2.8cM interval flanked by N6M19and N6M30, and had a large additive effect (3.02 kernels), explaining 56.3% of the phenotypic variance. In the
N6M19-N6M30 interval, a QTL for EL was also detected that
explained 44.99% of the phenotypic variance (Table 4 and Figure 2a). Moreover, two QTLs for EW and GW were identified in a nearby region.
The F2 individuals grown during the summer of 2009 were genotyped using markers withinumc1656-umc1857 and flanking markers to detect recombinant chromosomes inqKNPR6. Eight recombinants were self-pollinated to form sub-NILs, as shown in Figure 2b. Phenotypic evaluation indicated that sub-NILs harboring the introgressed segment flanked by umc1656 and
N6M30had higher KNPR than Ye478, while those lines with the
Ye478 genotype in the corresponding interval, such as 627-3 and 633-1, did not significantly differ in terms of KNPR from Ye478 (Figure 2c). The result confirmed that the umc1656-N6M30
interval contains a gene controlling KNPR in maize.
Fine Mapping ofqKNPR6
A larger segregating population with 12,800 F2individuals was developed from the SL57-66Ye478 cross and was used to finely
mapqKNPR6. Furthermore, newly developed markers were used
to produce a high-resolution linkage map of the target QTL interval by genotyping 1,000 randomly selected plants. Using the genotype and phenotype of these random F2samples,qKNPR6was further narrowed down to a 0.91 cM interval flanked byN6M19
andumc1257. In the same interval, QTLs for EL, EW and GW
were also detected (Table 3). The logarithms of odds (LOD) scores of these QTLs increased rapidly, up to 69.95 for KNPR. However, the phenotypic variance explained by the QTLs decreased, to only 23.34% byqKNPR6, and 7.48% by the EL QTL (Table 4). The unexpected decline could be attributed to the high environmental sensitivity of these GY-related traits. To decrease the environ-mental effect on the phenotype of these traits, 363 recombinant chromosomes were detected by genotyping all of F2plants using Table 1.Primers for QTL mapping and gene specific primers for real-time PCR.
Marker/gene Primer_F Primer_R
Primers for QTL mapping
N6M19 TAGGTAGGCTACTAGGCTAA AAGAAGAACATAAATTGGTACG
N6D139 GGGTGAAGTGTGGAGAGA GCTTTCTACAGGGATGTGT
N6M30 GCATTGTTTGACTGGACTAG AAGAGATAGAGCAGGACACT
N6D262 CGGCAACCGATTAGTTAT CGTCTGGGAAGAGAGATG
N6D354 CTGCCCGCACAATCATTT AGGAGAGTGAGGTGAGAAG
N6D389 CGCTTGAAATGGAAAGGTAG CTGCTGCTGGTCTACAAC
N6M46 TGAACAGTGTGCTAGAGTG TGAATTGCCAGTTGAATGC
N6D543 GGTCCAGGTCCAATGAAC ATTACGCACGCAATTAGC
N6M64 TCATCACCAACCCTTCCA ATCAGCAGGTCGTCGTAT
N6M66 TGATGCGACACTGATTAGAT CTTTGCGATGTCCTCCTATA
N6M123 GAATCCTTGAGACCTTGACA CCACCAGACGATGATGAAT
N6M137 CGAGAACGGAAGTAGTACC TCATTGCTGTCCAAATTGAC
Primers for real-time PCR
GRMZM2G128485 GGAAGGCTACGAGTACAGAAG CAGGCACGAGGTCAACAC
GRMZM2G428518 CGACCTCCGCTACTCCATC GTTGTGTTGCCGCCGAAG
GRMZM2G128574 AGGCTGGTATTGACTGATG GGACACGAAGGTTCTCTG
GRMZM2G119678 AGTAGGAGGATGGAGGATTG CGCTGAATGGTTGTTGTTG
GRMZM2G119714 TGGAGAACTCGGGTAAAT CTGCGACTCTTGTGCTAA
GRMZM2G128560 TCGGCTTCTTCAAGGACAGGA CAAACGGGAGCGTCAAATCA
Actin (GRMZM2G030169) GACGCAGAGGACATTCAG GGCTTCATCACCAACATAAG
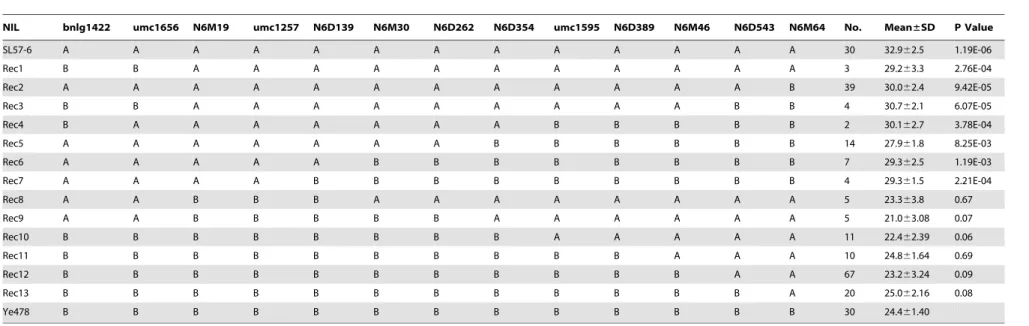
markers within and flanking qKNPR6. Of these recombinant chromosomes, 191, representing 13 meiotic events, were open-pollinated to evaluate their phenotypes in summer 2011. The phenotypic means of recombinants with the same genotype were used to detect QTLs by a t-test. The result demonstrated that Rec1 to Rec7 carried the SL57-6 allele in the N6M19-umc1257 interval, while Rec8 to Rec13 carried the Ye478 allele in the corresponding interval. The KNPR of Rec1 to Rec7 was distinctly higher than that of Ye478, as well as being higher than that of Rec8 to Rec13 (Table 5), indicating thatN6M19-umc1257interval might contain a QTL for KNPR. The remaining recombinants (172) were self-pollinated to develop homozygous recombinant lines (sub-NILs), and were then phenotypically assessed in winter 2011 at Sanya (Southern China). The result of QTL mapping using the sub-NILs was consistent with the results of linkage mapping in the F2 population and of the substitution mapping using the recombinants, supporting the view that qKNPR6 is
harbored within the N6M19-umc1257 interval (Figure 3a,3b). Notably, those sub-NILs holding the favorable allele ofqKNPR6
also showed greater performance in EL, EW and GW per ear than Ye478 (Figure 3c–3e), indicating that the N6M19-umc1257 region might affect the performance of multiple traits, i.e., it could be a pleiotropic locus.
Prediction of Candidates and Expression Assays
The N6M19-umc1257 interval on the B73 genome is about
198 Kb long, and contains six genes annotated in B73 RefGen_v2. GRMZM2G119714 encodes a serine/threonine protein kinase receptor (STKR) protein that is highly homologous with receptor protein kinase PERK-like in Oryza sativa, but markedly differs from Bif2 of maize (Figure 4a). GRMZM2G119678 encodes a SET domain-containing protein group 102 (SDG102), which is highly homologous withArabidopsis
ASHH2/SDG8 [30]. GRMZM2G428518 encodes a protein Figure 2. QTL interval for kernel number per row identified in different populations.2a: The QTL interval detected using different segregation populations; the high LOD score supported the QTL interval. 2b: The genotypes of sub-NILs derived from the recombinant chromosomes. The black boxes or bars represent marker genotypes of SL57-6, the white boxes represent marker genotypes of Ye478. 2c: The phenotypes of sub-NILs detected in summer 2010 at Baoding (northern China). The amount in parentheses showed the number of samples. **: Significant difference at P = 0.01.
doi:10.1371/journal.pone.0049836.g002
Fine Mapping and Gene Prediction of a Maize QTL
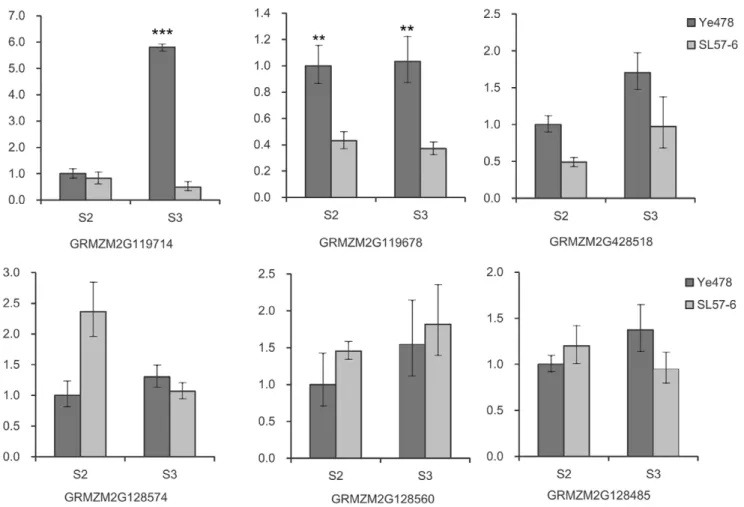
homologous with alpha-glucosidase in Oryza sativa, and GRMZM2G128485 encodes a BTB superfamily protein that is 61% homologous with a Brachypodium distachyon BTB/POZ domain-containing protein that is involved in auxin signaling. The other two genes are of unknown function. A qPCR assay revealed that the six genes were expressed in the immature ears of both SL57-6 and Ye478. The expression ofSTKRin Ye478 at the spikelet meristems (SMs) stage was significantly higher than in SL57-6. The expression ofSDG102in Ye478 was markedly higher than in SL57-6 at SPM and SM developmental stages (Figure 5). The expressions of the other candidates showed no significant differences between Ye478 and SL57-6 at the p = 0.01 level. Sequencing demonstrated that the coding regions of bothSTKR
andSDG102were highly conserved in Ye478 and SL57-6. Four
SNPs were identified in the coding region ofSTKR,of which two C/G SNPs led to amino acid substitutions: Leu to Var and Gln to Glu (Figure 4b). The two amino acids are not conserved among plant species. The 59-upstream sequence of SDG102 has a few SNPs between Ye478 and SL57-6, and only one C/T SNP was found in the coding region ofSDG102 (Figure 4c). However, the promoter region of the STKR gene showed a large insertion/ deletion variation (Figure 4b), which might affect the expression level of the gene in the two NILs.
Table 3.Pearson correlations among the studied traits and the heritability of these traits.
KNPR EL (mm) EW (g) GW (g) Hb2(%)
KNPR 1.00 91.1
EL (mm) 0.83*** 1.00 90.8
EW (g) 0.81*** 0.78*** 1.00 83.8
GW (g) 0.83*** 0.77*** 0.94*** 1.00 83.0
KNPR, kernel number per row. EL, ear length. EW, ear weight. GW, grain weight. ***indicates significance at p,0.001.
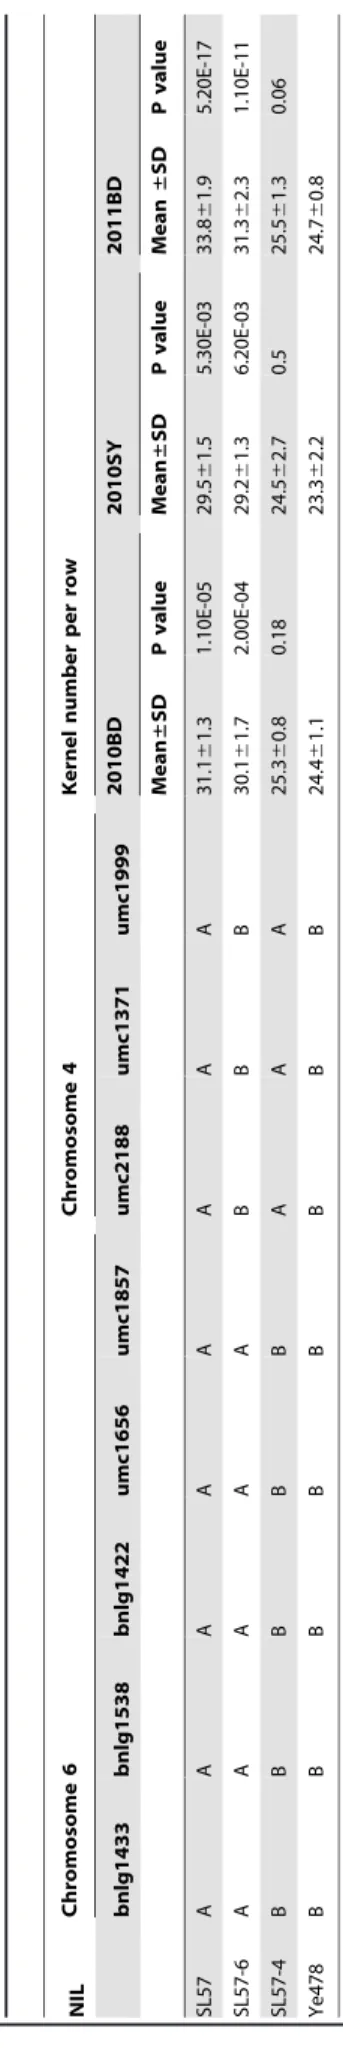
doi:10.1371/journal.pone.0049836.t003 Table 2. Phenotypic effects of introgression segments in chromosome 4 and 6 detected in three environments. NIL Chromosome 6 Chromosome 4 Kernel number per row bnlg1433 bnlg1538 bnlg1422 umc1656 umc1857 umc2188 umc1371 umc1999 2010BD 2010SY 2011BD Mean ± SD P value Mean ± SD P value Mean ± SD P value SL57 A A A A A A A A 31.1 6 1.3 1.10E-05 29.5 6 1.5 5 .30E-03 3 3.8 6 1.9 5 .20E-17 SL57-6 A A A A A B B B 30.1 6 1.7 2.00E-04 29.2 6 1.3 6 .20E-03 3 1.3 6 2.3 1 .10E-11 SL57-4 B B B B B A A A 25.3 6 0.8 0.18 24.5 6 2.7 0 .5 25.5 6 1.3 0 .06 Ye478 B B B B B B B B 24.4 6 1.1 23.3 6 2.2 2 4.7 6 0.8 A and B represent m arker g enotypes that are the same as SL57 and Y e478, respectively. 2010BD, 2010SY and 2011BD indicate that kernel number p er row w as measured in 2010 at Baoding (Northern China), in 2010 at Sanya (Southern China) and in 2011 at Baoding, respectively. doi:10.1371/journal.pone.0049 836.t002
Table 4.QTLs detected in the F2:3families in summer 2010.
Population Trait Marker Interval LOD PVE (%) Add Dom
2010 F2:3
families
KNPR N6M19-N6M30 33.28 56.14 3.01 0.19
EL (mm) N6M19-N6M30 32.08 44.99 11.81 5.44
EW (g) umc1656-N6M19 23.55 41.76 12.36 2.99
GW (g) umc1656-N6M19 22.44 40.24 11.22 2.72
2011 F2 KNPR N6M19-umc1257 69.95 23.34 2.01 0.93
EL (mm) N6M19-umc1257 20.43 7.48 5.18 0.67
EW (g) N6M19-umc1257 30.41 11.04 7.28 1.78
GW (g) N6M19-umc1257 26.60 9.72 6.42 20.53
KNPR, kernel number per row. EL, ear length. EW, ear weight. GW, grain weight. LOD, logarithms of odds.
Add, Additive. Dom, Dominant.
Table 5.Genotype and phenotype of homozygous recombinants selected from the F2in 2011.
NIL bnlg1422 umc1656 N6M19 umc1257 N6D139 N6M30 N6D262 N6D354 umc1595 N6D389 N6M46 N6D543 N6M64 No. Mean±SD P Value
SL57-6 A A A A A A A A A A A A A 30 32.962.5 1.19E-06
Rec1 B B A A A A A A A A A A A 3 29.263.3 2.76E-04
Rec2 A A A A A A A A A A A A B 39 30.062.4 9.42E-05
Rec3 B B A A A A A A A A A B B 4 30.762.1 6.07E-05
Rec4 B A A A A A A A B B B B B 2 30.162.7 3.78E-04
Rec5 A A A A A A A B B B B B B 14 27.961.8 8.25E-03
Rec6 A A A A A B B B B B B B B 7 29.362.5 1.19E-03
Rec7 A A A A B B B B B B B B B 4 29.361.5 2.21E-04
Rec8 A A B B B A A A A A A A A 5 23.363.8 0.67
Rec9 A A B B B B B A A A A A A 5 21.063.08 0.07
Rec10 B B B B B B B B A A A A A 11 22.462.39 0.06
Rec11 B B B B B B B B B B A A A 10 24.861.64 0.69
Rec12 B B B B B B B B B B B A A 67 23.263.24 0.09
Rec13 B B B B B B B B B B B B A 20 25.062.16 0.08
Ye478 B B B B B B B B B B B B B 30 24.461.40
A and B represent marker genotypes that are the same as SL57-6 and Ye478, respectively. No. shows the number of recombinants with the same genotype.
doi:10.1371/journal.pone.0049836.t005
Fine
Mapping
and
Gene
Prediction
of
a
Maize
QTL
PLOS
ONE
|
www.ploson
e.org
7
November
2012
|
Volume
7
|
Issue
11
|
Discussion
The qKNPR6 Might be a Pleiotropic Locus
Most agronomically important traits in crop plants, such as GY, quality, and resistance to biotic and abiotic stresses, are complex quantitative traits that are usually controlled by multiple QTLs which are frequently clustered on the genome [1–31], [32–33], [34–35]. The clustered QTLs can be genetically explained by QTL pleiotropy or tight linkage of QTLs. QTL analysis typically
produces a large confidence interval spanning 10–30 cM, com-prising several hundred genes; therefore, it is usually uncertain whether a QTL represents one or multiple genes, which makes it difficult to ascertain whether a QTL cluster results from a pleiotropic gene or from multiple linked genes. In one case, clustered QTLs were resolved in linked QTLs with minor effects. QTL mapping studies in maize clearly showed that clustered QTLs for complex traits, such as plant height and GY, could be separated into multiple QTLs when the resolution of the linkage Figure 3. Genotype and phenotype of homozygous recombinant lines developed from a large F2population in summer 2011.3a
shows the genotype of the recombinant lines, No. shows the number of samples, A and B represent marker genotypes that are the same as SL57-6 and Ye478, respectively. 3b–3e show phenotypes of kernel number per row (3b), ear length (3c), ear weight (3d) and grain weight per ear (3e) detected in winter 2011 at Sanya, respectively. **: Significant difference at P = 0.01.
analysis improved from a 10–30 cM to a 1–5 cM interval [36–37], [38–39]. In another case, a QTL cluster was mapped as a major QTL affecting multiple traits that correlated with each other: the QTL acts as a regulator in multiple biological pathways [35–40], [41–42]. Several cloned QTLs have provided evidence of gene pleiotropy. For example, vgt1 controls flowering time and plant node number in maize [40],tb1affects the plant and inflorescence architecture [43], andGhd7 and Ghd8 simultaneously affect GY, plant height and heading date in rice [41–42].
In the present study, KNPR in maize was significantly correlated with EL, as well as with EW and GW (Table 3). A developmental association of the two traits could explain the highly positive correlation between KNPR and EL. The correla-tion between KNPR and GW could be attributed to the indirect
effect of alteration of KN on EW per plant. QTL mapping in F2:3 families indicated that multiple QTLs for the above-mentioned traits were clustered in a,2.8 cM interval (Table 4). When the clustered QTLs were further narrowed down to an approximately 198Kb region by substitution mapping, the QTL’s simultaneous effects on the performance of the four association traits were still observed (Figure 3). This suggested that qKNPR6 might be a pleiotropic locus that simultaneously affects KNPR and EL, and indirectly affects EW and GW per plant in maize.
Possible Candidate Gene Underlying the qKNPR6
Maize female inflorescence originates from an axillary meristem at the tip of a lateral shoot in the axil of a leaf. When the plant transitions from vegetative to reproductive development, the axial Figure 4. Diversity of serine/threonine protein kinase receptor gene and SET domain-containing protein gene.4a: The phylogenetic tree of serine/threonine protein kinase receptor proteins from several plant species. GRMZM2G119714, which encodes a serine/threonine protein kinase receptor, is clustered into a different clade from Bif2, a known serine/threonine protein kinase in maize. 4b: The nucleotide and amino acid variation of serine/threonine protein kinase receptor protein between Ye478 and SL57-6. 4c: The nucleotide variation of SET domain-containing protein genes between Ye478 and SL57-6.
doi:10.1371/journal.pone.0049836.g004
Fine Mapping and Gene Prediction of a Maize QTL
meristem becomes an IM, and the IM produces multiple rows of SPMs, a kind of short BM, which then form two SMs. Each SM uniquely initiates two floral meristems (FMs) (upper FM and lower FM), and each FM subsequently forms the floral organs. Subsequently, the lower floret and the stamens abort, resulting in the formation of single female florets. Obviously, a kernel in maize ear is developed from a pollinated floret. This implies that the number of fertile florets in a given row of SMs determine the possible KN in the row. In other words, maintaining a high differentiating activity in the SM is important for developing more FMs that produce fertile florets. Thus, those genes that are involved in regulation of the differentiating capacity of IMs are probable candidates for genetic control of KNPR in maize. Within the 198Kb region ofqKNPR6, the B73 genome encodes six genes with EST evidence and all six genes are expressed in maize immature ears [44].
The expression level, sequence variation and the annotated biological function in model species of the six genes in SL57-6 and Ye478 could provide clues to identity the candidate gene. Among the six predicted candidates for qKNPR6, quantitative PCR revealed that theSTKRandSDG102were differentially expressed in two NILs, Ye478 and SL57-6, while the other genes displayed similar expression levels in the two NILs and had similar expression patterns during the different developmental stages of the immature ear (Figure 5). Temporal and spatial expression patterns showed that the serine/threonine-protein kinase receptor gene is highly expressed in the immature ear, roots, 20-day Figure 5. Relative level of candidate gene expression in immature ears. S2: Differentiation stage of the spikelet-pair meristem. S3: Differentiation stage of the spikelet meristem. **: Significant difference at P = 0.01, ***: Significant difference at P = 0.001.
doi:10.1371/journal.pone.0049836.g005
endosperm, ovule, and tassel, but is not expressed in pollen or leaves [44]. Previous studies demonstrated thatBarren inflorescence2
(Bif2) encodes a serine/threonine protein kinase [12] that phosphorylates ZmPIN1a to regulate the subcellular localization of ZmPIN1a [45]. Bif2 mutants produce rudimentary ears that occasionally produce spikelets [13]. In the 198Kb segment, one candidate gene encodes a receptor protein serine/threonine kinase (STKR) that plays a role in the regulation of cell proliferation, cell differentiation, and embryonic development by phosphorylating receptor proteins. Sequencing revealed that the coding regions of theSTKRgene was highly conserved, while the promoter region showed a large insertion/deletion variation, which might affect the expression level of the gene in Ye478 and SL57-6. Another differentially expressed gene,SDG102, is a homolog of Arabidopsis
ASHH2/SDG8[30], which is a class of proteins that have been
implicated in regulating gene expression through H3K36 trimethylation modification [46].ASHH2/SDG8is a repressor of the transition from vegetative to reproductive growth [47–48], and is a regulator of shoot branching, flower morphology and fertility
in Arabidopsis [49]. ASHH2/SDG8 mutants can downregulate
expression of the floral organ identifying genesAPETALA1 (AP1) andAP3, display homeotic changes of floral organs and have very low seed sets because of developmental defects of reproductive organs. By inference, we suggest that one of the two genes is a likely candidate for qKNPR6, owing to their function in inflores-cence development and floral organ differentiation, but direct evidence from map-based cloning, genetic transformation and mutants are still required.
If one of the two genes is responsible for theqKNPR6, how does it act to control KNPR in maize? Upadyayula et al. (2006) summarized the genetic steps of the functions of several cloned genes in the development of the tassel and ear (Figure 6) [50]. Both
Fasciated ear2 (Fea2) and Thick tassel dwarf1 (td1) have similar
functions in the transition from AM or SAM to IM. Barren
inflorescence2(Bif2) affects the transition from IM to SPM or BM,
and bothRa1andRa2have similar functions in the transition from SPM to BM.Branched silkless1(Bd1) is required for FM identity, and regulates the transition from SM to FM. Notably, Bif2, which encodes a serine/threonine protein kinase co-orthologous to PINOID [12], is required for maintenance of the BM, SM and FM in the inflorescence. During inflorescence development, BIF2 directly phosphorylates ZmPIN1a, and regulates auxin transport by regulation of the subcellular localization of ZmPIN1a [45]. In addition, the heterochronic expression of a gene is considered a regulator of phenotypic variation of a quantitative trait, such as
fw2.2 [51] and Ghd7 [41]. Thus, we postulate that the STKR
protein might function together with BIF2 to positively regulate auxin efflux by phosphorylation of PIN1a. The heterochronic expression ofqKNPR6 in an inflorescence might regulate auxin concentration and its temporal and spatial distribution, affecting the activity duration of the BM, SM and FM, which in turn would regulate the KN in a maize ear. If theSDG102is responsible for
theqKNPR6, on the basis of function of its homolog of Arabidopsis
ASHH2/SDG8, then qKNPR6 is postulated to be a repressor of
transition from vegetative to reproductive growth. More FMs (or kernels) in female inflorescence of SL57 than that of Ye478 might be explained by lower expression ofSDG102in SL57 inflorescence allowing earlier transition from vegetative to reproductive growth.
Author Contributions
Conceived and designed the experiments: ZZ YZ. Performed the experiments: RL HJ XC FL JH. Analyzed the data: RL ZZ YT. Wrote the paper: ZZ RL FQ. Critically read and approved the manuscript: ZZ RL HJ XC JH FL YT FQ YZ.
References
1. Austin DF, Lee M (1996) Comparative mapping in F2:3and F6:7generations of
quantitative trait loci for grain yield and yield components in maize. Theor Appl Genet 92: 817–826.
2. Messmer R, Fracheboud Y, Banziger M, Vargas M, Stamp P, et al. (2009) Drought stress and tropical maize: QTL-by-environment interactions and stability of QTL across environments for yield components and secondary traits. Theor Appl Genet 119: 913–930.
3. Gupta PK, Rustgi S, Kumar N (2006) Genetic and molecular basis of grain size and grain number and its relevance to grain productivity in higher plants. Genome 49: 565–571.
4. Robinson HF, Comstock RC, Harvery PH (1951) Genotypic and phenotypic correlations in corn and their implication in selection. Agron J 43: 282–287. 5. Tuberosa R, Salvi S (2009) QTL for agronomic traits in maize production. In:
Bennetzen J, Hake S (eds) Handbook of maize: its biology. Springer LLC. pp501–542.
6. Vollbrecht E, Schmidt RJ (2008) Development of the maize inflorescences. In: ennetzen J, Hake S (eds) Handbook of Maize: Its Biology. Springer LLC. pp13– 40.
7. Vollbrecht E, Springer PS, Goh L, Buckler ES, Martienssen R (2005) Architecture of floral branch systems in maize and related grasses. Nature 436: 1119–1126.
8. Bortiri E, Chuck G, Vollbrecht E, Rocheford TF, Martienssen R, et al. (2006)
ramosa2encodes a lateral organ boundary domain protein that determines the fate of stem cells in branch meristems of maize. The Plant Cell 18: 574–585. 9. Satoh N, Nagasawa N, Malcomber S, Sakai H, Jackson D (2006) A trehalose
metabolic enzyme controls inflorescence architecture in maize. Nature 441: 227–230.
10. Gallavotti A, Zhao Q, Kyozuka J, Meeley RB, Ritter M, et al. (2004) The role of
barren stalk1in the architecture of maize. Nature 432: 630–635.
11. Ritter MK, Padilla CM, Schmidt RJ (2002) The maize mutant,barren stalk 1, is defective in axillary meristem development. Am J Bot 89: 203–210. 12. McSteen P, Malcomber S, Skirpan A, Lunde C, Wu X, et al. (2007)barren
inflorescence2encodes a co-ortholog of the PINOID serine/threonine kinase and is required for organogenesis during inflorescence and vegetative development in maize. Plant Physiol 144: 1000–1011.
13. McSteen P, Hake S (2001) barren inflorescence2 regulates axillary meristem development in the maize inflorescence. Development 128: 2881–2891.
14. Bommert P, Lunde C, Nardmann J, Vollbrecht E, Running M, et al. (2005)thick tassel dwarf1encodes a putative maize ortholog of the Arabidopsis CLAVATA1 leucine-rich repeat receptor-like kinase. Development 132: 1235–1245. 15. Taguchi-Shiobara F, Yuan Z, Hake S, Jackson D (2001) Thefasciated ear2gene
encodes a leucine-rich repeat receptor-like protein that regulates shoot meristem proliferation in maize. Genes Dev 15: 2755–2766.
16. Salvi S, Tuberosa R (2005) To clone or not to clone plant QTL: present and future challenges. Trends in Plant Science 10: 297–304.
17. Ajmone-Marsan P, Monfredini G, Ludwig WF, Melchinger AE, Franceschini P, et al. (1995) In an elite cross of maize a major quantitative trait locus controls one-fourth of the genetic variation for grain yield. Theor Appl Genet 90 415– 424.
18. Frascaroli E, Cane` MA, Pe` ME, Pea G, Morgante M, Landi P (2009) QTL detection in maize testcross progenies as affected by related and unrelated testers. Theor Appl Genet 118: 993–1004.
19. Peng B, Li Y, Wang Y, Liu C, Liu Z, et al. (2011) QTL analysis for yield components and kernel-related traits in maize across multi-environments. Theor Appl Genet 122: 1305–1320.
20. Ross AJ, Hallauer AR, Lee M (2006) Genetic analysis of traits correlated with ear length. Maydica 52: 301–313.
21. Ma XQ, Tang JH, Teng WT, Yan JB, Meng YJ, et al. (2007) Epistatic interaction is an important genetic basis of grain yield and its components in maize. Mol Breed 20: 41–51.
22. Liu XH, He SL, Zheng ZP, Tan ZB, Li Z, et al. (2011) Genetic loci mapping associated with maize kernel number per ear based on a recombinant inbred line population grown under different nitrogen regimes. Genet Mol Res 10: 3267– 3274.
23. Tan W, Wang Y, Li Y, Liu C, Liu Z, et al. (2011) QTL analysis of ear traits in maize across multiple environments. Scientia Agricultura Sinica 44: 233–244. 24. Liu R, Zhang H, Zhao P, Zhang Z, Liang W, et al. (2012) Mining of candidate
maize genes for nitrogen use efficiency by integrating gene expression and QTL data. Plant Mol Biol Rep 30: 297–308.
25. Alonso-Blanco C, Koornneef M (2000) Naturally occurring variation in
Arabidopsis: an underexploited resource for plant genetics. Trends Plant Sci 5: 22–29.
26. Schnable PS, Ware D, Fulton RS, Stein JC, Wei F, et al. (2009) The B73 Maize Genome: Complexity, Diversity, and Dynamics. Science 326: 1112–1115.
Fine Mapping and Gene Prediction of a Maize QTL
27. Temnykh S, DeClerck G, Lukashova A, Lipovich L, Cartinhour S, et al. (2001) Computational and experimental analysis of microsatellites in rice (Oryza sativa
L.): frequency, length variation, transposon associations, and genetic marker potential. Genome Res 11: 1441–1452.
28. Li H, Ye G, Wang J (2007) A modified algorithm for the improvement of composite interval mapping. Genetics 175: 361–374.
29. Livak KJ, Schmittgen TD (2001) Analysis of relative gene expression data using real-time quantitative PCR and the 2-[Delta][Delta] CT method. Methods 25: 402–408.
30. Springer NM, Napoli CA, Selinger DA, Pandey R, Cone KC, et al. (2003) Comparative analysis of SET domain proteins in maize and Arabidopsis reveals multiple duplications preceding the divergence of monocots and dicots. Plant Physiol 132: 907–925.
31. Austin DF, Lee M (1998) Detection of quantitative trait loci for grain yield and yield components in maize across generations in stress and nonstress environments. Crop Sci 38: 1296–1308.
32. Melchinger AE, Utz FH, Schon CC (1998) Quantitative trait locus (QTL) mapping using different testers and independent population samples in maize reveals low power of QTL detection and large bias in estimates of QTL effects. Genetics 149: 383–403.
33. Thomson MJ, Tai TH, McClung AM, Lai XH, Hinga ME, et al. (2003) Mapping quantitative trait loci for yield, yield components and morphological traits in an advanced backcross population between Oryza rufipogon and the
Oryza sativacultivar Jefferson. Theor Appl Genet 107: 479–493.
34. Veldboom LR, Lee M (1994) Molecular-marker facilitated studies of morphological traits in maize. II. Determination of QTL for grain yield and yield components. Theor Appl Genet 88: 451–458.
35. Wang P, Zhou G, Cui K, Li Z, Yu S (2012) Clustered QTL for source leaf size and yield traits in rice (Oryza sativaL.). Mol Breed 29: 99–113.
36. Graham GI, Wolff DW, Stuber CW (1997) Characterization of a yield quantitative trait locus on chromosome five of maize by fine mapping. Crop Sci. 37: 1601–1610.
37. Paterson AH, Deverna JW, Lanini B, Tanksley SD (1990) Fine mapping of quantitative trait loci using selected overlapping recombinant chromosomes in an interspecies cross of tomato. Genetics 124: 735–742.
38. Monforte AJ, Tanksley SD (2000) Fine mapping of a quantitative trait locus (QTL) fromLycopersicon hirsutumchromosome 1 affecting fruit characteristics and agronomic traits: breaking linkage among QTL affecting different traits and dissection of heterosis for yield. Theor Appl Genet 100: 471–479.
39. Fridman E, Liu YS, Carmel-Goren L, Gur A, Shoresh M, et al. (2002) Two tightly linked QTL modify tomato sugar content via different physiological pathways. Mol Genet Genomics 266: 821–826.
40. Salvi S, Sponza G, Morgante M, Tomes D, Niu X, et al. (2007) Conserved non-coding genomic sequences controlling flowering time differences in maize. Proc Natl Acad Sci U S A 104: 11376–11381.
41. Xue W, Xing Y, Weng X, Zhao Y, Tang W, et al. (2008) Natural variation in
Ghd7is an important regulator of heading date and yield potential in rice. Nat Genet 40: 761–767.
42. Yan WH, Wang P, Chen HX, Zhou HJ, Li QP, et al. (2011) A major QTL,
Ghd8, plays pleiotropic roles in regulating grain productivity, plant height, and heading date in rice. Mol Plant 4: 319–330.
43. Clark RM, Wagler TN, Quijada P, Doebley J (2006) A distant upstream enhancer at the maize domestication gene tb1 has pleiotropic effects on plant and inflorescent architecture. Nat Genet 38: 594–597.
44. Sekhon RS, Lin H, Childs KL, Hansey CN, Buell CR, et al. (2011) Genome-wide atlas of transcription during maize development. The Plant J 66: 553–563. 45. Skirpan A, Culler AH, Gallavotti A, Jackson D, Cohen JD, et al. (2009)BARREN INFLORESCENCE2interaction withZmPIN1asuggests a role in auxin transport during maize inflorescence development. Plant Cell Physiol 50: 652–657. 46. Thorstensen T, Grini PE, Aalen RB (2011) SET domain proteins in plant
development. Biochimica et Biophysica Acta 1809: 407–420.
47. Kim SY, He Y, Jacob Y, Noh YS, Michaels S, Amasino R (2005). Establishment of the vernalization-responsive, winter-annual habit in Arabidopsis requires a putative histone H3 methyl transferase. The Plant Cell 17: 3301–3310. 48. Zhao Z, Yu Y, Meyer D, Wu C, Shen WH (2005) Prevention of early flowering
by expression of FLOWERING LOCUS C requires methylation of histone H3K36. Nat Cell Biol 7: 1156–1160.
49. Grini PE, Thorstensen T, Alm V, Vizcay-Barrena G, Windju SS, et al. (2009) The ASH1 HOMOLOG 2 (ASHH2) histone H3 methyltransferase is required for ovule and anther development in Arabidopsis. PLoS One 4: e7817. 50. Upadyayula N, da Silva HS, Bohn MO, Rocheford TR (2006) Genetic and
QTL analysis of maize tassel and ear inflorescence architecture. Theor Appl Genet 112: 592–606.