ANDRÉ MARUBAYASHI HIDALGO
FINE MAPPING AND SINGLE NUCLEOTIDE POLYMORPHISM EFFECTS ESTIMATION ON PIG CHROMOSOMES 1, 4, 7, 8, 17 AND X
Dissertation presented to the Genetics and Breeding Graduate Program of the Universidade Federal de Viçosa, in partial fulfillment of the requirements for degree of Magister Scientiae.
VIÇOSA
ii ANDRÉ MARUBAYASHI HIDALGO
FINE MAPPING AND SINGLE NUCLEOTIDE POLYMORPHISM EFFECTS ESTIMATION ON PIG CHROMOSOMES 1, 4, 7, 8, 17 AND X
Dissertation presented to the Genetics and Breeding Graduate Program of the Universidade Federal de Viçosa, in partial fulfillment of the requirements for degree of Magister Scientiae.
APPROVED: July 8th, 2011.
_______________________________ _______________________________ Prof. Eliane Gasparino Dr. Samuel Rezende Paiva
_______________________________ _______________________________ Prof. Simone E. F. Guimarães Prof. Paulo Sávio Lopes (Co-adviser) (Adviser)
ii AKNOWLEDGEMENTS
My family, Osvaldo Hidalgo da Silva, Mirian Marubayashi Hidalgo, Davi Marubayashi Hidalgo and Eliete Marubayashi for the care, support, comfort and for believing in me all my life;
Professor Paulo Sávio Lopes, my adviser, for his valuable supervision, teachings, patience, friendship, advice and opportunities given to me;
Professor Simone Eliza Facioni Guimarães, my co-adviser, for her supervision, teachings and friendship;
Professor Fabyano Fonseca e Silva, my co-adviser, for his help during analyses, R lessons and friendship;
Professor Robledo de Almeida Torres and Ricardo Frederico Euclydes for friendship and teachings;
My girlfriend Viviane Endo and her family for support, care and confidence during these years;
My friends from Salinha, Ali, Aline, Ana Lúcia, Batata, Bruno, Carla, Cris, Edinho, Felipe, Giovani, Henrique, Jeferson, Jô, Luciano, Luiz, Mariele, Matilde and Rodrigo, for the good times, jokes, pleasant workplace and for the friendship;
My friends from LABTEC, Ana Paula, Carlos, Carol, Darlene, Erika, Iuri, Katiene, Lucas, Marcola, Margareth, Mayara, Renata, Robert and especially Débora for learning exchange, friendship and pleasant workplace;
Professor Elias Nunes Martins, my undergraduate adviser, for awakening my desire to work with animal breeding and also for his valuable teachings and friendship;
Professor Eliane Gasparino and Dr. Samuel Paiva for participating on the defense committee;
Professors, technicians and employees from the Genetics and Breeding Graduate Program and Department of Animal Science;
The Universidade Federal de Viçosa (UFV), especially the Genetics and Breeding Graduate Program and the Department of Animal Science (DZO), for the opportunity of carrying out the course;
Coordenação de Aperfeiçoamento de Pessoal de Nível Superior (CAPES) for the financial support;
iii TABLE OF CONTENTS
RESUMO ... iiv ABSTRACT... vii Chapter 1
GENERAL INTRODUCTION ...1 Chapter 2
iv RESUMO
HIDALGO, André Marubayashi, M.Sc., Universidade Federal de Viçosa, julho, 2011. Mapeamento fino e estimação dos efeitos de polimorfismos de base única nos cromossomos suínos 1, 4, 7, 8, 17 e X. Orientador: Paulo Sávio Lopes. Co-orientadores: Fabyano Fonseca e Silva e Simone Eliza Facioni Guimarães.
Mapeamento de loci de caracaterística quantitativas (QTL) geralmente resultam na detecção de regiões genômicas que explicam parte da variação quantitativa da característica. Entretanto essas regiões são muito amplas e não permitem uma acurada identificação dos genes. Dessa forma, torna-se necessário o estreitamento dos intervalos onde os QTL estão localizados. Com a seleção genômica ampla (GWS), foram desenvolvidas ferramentas estatísticas de forma a se estimar os efeitos de cada marcador. A partir dos valores desses efeitos, pode-se analisar quais são os marcadores de maiores efeitos. Assim, objetivou-se realizar o mapeamento fino dos cromossomos suínos 1, 4, 7, 8, 17, e X, usando marcadores microsatélites e polimorfismo de base única (SNP), em uma população F2 produzida pelo cruzamento de varrões da raça naturalizada brasileira Piau com fêmeas comerciais, associados com características de desempenho, carcaça, orgãos internos, cortes e qualidade de carne. Também objetivou-se estimar os efeitos dos marcadores SNP nas características que tiveram QTL detectados, analisar quais são os mais expressivos e verificar se eles estão localizados dentro do intervalo de confiança do QTL. Os QTL foram identificados por meio do método regressão por intervalo de mapeamento e as análises foram realizadas pelo
vi ABSTRACT
HIDALGO, André Marubayashi, M.Sc., Universidade Federal de Viçosa, july, 2011. Fine mapping and single nucleotide polymorphism effects estimation on pig chromosomes 1, 4, 7, 8, 17 and X. Adviser: Paulo Sávio Lopes. Co-Advisers: Fabyano Fonseca e Silva and Simone Eliza Facioni Guimarães.
1 Chapter 1
GENERAL INTRODUCTION
Molecular genetics has made great advances in recent times due the development of dense maps of single nucleotide polymorphisms (SNP); high-throughput sequencing together with modern genotyping platforms capable of processing many samples for many markers in a single analysis, enabling the inclusion of genomic information in breeding schemes.
Most quantitative traits are controlled by several genes and suffer action from the environment. However, with the strides of molecular technology and statistical tools, it has been demonstrated that some of these traits are controlled by few genes, hence their individual effect can be detected. Thus the term quantitative trait loci (QTL) was used to describe the regions that affect a continuous trait, but where the actual gene is unknown (De Koning, 1999). Thus, the efforts of researchers in recent years has been based on identifying specific QTL through analysis of the association between markers and phenotypes in order to find genes with significant effect, explaining a considerable fraction of genetic variance.
It has been estimated that there are many millions of SNPs throughout the genome (Hinds et al., 2005), and the advent of DNA chip technology has made the genotyping of many animals for many of these markers feasible. Hence, it is possible to saturate with markers specific chromosomal regions that are already known to have QTL and fine map them, detecting more accurately the regions where they are located.
2 trait across all families (Meuwissen et al., 2001). Statistical methods have been developed to estimate marker effects and then the localization of significant markers on the genome can be identified.
Quantitative trait loci (QTL)
Animal breeders have been manipulating quantitative traits by selection using estimates of breeding values based on phenotypic observations of the animal itself or of their relatives. The genetic component of variation has been modeled assuming a large number of genes of small effects, named the infinitesimal model (Falconer & Mackay, 1996). This model is attractive as it facilitates simple statistical descriptions of inheritance. The mapping of a small number of genes of large effects led to a model of inheritance of quantitative traits with many genes of small effect and few genes of large effect (Hayes & Goddard, 2001).
QTL are defined as significant statistical associations between genotypic and phenotypic variation among the segregating progeny (William, 1998). Usually, it is not possible to determine whether the effect detected with the marker is due to one or more genes linked to the trait. For this reason, the term QTL is used to describe the region of the chromosome that has one or more genes influencing the phenotypic manifestation of the trait (Bearzoti, 2000). The linkage between a genetic marker and QTL was first demonstrated by Sax (1923). However, the fundamentals of the theory of QTL mapping have been understood from the work of Thoday (1961). This author suggested that if one or more genes responsible for a trait are linked to a marker, the effects of these genes can be studied indirectly based on the marker genotypes.
Trials using QTL mapping are conducted with three basic objectives: 1) locating genes responsible for genetic variation in economically important phenotypes, to be used as a starting point for marker-assisted selection in animal and plant breeding; 2) in the long term, perform molecular cloning of genes for specific phenotypes; and 3) to answer basic questions about evolutionary processes (Paterson, 1998a).
3 QTL genotype is more efficient if the marker is strongly linked to the genomic region of interest.
Single nucleotide polymorphism (SNP)
As the Human Genome Project (HGP) progressed and the nucleotide sequence of the human genome was being unveiled, an evident finding was the large number of point variations found when corresponding segments of the genome were compared. Even before the first draft of the complete sequence become available, a large portion of the scientific community had turned its attention to these small and abundant variations scattered throughout the genetic code.
These variations, which are the most frequent type found in DNA, are called SNPs and they are valuable markers for high-throughput genetic mapping, genetic variation studies and association mapping. SNPs are single base pair positions in genomic DNA at which a change of alternative alleles occurs between members of the same species or paired chromosomes in an individual. When the mutation presents an abundance of the least frequent allele of 1% or more in the population evaluated, it is referred to as a single nucleotide polymorphism (Brookes, 1999). In principle, SNP markers could be bi-, tri- or tetra-allelic polymorphisms. Nevertheless, most of the SNP markers are bi-allelic. It is rare to find tri- or tetra-allelic markers because of the low probability of two independent base changes occurring at a single position (Vignal et al., 2002)
4 In general, SNPs can be found much less frequently in coding regions of the genome than in noncoding regions (Caetano, 2009). SNPs in noncoding regions, whilst they do not alter encoded proteins, serve as important genetic or physical markers for comparative or evolutionary genomic studies (Kim & Misra, 2007). Transitions are the most frequent substitutions that occur in DNA which consist of exchanges between two purines (A/G or G/A) or two pyrimidines (C/T or T/C). Less frequent, transversions are substitutions of a purine for a pyrimidine or vice versa (Brookes, 1999).
The development of SNP markers has automated and enhanced the effectiveness of genotype analysis. Thus, it is possible to genotype hundreds of thousands of individuals for several thousand SNP markers in a few hours (Williams, 2005). The high-density SNP-Chips enabled the generation of new applications that will bring significant advances to animal breeding programs.
Fine mapping
Fine mapping plays a crucial role in the intermediate steps during the search for genomic regions associated with traits of economic interest. Usually, in previous genome scans, large regions (20-30 cM) are linked to a QTL. However these are too large and do not allow accurate gene identification hence the interval where the QTL was located must be narrowed.
Recently, there has been a great improvement in genome sequencing techniques in both speed and cost effectiveness (von Bubnoff, 2008). This means that the most promising genes in the regions can be sequenced in animals that are most likely heterozygous for the QTL. This sequencing effort will result in a large number of additional SNPs detected within the QTL region. Furthermore, as the sequencing is focused on the most promising genes, the causative SNP might be amongst the detected SNPs (Uleberg & Meuwissen, 2010).
marker-5 assisted selection, as a result of undesirable effects associated with genes closely linked to the target gene; difficulty in molecular cloning of the gene(s) underlying a specific QTL, especially in species in which the gene density along the chromosomes is very high.
Fine mapping is performed to overcome all these obstacles, which consists of saturating a region previously identified by various markers to identify haplotypes or small blocks that are in linkage disequilibrium.
QTL identification needs to be as accurate as possible to enable the implementation of later steps of identifying the gene and the causative mutation. The larger the confidence interval of a QTL the harder to find genes associated with it. Therefore, fine mapping should be carried out the best way possible, aiming to utilize all available data of the population under study.
Genome wide selection (GWS)
An important aspect of molecular genetics for the benefit of applied animal breeding is the direct use of DNA information in the selection to allow higher selective efficiency, greater speed in obtaining genetic gains and lower costs, in comparison to traditional selection based on phenotypic data (Resende et al., 2008).
From the beginning of the century, biotechnological advances in the automation of the genotyping process, which started to be done on a large scale, allowed the development of new marker classes, among which it is possible to highlight the SNPs. Given the abundance of these markers, Meuwissen et al. (2001) devised the genome wide selection (GWS), which consists of analyzing a large number of markers widely distributed throughout the genome.
6 with the genotyping process, which has become more efficient, it is possible, by many statistical tools, to estimate the effects for each marker. Seeing that with a dense marker map, some markers will be very close to the QTL and probably in linkage disequilibrium with it, thereby selection based on these markers can be made without the need to establish the linkage phase in each family.
Bayesian LASSO
Bayesian regression (Meuwissen et al., 2001) has been used to solve multicollinearity problems and may also be used in situations where there are more markers (covariates) than observations, assigning a priori distribution to the regression coefficients. An interesting approach is the use of the LASSO (Least Absolute Shrinkage and Selection Operator) regression method, which combines good features of subset-selection (i.e., variable selection) and regularization via shrinkage of the regression coefficients. This method was applied in GWS by de los Campos et al. (2009) and ever since, the success of this methodology has been reported by de los Campos et al. (2009) and Mutshinda & Sillanpää (2010).
A general linear regression model under a LASSO approach, as proposed by de los Campos et al. (2009), can be given by:
.
Where: is a phenotype measured on the individual i (i=1,2,…,n), is the mean of the studied trait; are covariates (SNPs genotypes) assigned to the individual i to be treated by Bayesian LASSO; is the Bayesian LASSO vector of regression coefficients (SNPs effects); and ei is the random residual of the
model, .
7 Where, is the sum of the absolute values of the regression coefficients contained in the vector, so that solutions in which the regression coefficients deviate from zero suffer a penalty, whose intensity is controlled by the regularization parameter . When the latter parameter is zero, there is no regularization. In Bayesian LASSO, the execution of this kind of regularization involves a stronger shrinkage in the sense that some regression coefficients have values equal to zero.
In summary, the prior distribution assumed for regression coefficients
regularized by LASSO (de los Campos et al. 2009) is: . This assumption results in specific variance ( ) for each j SNP effect, that is
In turn, the prior distribution for the scale parameter is:
, in which the regularization parameter influences the adjustment of the regression coefficients. The prior information for is given by distributions, widely Gamma or Beta, with known hyper parameters. When Gamma distribution is chosen, samples can be obtained from the joint posterior
distribution via the Gibbs sampler, and when Beta distribution is chosen, these samples must be obtained by the Metropolis-Hastings algorithm.
Objectives
8 REFERENCES
Bearzoti, E. Mapeamento de QTL. In: Pinheiro, J. B. Análise de QTL no Melhoramento de Plantas. Goiânia: FUNAPE, p.63-223, 2000.
Brookes, A. J. The essence of SNPs. Gene, 234, p.177-186, 1999.
Caetano, A. R. Marcadores SNP: conceitos básicos, aplicações no manejo e no melhoramento animal e perspectivas para o futuro.R. Bras. Zootec., v.38, p.64-71 (supl. especial), 2009.
Collins, F. S., Brooks, L. D., Chakravarti, A., Collins, F. S., Brooks, L. D., Chakravarti, A. A DNA polymorphism discovery resource for research on human genetic variation. Genome Research, p.1229-1231, 1998.
De Koning, D-J. Identification of (non-) Mendelian factors affecting pork production. Doctoral thesis, Wageningen University, The Netherlands, 1999.
Fahrenkrug, S. C., Freking, B. A., Smith, T. P. L., Rohrer, G. A., Keele, J. W. Single nucleotide polymorphism (SNP) discovery in porcine expressed genes. Anim. Genet., 33, p.186-195, 2002.
Falconer, D. S. & Mackay, T. F. C. Introduction to quantitative genetics. 4.ed. Edinburgh, Longman, p.464, 1996.
Goddard, M. E. & Hayes, B. J. Genomic selection. J. Anim. Breed. Genet., 124, p.323-330, 2007.
Hayes, B. J. & Goddard, M. E. The distribution of the effects of genes affecting quantitative traits in livestock. Genet. Sel. Evol., 33, p.209-229, 2001.
Hinds, D. A., Stuve, L. L., Nilsen, G. B., Halperin, E., Eskin, E., Ballinger, D. G., Frazer, K. A., Cox, D. R. Whole-genome patterns of common DNA variation in three human populations. Science, 307, p.1072-1079, 2005.
Kim, S. & Misra, A. SNP genotyping: technologies and biomedical applications.
Annual review of biomedical engineering, 9, p. 289-320, 2007.
Meuwissen, T. H., Hayes, B. J., & Goddard, M. E. Prediction of total genetic value using genome-wide dense marker maps. Genetics, 157, p.1819-1829, 2001.
9 Paterson, A.H. Of blending, beans, and bristles: the foundations of QTL
mapping. In: Paterson, A.H. Molecular dissection of complex traits. New York, CRC Press, p.1-10, 1998a
Paterson, A.H. QTL mapping in DNA marker-assisted plant and animal improvement. In: Paterson, A.H. Molecular dissection of complex traits. New York, CRC Press, p.131-143, 1998b.
Resende, M. D. V., Lopes, P. S., Silva, R. L., Pires, I. E. Seleção genômica ampla (GWS) e maximização da eficiência do melhoramento genético,
Pesquisa Florestal Brasileira, 56, p.63-77, 2008.
Uleberg, E. & Meuwissen, T. H. E. Fine mapping and detection of the causative mutation underlying Quantitative Trait Loci. J. Anim. Breed. Genet., 127, p.404-10, 2010.
Sax, K. The association of size differences with seed-coat pattern and pigmentation in Phaseolus vulgaris. Genetics, 8, p.552-560, 1923.
Thoday, J. M. Location of polygenes. Nature, 191, p.368-370, 1961.
Vignal, A., Milan, D., SanCristobal, M., Eggen, A. A review on SNP and other types of molecular markers and their use in animal genetics. Genet. Sel. Evol., 34, p. 275-305, 2002.
Von Bubnoff, A. Analysis next-generation sequencing: the race is on. Cell, p.721-723, 2008.
Weiner, M. P. & Hudson, T. J. Introduction to SNPs: discovery of markers for disease. BioTechniques, Suppl(43), p.4-7, 10, 12-3, 2002.
William, D. B. QTL analysis: Power, Precision, and Accuracy. In: Paterson, A.H.
Molecular dissection of complex traits. New York, CRC Press, p.142-162, 1998.
10
Chapter 2
FINE MAPPING AND SINGLE NUCLEOTIDE POLYMORPHISM EFFECTS ESTIMATION ON PIG CHROMOSOMES 1, 4, 7, 8, 17 AND X
A. M. Hidalgo1, P. S. Lopes1, D. M. Paixão1, F. F. Silva2, S. R. Paiva3, S. E. F.
Guimarães1
1
Departamento de Zootecnia, Universidade Federal de Viçosa, Viçosa, Brazil
2
Departamento de Estatística, Universidade Federal de Viçosa, Viçosa, Brazil
3
Embrapa Recursos Genéticos e Biotecnologia (CENARGEN), Brasília, Brazil
Keywords
Bayesian LASSO; Piau breed; pig genetics; QTL.
Correspondence
S. E. F. Guimarães, Departamento de Zootecnia, Universidade Federal de Viçosa,
Viçosa, Brazil – Av. PH Rolfs, s/n, 36570-000. Tel. (+55) 3138992273; Fax (+55)
11 Summary
In order to detect quantitative trait loci (QTL) with a narrower confidence interval than previous studies, a fine mapping study was performed on pig chromosomes 1, 4, 7, 8, 17 and X to determine their association with performance, carcass, internal organs, cut yields and meat quality traits. Fifty families were used of a F2 population produced by crossing naturalized Brazilian Piau boars with commercial sows. The linkage map consisted of 237 SNP and 37 microsatellites markers. QTL were identified by regression interval mapping using the GridQTL software. Individual marker effects were estimated by Bayesian LASSO regression using the R software. In total, 32 QTL for the studied traits were significant at the 5% chromosome-wide level, including 12 QTL significant at the 1% chromosome-wide level and 7 significant at the 5% genome-wide level. All QTL with genome-wide significance had markers of large effect within their confidence interval. These results confirmed some previous QTL and identified numerous novel QTL for the investigated traits. Our results showed that the use of microsatellites along with SNP markers increasing the saturation of the genome led to QTL of smaller confidence intervals. The methods used were also valuable to estimate the marker effects and to locate the most expressive markers within the QTL confidence interval, validating those QTL found by the regression method.
Introduction
12 Previous studies from our research group using the same population and microsatellites markers were conducted for QTL detection. Many QTL were found by Paixão et al. (2008), Silva et al. (2009), Paixão (2010) and Sousa et al. (2011), but as their mapping studies used only microsatellite markers, sparse genetic maps were generated, leading to detections with low accuracy due to large confidence intervals. Hence, SNP markers, can be used on fine mapping chromosomal regions from the previous studies, narrowing the QTL confidence interval.
With the genome wide selection (GWS), many statistical methods have been applied to estimate the effects of each marker, including the LASSO (Least Absolute Shrinkage and Selection Operator) regression method which combines good features of variable selection and regularization via shrinkage of the regression coefficients (de los Campos et al., 2009). QTL studies have been based on identifying specific QTL by analyzing the association between markers and phenotypes to find genes with significant effect. However, with the development of GWS, that estimates marker effects, a different approach can be used. Instead of genes, it is possible to verify whether the markers with the most expressive effects are within the confidence interval of the QTL previously found.
Therefore, the objective of this investigation was to fine map, in order to detect QTL, chromosomes one (SSC 1), four (SSC 4), seven (SSC 7), eight (SSC 8), seventeen (SSC 17) and X (SSC X), using microsatellite and SNP markers, in an F2 population produced by crossing naturalized Piau boars and commercial females (Landrace x Large White x Pietrain) associated with performance, carcass, internal organs, cut yields and meat quality traits. A further objective was to estimate the effects of SNP markers on traits with detected QTL, analyze the most expressive ones and check whether they were located within the QTL confidence interval.
Material and Methods
Experimental population and phenotypic data
13 de Viçosa (UFV), MG, Brazil. The formation of 50 families and collection of phenotypic data were carried out on the Pig Breeding Farm, UFV, from November 1998 to July 2001.
A three-generation resource population was created and managed as described by Band et al. (2005a). Briefly, two naturalized Piau breed grandsires were crossed with eighteen granddams, composed of Large White, Landrace and Pietrain breeds, producing the F1 generation from which 11 F1 sires and 54 F1 dams were selected. These F1 individuals were crossed producing the F2 population.
The Piau breed is considered an important Brazilian naturalized breed. These fat-type pigs were bred to achieve a dual purpose animal, i.e., meat and fat. Moreover, they are rustic require little management.
The phenotypic traits were divided into: performance, carcass, internal organs, cut yields and meat quality traits, totalizing 54 traits. A full description of the phenotype measurements can be found in Band et al.(2005a, b).
DNA extraction, SNP selection and genotyping
DNA was extracted at the Animal Biotechnology Laboratory of the Department of Animal Science at the Universidade Federal de Viçosa. Genomic DNA was extracted from white cells of parental, F1 and F2 animals. The DNA extraction procedures can be found in Band et al. (2005 b).
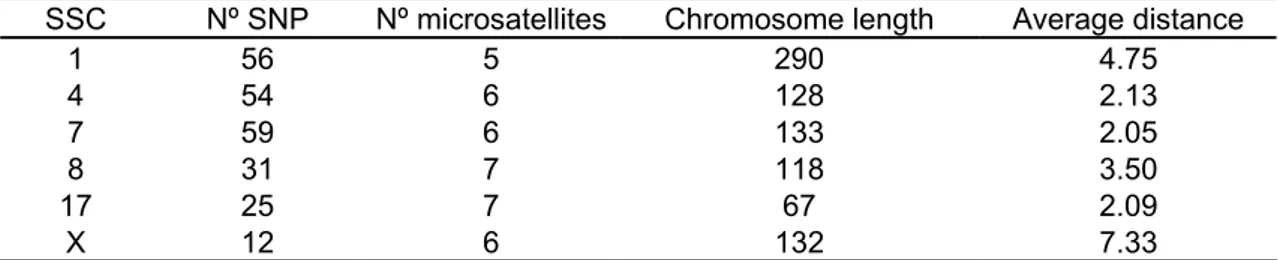
14 Beadchip. Thirty seven primer pairs for microsatellite markers distributed on these chromosomes were also used (Table 1). These microsatellite marker data were available from other studies (Paixão et al., 2008; Silva et al., 2008; Paixão, 2010; Sousa et al., 2011).
Table 1 Number of SNP and microsatellite markers, chromosome length (cM)
and average distance between markers (cM) in Sus scrofa chromosomes 1, 4, 7, 8, 17 and X.
SSC Nº SNP Nº microsatellites Chromosome length Average distance
1 56 5 290 4.75
4 54 6 128 2.13
7 59 6 133 2.05
8 31 7 118 3.50
17 25 7 67 2.09
X 12 6 132 7.33
Statistical analysis
The position and order from the Illumina PorcineSNP60 Beadchip were used for the SNPs physical map. Genetic distance between markers was extrapolated on physical distance (1Mb = 1cM). The resulting genotypic and phenotypic files and maps were analyzed by the GridQTL software (Seaton et al., 2006).
The statistical model used assumes that the putative QTL is di-allelic with alternative alleles fixed on each parental breed. The probability that each F2 individual presents each of the three QTL genotypes was calculated according to the genotype of the markers at 1 cM intervals along the chromosome. These probabilities were used for regression of the traits on additive and dominance coefficients of the QTL studied for each animal, as described by Haley et al. (1994).
Chromosome-wide significance thresholds (α = 0.05 and α = 0.01) were determined by the GridQTL software, with 10,000 permutations per test (Churchill & Doerge, 1994). The genome-wide significance threshold (α = 0.05 and α = 0.01) was obtained using Bonferroni’s correction (Knott et al., 1998). The 95% confidence interval (95% CI) for localization of the QTL was calculated using the chi-square approximation (χ2) as described by Pérez-Enciso et al. (2000).
15 yijkl = Si + Lj + Hk + (Cijkl - )b + caa + cdd + eijkl
where yijk = phenotype; Si = fixed effect of sex i, i = 1 (barrows), 2 (female); Lj =
fixed effect of batch j, j = 1, 2, 3, 4, 5; Hk = fixed effect of the halothane
genotype k, k = 1 (NN), 2 (Nn); (Cijk - )b = adjustment for covariates; ca =
P(QQ/Mi) - P(qq/Mi); cd = P(Qq/Mi); eijkl = residual errors.
The halothane genotype was included as a fixed effect since Band et al. (2005 a, b) reported significant effects of the Hal1843 mutation on performance, carcass and meat quality traits in this population. Carcass weight at slaughter was used as a covariate for carcass and organ traits, age at slaughter was used for meat quality traits. Among performance traits, litter size at birth was used as a covariate for birth weight, litter size at weaning was used for weight at 21, 42, 63, 77, 105 days and slaughter weight, weight at 77 days was used as covariate for the feed-gain ratio, feed intake and average daily gain.
An F ratio was calculated at each position, comparing the model with a QTL to the equivalent model without QTL. Estimates for a and d were calculated at the best estimated position with the highest F-ratio. The additive fraction of phenotypic variance (h2Q) in the F2 generation explained by a given
QTL was computed according to Pérez-Enciso et al. (2000). The conditional probability functions of the QTL given the genotype of the markers (ca and cd)
were estimated according to Haley et al. (1994).
In order to estimate the SNPs effects, Bayesian regression (Meuwissen et al., 2001) was used to solve multicollinearity problems and may also be used in situations where there are more markers (covariates) than observations, but it was not our case. An interesting approach is the use of the LASSO (Least Absolute Shrinkage and Selection Operator) regression method, which combines good features of subset-selection (i.e., variable selection) and regularization via shrinkage of the regression coefficients. This method was applied in GWS by de los Campos et al. (2009) and ever since, the success of this methodology has been reported by de los Campos et al. (2009) and Mutshinda & Sillanpää (2010).
16 where: is the phenotype vector, 1 is the vector of the same dimension as with all entries equal to , is the mean of the studied trait, is the vector with additive effects of different SNP markers, is the incidence matrix that relates marker effects to phenotypes contained in , and is the residual vector of the model.
Under this mentioned Bayesian approach, the marker effect estimates ( ) are given by the mean of the posterior distributions of each marker effect. These estimates and the mean were obtained using the BLR package (Bayesian Linear Regression) available in the R software (R Development Core Team, 2011). The Bayesian implementation of LASSO regression contained in this package was adapted for genomic selection by de los Campos et al. (2009).
The 5% most expressive SNPs were obtained from an empirical distribution of SNPs effect absolute values that allowed the identification of markers with larger effects and thus located them on the chromosomes.
The analyses of the Markov chains were set to 50,000 iterations, the burn-in period was 10,000 iterations and the sampling interval was 1, so that a total of 50,000 samples was kept from each chain. The convergence of the chains was tested by the Geweke diagnostic, available in the BOA package (Bayesian Output Analysis, Smith, 2007), implemented in the R software. At the 1% significance level, only four out of 32 QTL analyzed chains did not converge.
Results
QTL analysis
17 QTL associated with cut yields and eight QTL for carcass traits. The detected QTL were distributed over all studied chromosomes.
Performance traits. Six QTL were located on SSC 1 and 17. Two of the six QTL were significant at the 1% chromosome-wide level (BW on SSC 17 and W77). QTL that were detected on SSC 1 explained 5.03 and 8.72% of the phenotypic variance, respectively, for SA and BW. On SSC 17, the percentages of phenotypic variance explained by the other four QTL were lower, ranging from 0.42 to 2.68%.
Meat quality traits. All six QTL found in this study were significant at the 5% chromosome-wide level. The detected QTL were located on most of the evaluated chromosomes, except for SSC 8. The percentages of phenotypic variance explained by DL, CL, SF and pH24 QTL were lower, ranging from 0.04 to 1.41, than the percentages explained by QTL affecting A (3.30).
Internal organ traits. The QTL detected were located along SSC 4, 8 and X. Three of the five detected QTL (HEART, SIL on SSC8 and LIVER) were significant at the 1% chromosome-wide level and one (LUNG) was significant at the 5% genome-wide level. The QTL associated with LUNG were the most significant and explained a larger percentage of phenotypic variance (6.54) than the other four QTL (ranging from 3.40 to 3.90).
Cut yields traits. Only the QTL affecting AF on SSC 8 was significant at the 5% genome-wide level. The SSC X presented five of the seven QTL associated with cut yields, most of the them explained between 3 and 4% of the phenotypic variance, while the one affecting BCW explained 5.61%.
Carcass traits. The QTL were located on chromosomes 1, 4, 7 and 8 and five of the eight were significant at the 5% genome-wide level. The QTL affecting carcass traits explained from 2.45 to 7.30% of the phenotypic variance, highlighting the one associated with L on SSC 8 that explained 7.30%.
Confidence interval
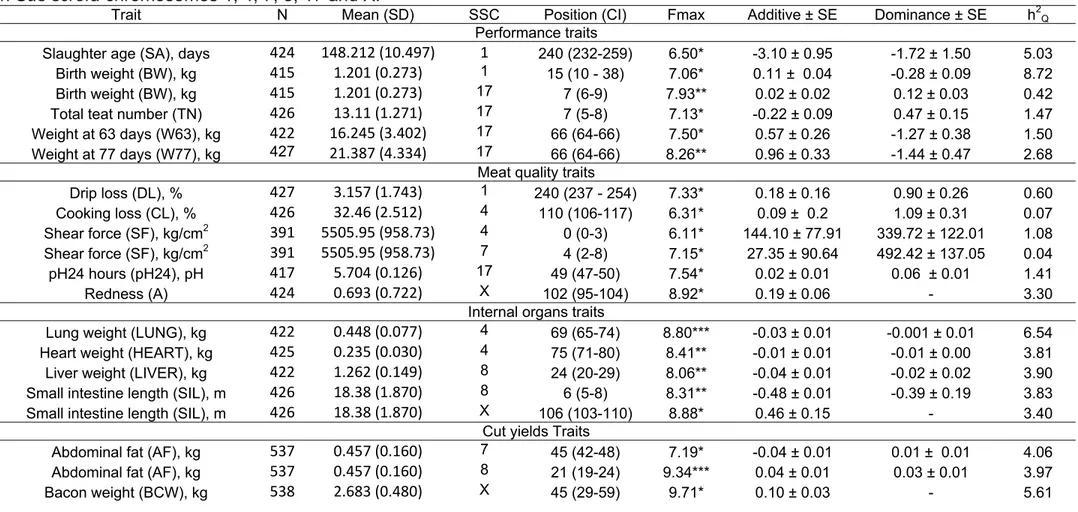
Table 2 Evidence for QTL significant at the 5% chromosome-wide level for various traits. Number of animals analyzed for each trait (N), phenotypic mean (standard deviation), location, confidence interval at 95% confidence level (CI), maximum F statistics (Fmax), estimates of additive and dominance effects, standard errors (SE) and % of F2 variance explained by each QTL (h2Q) for significant traits on Sus scrofa chromosomes 1, 4, 7, 8, 17 and X.
Trait N Mean (SD) SSC Position (CI) Fmax Additive ± SE Dominance ± SE h2Q
Performance traits
Slaughter age (SA), days 424 148.212 (10.497) 1 240 (232-259) 6.50* -3.10 ± 0.95 -1.72 ± 1.50 5.03
Birth weight (BW), kg 415 1.201 (0.273) 1 15 (10 - 38) 7.06* 0.11 ± 0.04 -0.28 ± 0.09 8.72
Birth weight (BW), kg 415 1.201 (0.273) 17 7 (6-9) 7.93** 0.02 ± 0.02 0.12 ± 0.03 0.42
Total teat number (TN) 426 13.11 (1.271) 17 7 (5-8) 7.13* -0.22 ± 0.09 0.47 ± 0.15 1.47
Weight at 63 days (W63), kg 422 16.245 (3.402) 17 66 (64-66) 7.50* 0.57 ± 0.26 -1.27 ± 0.38 1.50
Weight at 77 days (W77), kg 427 21.387 (4.334) 17 66 (64-66) 8.26** 0.96 ± 0.33 -1.44 ± 0.47 2.68
Meat quality traits
Drip loss (DL), % 427 3.157 (1.743) 1 240 (237 - 254) 7.33* 0.18 ± 0.16 0.90 ± 0.26 0.60
Cooking loss (CL), % 426 32.46 (2.512) 4 110 (106-117) 6.31* 0.09 ± 0.2 1.09 ± 0.31 0.07
Shear force (SF), kg/cm2 391 5505.95 (958.73) 4 0 (0-3) 6.11* 144.10 ± 77.91 339.72 ± 122.01 1.08
Shear force (SF), kg/cm2 391 5505.95 (958.73) 7 4 (2-8) 7.15* 27.35 ± 90.64 492.42 ± 137.05 0.04
pH24 hours (pH24), pH 417 5.704 (0.126) 17 49 (47-50) 7.54* 0.02 ± 0.01 0.06 ± 0.01 1.41
Redness (A) 424 0.693 (0.722) X 102 (95-104) 8.92* 0.19 ± 0.06 - 3.30
Internal organs traits
Lung weight (LUNG), kg 422 0.448 (0.077) 4 69 (65-74) 8.80*** -0.03 ± 0.01 -0.001 ± 0.01 6.54
Heart weight (HEART), kg 425 0.235 (0.030) 4 75 (71-80) 8.41** -0.01 ± 0.01 -0.01 ± 0.00 3.81
Liver weight (LIVER), kg 422 1.262 (0.149) 8 24 (20-29) 8.06** -0.04 ± 0.01 -0.02 ± 0.02 3.90
Small intestine length (SIL), m 426 18.38 (1.870) 8 6 (5-8) 8.31** -0.48 ± 0.01 -0.39 ± 0.19 3.83
Small intestine length (SIL), m 426 18.38 (1.870) X 106 (103-110) 8.88* 0.46 ± 0.15 - 3.40
Cut yields Traits
Abdominal fat (AF), kg 537 0.457 (0.160) 7 45 (42-48) 7.19* -0.04 ± 0.01 0.01 ± 0.01 4.06
Abdominal fat (AF), kg 537 0.457 (0.160) 8 21 (19-24) 9.34*** 0.04 ± 0.01 0.03 ± 0.01 3.97
Boneless loin weight (LW), kg 535 1.022 (0.183) X 89 (62-102) 8.10* -0.04 ± 0.02 - 4.82
Skinless and fatless HW (HW)1, kg 538 4.998 (0.631) X 99 (86-102) 8.65* -0.10 ± 0.03 - 3.42
Total boston SW (TBSW)2, kg 537 2.326 (0.339) X 117 (108-124) 9.38* 0.05 ± 0.02 - 4.16
Skinless and fatless SW (BSW)3, kg 538 1.679 (0.265) X 132 (129-132) 10.64* 0.06 ± 0.02 - 4.04
Carcass traits
Loin eye area (LEA), cm2 390 26.43 (4.034) 1 200 (198-210) 8.70*** 1.13 ± 0.27 0.02 ± 0.44 5.60
Backfat L (L)4, mm 425 23.23 (6.110) 4 99 (94-104) 7.16* 1.68 ± 0.45 -0.01 ± 0.69 4.97
Carcass length MBCC (MBCC)5, cm 425 86.01 (4.139) 7 44 (41-49) 9.68*** 1.12 ± 0.26 -0.58 ± 0.37 6.01
Carcass length MLC (MLC)6, cm 424 71.64 (3.421) 7 47 (42-50) 9.17*** 0.93 ± 0.22 -0.31 ± 0.31 6.34
Backfat SBT (SBT)7, mm 426 40.57 (5.607) 8 10 (9-15) 9.13*** 1.46 ± 0.41 1.06 ± 0.57 4.55
Backfat L (L)4, mm 425 23.23 (6.110) 8 15 (12-20) 9.69*** 2.04 ± 0.47 -0.09 ± 0.65 7.30
Backfat LL (LL)8, mm 425 28.34 (5.902) 8 15 (11-21) 6.90* 1.69 ± 0.46 -0.05 ± 0.65 5.23
Backfat LR (LR)9, mm 427 19.61 (4.819) 8 21 (16-24) 6.87* 0.95 ± 0.36 0.96 ± 0.51 2.45
*, ** and *** significant at the 5% chromosome-wide level, 1% chromosome-wide level, and at the 5% genome-wide level, respectively; Positive additive effects indicate that Piau alleles increased the trait and negative, that commercial alleles increased it;
1
HW, skinless and fatless ham weight; 2TBSW, total Boston shoulder weight; 3BSW, skinless and fatless Boston shoulder weight; 4L, midline lower backfat thickness
above the last lumbar vertebrae; 5MBCC, carcass length by the Brazilian carcass classification method; 6MLC, carcass length by the American carcass classification
method; 7SBT, higher backfat thickness on the shoulder region; 8LL, midline backfat thickness between last and next to last lumbar vertebrae; 9LR, midline backfat
20
Markers with most expressive effects
In eleven of the 32 detected QTL, at least one marker with the most expressive effect was located within the QTL confidence interval. Six of the seven QTL that were significant at the 5% genome-wide level presented a marker with the most expressive effect within the QTL confidence interval. The QTL affecting CL, LUNG, HEART, AF on SSC 7, BCW, MBCC and L on SSC 8 presented one SNP marker with the most expressive effect located within the QTL confidence interval. The markers name and their position were: ALGA0028623 (115 cM), ALGA0025795 (70 cM), ALGA0026242 (80 cM), ALGA0040948 (46 cM), ALGA0099944 (55 cM), ALGA0040937 (45 cM) and ALGA0047440 (15 cM), respectively, for each QTL.
A further four QTL presented two markers with most expressive effect located within their confidence interval. The QTL affecting AF on SSC 8 presented the markers ALGA0047813 (20 cM) and ALGA0047819 (20.5 cM), the QTL associated with LEA had the markers ALGA0008230 (200 cM) and ALGA0008558 (210 cM) within its confidence interval. The QTL affecting MLC presented ALGA0040948 (46 cM) and ALGA0041266 (50 cM) and the QTL associated with SBT presented the markers ALGA0047003 (10.2 cM) and ALGA0047008 (10.4 cM).
Discussion
21 Performance traits. A QTL affecting SA on SSC 1 was detected at 240 cM, on the same chromosome Paixão (2010) also found a QTL associated with this trait, but it was located at a different position. QTL associated with W63 and W77 on SSC 17 were reported by Paixão et al. (2008) using the same F2 population and microsatellites markers. The QTL associated with W63 were found at different positions, on the other hand, the QTL for W77 were flanked by the S0359 and SW2427 microsatellite markers in both studies, confirming the QTL. As their study did not present confidence intervals, no inference can be made. QTL for W63 and W77 were detected at the same position on SSC 17 presenting a narrow confidence interval (2 cM), reinforcing the idea that they are controlled by the same genes. A QTL affecting BW was found on SSC 1 and 17, the latter has not been reported before in other pig resource populations. However on SSC 1 the QTL was reported previously by Knot et al. (1998) and Beeckmann et al. (2003), all located at the initial portion of the chromosome. One QTL associated with TN was detected at the 7 cM position on SSC 17, another QTL associated with the same trait has been already reported (Guo et al., 2008), but its location was different (35.2 cM). The additive effect (0.22) for the QTL related to TN was linked to commercial breed alleles, which was expected in view of the higher number of piglets per litter in these breeds. The additive effects of the Piau alleles on weight traits (BW, W63 and W77) characterized cryptic effects, since it was expected that commercial alleles would increase the weight of the animals. This effect was also noted for commercial alleles for SA. Other studies on pigs (Yue et al., 2003) and even on different species (Abasht et al., 2006) have also presented this allelic effect. Cryptic QTL alleles show trait effects that are in the opposite direction of what would be expected according to the mean phenotypic difference between the crossed populations (Abasht et al. 2006), suggesting that the trait is controlled by several chromosomal regions in the genome.
Große-22 Brinkhaus et al. (2010) also found a QTL for this trait, but it was located in different regions. A QTL associated with SF was detected on SSC 4 and had not been reported before in the consulted literature. Another QTL also affecting the SF was detected at the initial portion of the SSC 7, Edwards et al. (2008) found it in a different region. The QTL associated with pH24 on SSC 17 was mapped in a different region to the suggestive QTL position found by Wimmers et al. (2007). A QTL affecting A was detected on SSC X (102 cM), Paixão (2010) also reported the same QTL using the same population and microsatellite markers, since both QTL were located between the SW1943 and S0218 microsatellite markers. As we used more markers, our confidence interval was smaller (9 cM) than theirs (33 cM), allowing more accurate detection. With respect to additive effect for meat quality traits, for both QTL associated with SF, and for the QTL affecting pH24 and A, the Piau alleles were related to an increase in these traits, following the phenotypic means of the population, in which the traits in question were higher for the Piau than for the commercial breed. However, the QTL associated with DL and CL presented cryptic effects of the Piau alleles suggesting that these traits are controlled by several chromosomal regions along the genome. Detection of additional loci controlling CL on other chromosomes on the same population under study presented commercial alleles increasing the values for CL on SSC 16 (Paixão et al., 2008), reinforcing the existence of cryptic effects.
Internal organ traits. Significant QTL alleles were mainly additive (a >
23 reported by Knot et al. (1998) and Gao et al. (2010), Sousa et al. (2011), but none of them were located near to the region that the QTL in our study was mapped. The commercial alleles were associated with longer SIL on SSC 8, supporting the idea that the small intestine length increased in response to selection and domestication. However, on SSC X, the Piau alleles were associated with longer SIL, which was the opposite of the expected according to the breed characteristics and the observations at the other QTL detected in this study. As the SIL is important in the individual growth process, possibly by influencing the pig´s absorption efficiency and digestion (Gao et al., 2010), it was expected that commercial alleles would have an additive effect. This conflicting allelic effect was also reported by Gao et al. (2010), using a White Duroc X Chinese Erhualian intercross resource population. Unexpectedly, they estimated additive effects related to both breeds on different chromosomes, studying the same trait (SIL), while the expected was to be related only to the White Duroc breed.
24 a QTL affecting the same trait in the same region. For HW, the QTL mapped was located at 99 cM on SSC X. Likewise, Cepica et al. (2003) found a QTL in a similar region. Milan et al. (2002) detected QTL for the same trait but in different positions. Conversely, for the two QTL found previously (AF and BCW), the additive effect of the QTL related to LW and HW implied that the commercial breed alleles result in an increase in these traits, which was expected as the commercial animals are bred for leaner carcasses than the Piau breed. On SSC X, a QTL was identified affecting BSW and TBSW. Milan et al. (2002) detected a QTL affecting BSW in the region. Regarding TBSW, Cepica et al. (2003) identified QTL for this trait, but in a different position. The additive effect for BSW and TBSW on SSC X was linked to Piau alleles that can be considered cryptic alleles, as these are traits related to meat weight. Previous studies, in the same population reported commercial alleles influencing these traits on SSC 4, as expected (Silva et al., 2008).
25 affecting MBCC and MLC were detected in a very close position, with a very narrow confidence interval and significant at the 5% genome-wide level. As these traits are very similar and there is only a shift in the calculation method, the same gene probably controls both of them. Piau alleles were associated with MBCC and MLC, this result was in disagreement with the phenotypic mean of the population and characterized cryptic alleles, since the expected greater carcass length should be related to the commercial breed. On SSC 8 a 5% genome-wide level significant QTL was detected for L explaining 7.30% of the phenotypic variance. Sousa et al. (2011) found a QTL for L flanked by the SW905 and S0017 markers, the same that flanked our QTL, confirming this QTL. As expected, our study presented a narrower confidence interval in relation to theirs due the higher number of markers used. Also on SSC 8, QTL for SBT, LL and LR were detected, and no QTL for these traits has been reported before in other pig populations. In relation to the estimated additive effect for these backfat traits on SSC 4 and 8, on all of them, Piau alleles would cause an increase in the backfat thickness as expected, because the Piau breed is known as a fatty breed.
26 linkage disequilibrium between marker and QTL was stronger than in studies with few microsatellites and because they were very close to the QTL, the confidence interval of the detected QTL was much smaller compared to the previous studies in our population using only microsatellite markers. For instance, the confidence interval for the QTL that were the same in our study compared to previous studies in the same population were on average 23.67 cM smaller. These results from marker effects corroborated with those QTL found by the GridQTL software, using the regression method (Haley et al., 1994)
In summary, with the development of SNP chips, more markers can be genotyped and used to estimate marker effects, hence the assumption that they were in linkage disequilibrium with the QTL would be more accurate. It can be concluded that a significant number of QTL associated with several performance, carcass, internal organ, cut yield and meat quality traits exist in a broad region of the pig genome. The addition of more markers and animal genotypes than in previous studies contributed to increasing the statistical power for QTL detection, leading to QTL with smaller confidence intervals. These results confirmed some previous QTL and identified numerous novel QTL for these traits. When estimating the marker with the most expressive effects by the Bayesian approach, they could be located within the QTL confidence interval, validating the QTL found by the regression method and showing that both methodologies can be used jointly.
References
Abasht, B., Dekkers, J. C. M., Lamont, S. J. (2006) Review of quantitative trait loci identified in the chicken. Poult. Sci., 85, 2079-2096.
Band, G. D. O., Guimarães, S. E. F., Lopes, P. S., Schierholt, A. S., Silva, K. M., Pires, A. V., et al. (2005a) Relationship between the Porcine Stress Syndrome gene and pork quality traits of F2 pigs resulting from divergent crosses. Genet. Mol. Biol., 28, 88-91.
27 Beeckmann, P., Moser, G., Bartenschlager, H., Reiner, G., Geldermann, H. (2003) Linkage and QTL mapping for Sus scrofa chromosome 8. J. Anim. Breed. Genet., 120(suppl. 1): 66-73.
Cepica, S., Stratil, A., Kopecny, M., Blazkova, P., Schroffel, J., Davoli, R., et al. (2003) Linkage and QTL mapping for Sus scrofa chromosome 4. J. Anim. Breed. Genet., 120(suppl. 1): 28-37.
Churchill, G. A. & Doerge, R. W. (1994) Empirical threshold values for quantitative trait mapping. Genetics, 138, 963-971.
de los Campos, G., Naya, H., Gianola, D., Crossa, J., Legarra, A., Manfredi, E., et al. (2009) Predicting quantitative traits with regression models for dense molecular markers and pedigree. Genetics, 182, 375-385.
Gao, J., Ren, J., Zhou, L. H., Ren, D. R., Li, L., Xiao, S. J., et al. (2010) A genome scan for quantitative trait loci affecting the length of small intestine in a White Duroc x Chinese Erhualian intercross resource population. J. Anim. Breed. Genet., 127, 119-124.
Grapes, L. & Rothschild, M. F. (2006) Investigation of a QTL region for loin eye area and fatness on pig chromosome 1. Mamm. Genome, 17, 657-668.
Große-Brinkhaus, C., Jonas, E., Buschbell, H., Phatsara, C., Tesfaye, D., Jüngst, H., et al. (2010) Epistatic QTL pairs associated with meat quality and carcass composition traits in a porcine Duroc × Pietrain population. Genet. Sel. Evol., 42, 39.
Guo, Y. M., Lee, G. J., Archibald, L., Haley, C. S. (2008) Quantitative trait loci for production traits in pigs: a combined analysis of two Meishan x Large White populations. Anim. Genet., 39, 486-495.
Haley, C. S., Knott, S. A., Elsen, J. M. (1994) Mapping Quantitative Trait Loci in Crosses Between Outbred Lines Using Least Squares. Genetics, 136, 1195-1207.
Knott, S. A., Marklund, L., Haley, C. S., Andersson, K., Davies, W., Ellegren, H., et al. (1998) Multiple marker mapping of quantitative trait loci in a cross between outbred wild boar and large white pigs. Genetics, 149, 1069-1080.
Malek, M., Dekkers, J. C., Lee, H. K., Baas, T. J., Rothschild, M. F. (2001) A molecular genome scan analysis to identify chromosomal regions influencing economic traits in the pig. I. Growth and body composition. Mamm. Genome, 12, 630-636.
28 Milan, D., Bidanel, J. P., Iannuccelli, N., Riquet, J., Amigues, Y., Gruand, J., et al. (2002) Detection of quantitative trait loci for carcass composition traits in pigs. Genet. Sel. Evol., 34, 705-728.
Mutshinda, C. M. & Sillanpää, M. J. (2010) Extended Bayesian LASSO for multiple quantitative trait loci mapping and unobserved phenotype prediction.
Genetics, 186, 1067-75.
Paixão, D. M. (2010) Estudos de locos de características quantitativas, de expressão gênica e teste de paternidade em suínos. Doctoral thesis, Universidade Federal de Viçosa, Brazil.
Paixão, D. M., Silva Filho, M. I. D., Pereira, M. S., Lopes, M. S., Barbosa, L., Souza, K. R. S., et al. (2008) Quantitative trait loci for carcass, internal organ and meat quality traits on porcine chromosomes 16, 17 and 18. Genet. Mol. Biol., 31, 898-901.
Pérez-Enciso, M., Clop, A., Noguera, J. L., Ovilo, C., Coll, A., Folch, J. M., et al. (2000) A QTL on pig chromosome 4 affects fatty acid metabolism: evidence from an Iberian by Landrace intercross. J. Anim. Sci., 78, 2525-2531.
Ponsuksili, S., Jonas, E., Murani, E., Phatsara, C., Srikanchai, T., Walz, C., et al. (2008) Trait correlated expression combined with expression QTL analysis reveals biological pathways and candidate genes affecting water holding capacity of muscle. BMC Genomics, 9, 367.
R Development Core Team, (2011) R: A language and environment for statistical computing. R Foundation for Statistical Computing, Vienna, Austria. ISBN 3-900051-07-0, URL http://www.R-project.org.
Ramos, A. M., Crooijmans, R. P. M. A., Affara, N. A., Amaral, A. J., Archibald, A. L., Beever, J. E., et al. (2009). Design of a high density SNP genotyping assay in the pig using SNPs identified and characterized by next generation sequencing technology. PloS one, 4, 1-13.
Seaton G., Hernandez J., Grunchec J.A., White I., Allen J., De Koning D.J., Wei W., Berry D., Haley C., Knott S. (2006) GridQTL: A Grid Portal for QTL Mapping of Compute Intensive Datasets. In: Proceedings of the 8th World Congress on Genetics Applied to Livestock Production, August 13-18, 2006. Belo Horizonte, Brazil.
Silva, K. D. M., Paixão, D. M., Silva, P. V., Solero, B. P., Pereira, M. S., Lopes, P. S., et al. (2008) Mapping of quantitative trait loci and confirmation of the FAT1 region on chromosome 4 in an F2 population of pigs. Genet. Mol. Biol., 31, 475-480.
29 Sousa, K. R. S., Guimarães, S. E. F., Filho, M. I. S., Lopes, M. S., Gomes, A. P. P., Verardo, L. L., et al. (2011) Mapeamento de locos de características quantitativas nos cromossomos 5, 7 e 8 de suínos. R. Bras. Zootec., 40, 115-123.
Wimmers, K., Murani, E., Pas, M. F. W. T., Chang, K. C., Davoli, R., Merks, J. W. M., et al. (2007) Associations of functional candidate genes derived from gene-expression profiles of prenatal porcine muscle tissue with meat quality and muscle deposition. Anim. Genet., 38, 474-484.
30 APPENDIX 1
Supplementary table 1. SNPs and microsatellite marker names and their location (cM) on Sus scrofa chromosomes.
SSC Marker name Position SSC Marker name Position SSC Marker name Position
1 ALGA0000021 0.21 4 ALGA0026446 85.01 7 ALGA0045997 133.06
1 ALGA0000022 0.29 4 ALGA0026448 85.08 7 ALGA0046005 133.26
1 ALGA0000087 1.11 4 ALGA0026769 90.18 8 ALGA0046028 0.07
1 ALGA0001556 16.05 4 ALGA0026787 90.35 8 ALGA0046044 0.18
1 ALGA0001557 16.10 4 S0073 90.98 8 SW2410 3.75
1 ALGA0001559 16.12 4 ALGA0027457 100.09 8 ALGA0046546 5.02
1 ALGA0003218 42.14 4 ALGA0027463 100.21 8 S0098 5.92
1 ALGA0003220 42.17 4 ALGA0027472 100.26 8 SW905 7.80
1 ALGA0003237 42.46 4 ALGA0027642 102.39 8 ALGA0047003 10.17
1 ALGA0003751 50.2 4 ALGA0027644 102.41 8 ALGA0047007 10.34
1 ALGA0003761 50.37 4 ALGA0027647 102.44 8 ALGA0047008 10.36
1 ALGA0004073 57.63 4 ALGA0027861 105.01 8 ALGA0047440 15.04
1 ALGA0004074 57.65 4 ALGA0027862 105.02 8 ALGA0047444 15.19
1 ALGA0004358 64.2 4 ALGA0027868 105.15 8 ALGA0047449 15.24
1 ALGA0004392 64.52 4 ALGA0028270 110.31 8 ALGA0047813 20.03
1 ALGA0004774 74.04 4 ALGA0028623 115.12 8 ALGA0047819 20.46
1 ALGA0004794 74.34 4 ALGA0028632 115.22 8 ALGA0047889 25.04
1 SW781 75.99 4 ALGA0028649 115.42 8 ALGA0047893 25.35
1 ALGA0005068 80.43 4 ALGA0028822 117.00 8 ALGA0047895 25.40
1 ALGA0005071 80.44 4 ALGA0028846 117.17 8 ALGA0047992 30.17
1 ALGA0005078 80.50 4 SW58 118.94 8 ALGA0047993 30.23
1 ALGA0005714 100.61 4 ALGA0029201 120.42 8 ALGA0047995 30.31
1 ALGA0005717 100.63 4 ALGA0029464 122.89 8 ALGA0048131 35.02
1 ALGA0005718 100.65 4 ALGA0029474 122.99 8 ALGA0048133 35.04
1 ALGA0005838 107.22 4 ALGA0029483 123.28 8 ALGA0048135 35.18
1 ALGA0006259 126.28 4 ALGA0029485 123.34 8 ALGA0048396 40.18
1 ALGA0006262 126.31 4 ALGA0029773 127.78 8 ALGA0048658 45.11
1 ALGA0006460 131.47 4 ALGA0029781 127.92 8 ALGA0048659 45.14
1 ALGA0006468 131.78 4 ALGA0029783 127.97 8 ALGA0048843 50.02
1 ALGA0006470 131.81 7 ALGA0037853 0.47 8 ALGA0048854 50.17
1 ALGA0006708 141.39 7 S0025 0.64 8 ALGA0049219 55.01
1 ALGA0006721 142.02 7 ALGA0038213 5.34 8 ALGA0049233 55.13
1 ALGA0006722 142.22 7 ALGA0038216 5.45 8 ALGA0049235 55.14
1 ALGA0007015 150.99 7 ALGA0038559 10.35 8 S0017 57.83
1 ALGA0007021 151.37 7 S0064 11.44 8 ALGA0049546 60.04
1 ALGA0007023 151.75 7 ALGA0038836 15.09 8 ALGA0049550 60.07
1 ALGA0007216 160.61 7 ALGA0038838 15.16 8 S0086 62.69
1 ALGA0007238 161.10 7 ALGA0038840 15.18 8 ALGA0050287 66.56
1 ALGA0007718 181.18 7 ALGA0039151 20.25 8 SW1085 103.55
1 ALGA0007730 182.12 7 ALGA0039592 25.51 8 S0178 118.19
1 ALGA0007803 184.55 7 ALGA0039607 26.43 17 ALGA0092499 0.23
1 ALGA0007807 184.62 7 ALGA0039880 30.13 17 ALGA0092509 0.33
1 ALGA0007813 184.86 7 ALGA0039900 30.21 17 ALGA0092923 5.10
1 ALGA0007897 190.59 7 ALGA0040318 35.29 17 ALGA0092930 5.35
1 ALGA0007908 190.86 7 ALGA0040328 35.43 17 SWR1004 7.06
1 S0113 198.28 7 ALGA0040721 40.21 17 ALGA0093241 10.07
1 ALGA0008230 200.24 7 ALGA0040736 40.41 17 ALGA0093251 10.20
1 ALGA0008233 200.41 7 ALGA0040937 45.02 17 ALGA0093254 10.28
1 ALGA0008236 200.60 7 S0102 45.48 17 sw24 13.22
1 ALGA0008558 210.03 7 ALGA0040948 45.58 17 S0296 14.86
1 ALGA0008571 210.61 7 ALGA0041246 50.00 17 ALGA0093817 20.15
31 Supplementary table 1 cont. SNPs and microsatellite marker names and their location (cM) on Sus scrofa chromosomes.
SSC Marker name Position SSC Marker name Position SSC Marker name Position
1 ALGA0008973 220.39 7 ALGA0041266 50.28 17 SW2142 22.34
1 ALGA0009321 225.12 7 ALGA0041856 55.06 17 ALGA0094080 25.02
1 ALGA0009384 225.77 7 ALGA0042216 60.43 17 ALGA0094092 25.24
1 SWR982 231.82 7 ALGA0042327 65.56 17 ALGA0094105 25.36
1 ALGA0010089 233.39 7 ALGA0042411 70.19 17 ALGA0094522 30.00
1 ALGA0010677 240.58 7 ALGA0042417 70.39 17 ALGA0094911 35.02
1 ALGA0010683 240.62 7 ALGA0042519 75.27 17 ALGA0094915 35.10
1 S0112 280.11 7 ALGA0042520 75.45 17 ALGA0095323 40.13
1 SW2035 290.18 7 ALGA0042594 80.01 17 ALGA0095327 40.16
4 ALGA0021973 0.28 7 ALGA0042597 80.05 17 ALGA0095334 40.20
4 ALGA0021974 0.32 7 ALGA0042601 80.09 17 ALGA0095659 45.13
4 ALGA0022406 3.01 7 ALGA0042863 86.24 17 ALGA0095662 45.27
4 ALGA0022414 3.10 7 ALGA0042986 90.01 17 S0359 48.27
4 ALGA0022429 3.18 7 ALGA0042987 90.06 17 ALGA0096087 50.17
4 SW489 6.20 7 ALGA0043398 95.17 17 ALGA0096093 50.29
4 ALGA0023180 10.01 7 ALGA0043403 95.20 17 ALGA0096099 50.39
4 S0301 11.60 7 ALGA0043757 100.09 17 ALGA0096701 55.81
4 ALGA0024031 20.25 7 ALGA0043766 100.61 17 ALGA0096707 55.84
4 ALGA0024036 20.55 7 ALGA0043769 100.66 17 S0332 59.88
4 S0001 22.17 7 ALGA0043962 105.35 17 SW2427 66.71
4 ALGA0024439 30.01 7 SW252 104.50 X ASGA0080454 0.04
4 ALGA0024446 30.19 7 ALGA0043983 105.88 X ALGA0098944 0.06
4 ALGA0024878 40.13 7 ALGA0043984 106.28 X SW980 7.26
4 ALGA0024881 40.50 7 SW632 109.14 X H3GA0053490 10.07
4 ALGA0024883 40.59 7 ALGA0044298 110.64 X ASGA0080951 15.13
4 ALGA0025057 50.11 7 ALGA0044299 110.66 X SW2126 28.65
4 ALGA0025063 51.27 7 ALGA0044302 110.74 X ALGA0099785 35.17
4 ALGA0025370 60.03 7 ALGA0044519 115.23 X ALGA0099944 55.02
4 ALGA0025374 60.22 7 ALGA0044524 115.27 X MARC0099472 76.48
4 ALGA0025382 60.31 7 ALGA0044526 115.34 X DIAS0001212 80.78
4 ALGA0025795 70.01 7 ALGA0044983 120.62 X ALGA0111404 100.77
4 ALGA0025803 70.20 7 ALGA0044984 120.63 X ASGA0104059 101.96
4 ALGA0025813 70.28 7 ALGA0045009 120.88 X SW1943 102.19
4 ALGA0026100 75.53 7 ALGA0045338 125.02 X sw1608 102.20
4 ALGA0026103 75.56 7 ALGA0045353 125.14 X MARC0051258 112.22
4 ALGA0026109 75.57 7 ALGA0045360 125.26 X S0218 112.31
4 S0217 78.02 7 S0212 125.42 X SW949 125.68
4 ALGA0026237 80.02 7 ALGA0045743 130.22 X SIRI0000378 132.13
4 ALGA0026241 80.14 7 ALGA0045745 130.24