www.ann-geophys.net/32/207/2014/ doi:10.5194/angeo-32-207-2014
© Author(s) 2014. CC Attribution 3.0 License.
Annales
Geophysicae
Influence of water vapour on the height distribution of positive ions,
effective recombination coefficient and ionisation balance in the
quiet lower ionosphere
V. Barabash1, A. Osepian2, and P. Dalin3
1Luleå University of Technology, Rymdcampus 1, 981 92 Kiruna, Sweden 2Polar Geophysical Institute, Halturina 15, 183 023 Murmansk, Russia 3Swedish Institute of Space Physics, Rymdcampus 1, 981 92 Kiruna, Sweden
Correspondence to: V. Barabash ([email protected])
Received: 12 June 2013 – Revised: 22 January 2014 – Accepted: 28 January 2014 – Published: 11 March 2014
Abstract. Mesospheric water vapour concentration effects
on the ion composition and electron density in the lower ionosphere under quiet geophysical conditions were exam-ined. Water vapour is an important compound in the meso-sphere and the lower thermomeso-sphere that affects ion com-position due to hydrogen radical production and conse-quently modifies the electron number density. Recent lower-ionosphere investigations have primarily concentrated on the geomagnetic disturbance periods. Meanwhile, studies on the electron density under quiet conditions are quite rare. The goal of this study is to contribute to a better understanding of the ionospheric parameter responses to water vapour vari-ability in the quiet lower ionosphere. By applying a numeri-cal D region ion chemistry model, we evaluated efficiencies for the channels forming hydrated cluster ions from the NO+ and O+2 primary ions (i.e. NO+.H2O and O+2.H2O,
respec-tively), and the channel forming H+(H2O)nproton hydrates from water clusters at different altitudes using profiles with low and high water vapour concentrations. Profiles for pos-itive ions, effective recombination coefficients and electrons were modelled for three particular cases using electron den-sity measurements obtained during rocket campaigns. It was found that the water vapour concentration variations in the mesosphere affect the position of both the Cl+2 proton hy-drate layer upper border, comprising the NO+(H
2O)n and O+2(H2O)n hydrated cluster ions, and the Cl+1 hydrate clus-ter layer lower border, comprising the H+(H
2O)n pure pro-ton hydrates, as well as the numerical cluster densities. The water variations caused large changes in the effective recom-bination coefficient and electron density between altitudes of
75 and 87 km. However, the effective recombination coeffi-cient,αeff, and electron number density did not respond even
to large water vapour concentration variations occurring at other altitudes in the mesosphere. We determined the water vapour concentration upper limit at altitudes between 75 and 87 km, beyond which the water vapour concentration ceases to influence the numerical densities of Cl+2 and Cl+1, the ef-fective recombination coefficient and the electron number density in the summer ionosphere. This water vapour concen-tration limit corresponds to values found in the H2O-1 profile
that was observed in the summer mesosphere by the Upper Atmosphere Research Satellite (UARS). The electron den-sity modelled using the H2O-1 profile agreed well with the
electron density measured in the summer ionosphere when the measured profiles did not have sharp gradients. For sharp gradients in electron and positive ion number densities, a wa-ter profile that can reproduce the characwa-teristic behaviour of the ionospheric parameters should have an inhomogeneous height distribution of water vapour.
Keywords. Ionosphere (ion chemistry and composition)
1 Introduction
galactic cosmic rays. Ionisation in the nighttime ionosphere is produced by scattered radiation at 304 nm, 584 nm,
Ly-α and Ly-β lines (Brasseur and Salomon, 1986). Ions and electrons in the D region are mixed with the dense neu-tral atmosphere and undergo collisions with neuneu-tral parti-cles, therefore changing the physical and chemical states of the medium. The primary ions, i.e. NO+, O+2, O−2 and O− (Brasseur and Salomon, 1986), initiate complex chains of ion–molecule reactions with chemically active minor neutral species (e.g. O, O3, NO, NO2, H2O, HOx, O2(11g), CO2,
N2O5, HNO3 and HCl) (Solomon et al., 1981; Verronen et
al., 2008, 2011; Verronen and Lehmann, 2013; Winkler et al., 2009) resulting in the formation and presence of various ion clusters and simple and complex negative ions in the D re-gion, with number densities depending on altitude, season, local time and other factors.
Water vapour is an important compound in the upper at-mosphere that influences ion composition due to hydrogen radical production and consequently modifies the ion com-position and electron number density. Recent research has been quite successful in mapping the water vapour pattern in the lower mesosphere and explaining possible mechanisms for cluster ion formation (Solomon et al., 1981; Gumbel and Witt, 2002; Sonnemann et al., 2005, 2012; Hervig and Siskind, 2006; Lossow et al., 2007; Grygalashvyly et al., 2009; Hartogh et al., 2010; Gabriel et al., 2011). However, the ionospheric parameter responses to water vapour vari-ability in the mesosphere and the lower thermosphere are very complicated.
Current experimental knowledge about the electron den-sity and ion composition in the quiet lower ionosphere, i.e. when the D region is weakly ionised, is primarily based on in situ measurements obtained during periodical rocket cam-paigns. However, rocket ion and electron measurements do not provide a complete representation of ionospheric struc-ture due to their spatial and temporal limitations. New pos-sibilities have recently become available, e.g. the Doppler radar operating at 3.17 MHz at the Andoya Rocket Range in Norway (69.3◦N, 16.0◦E) (Singer et al., 2011). The situa-tion can be further improved by applying theoretical models in combination with available experimental data. Depending on specific goals of a study, complex or simplified ion chem-istry schemes may be applied.
1.1 Detailed ion chemistry schemes
Laboratory (Ferguson, 1971a, b, 1974; Fehsenfeld and Fergusson, 1974; Smith et al., 1976, 1979; Smith and Church, 1977; Albritton, 1978; Cosby et al., 1978) and the-oretical studies (Shimazaki, 1984) of ion–molecule reactions created opportunities for the development of D region ion-chemical models that include different ionisation sources. The main task and challenge for ion-chemical model formu-lation is the correct description of cluster ion formation from primary positive ions and complex negative ion formation
and loss in various geophysical situations, e.g. during quiet or disturbed conditions, different seasons, and solar illumi-nation. Such models are able to explain cluster and complex negative ion of characteristics and provide information on the altitude distribution of ionosphere parameters. This infor-mation cannot be directly retrieved from standard measure-ments. However, the information is very important for under-standing the physics and chemistry of the specific medium and for solving practical problems.
Fehsenfeld and Fergusson (1969) were the first to show that NO+ ions can be successively hydrated in the meso-sphere. Because of the relatively low water vapour concen-tration and low pressure in the mesosphere, direct three-body association of water vapour is too slow compared to the rapid loss rate imposed on cluster ions by dissociative recombi-nation. Association processes with abundant gases, i.e. N2
and CO2, have been studied by Dunkin et al. (1971) and
Ferguson (1974, 1976). Thomas (1976a, b) introduced clus-ter formation reactions between NO+, CO
2 and N2 into a
positive ion chemistry model for the daytime D region and investigated the role of these reactions in NO+ hydration and their dependence on mesospheric temperatures. Clus-ter ion formation from O+2 was proposed by Fehsenfeld and Fergusson (1969) and is based on the mutual three-body for-mation of O+4 and O+2(H2O) and subsequent reactions with
water vapour and three-body attachments of water molecules to form higher-order proto-hydrated cluster ions, i.e. H+ (H2O)n.
An ion model of the mesosphere with complex neg-ative ion chemistry was presented by Wisemberg and Kockarts (1980). They evaluated quantitatively the role of various paths in the ion-chemical model. According to Smirnova and Vlaskov (1982a, b) and Fritzenwallner and Kopp (1998), hydrated ions, i.e. CO−3(H2O)n and NO−3(H2O)n, detected during a few negative ion composi-tion measurement periods (a mass greater than 70 amu cor-responds to negative cluster ions) may be abundant in cer-tain conditions, e.g. the summer twilight during noctilucent cloud events. However, the effect of negative cluster ions on negative ion and electron number densities and the altitude distribution of primary negative ions is not well pronounced. Turco and Sechrist (1972a, b), Thomas and Bowman (1986), Hodges et al. (1980) and Reid (1987) have shown that pho-todissociation of molecular ions and photodetachment of electrons are important for ion chemistry and electron height distributions in the lower ionosphere.
al. (1992). The impact of ion chemistry on the neutral species (NOx, HOx)has been studied in most cases during the
so-lar proton events (Jackman and Meade, 1988; Jackman et al., 1995, 2001, 2005; Rohen et al., 2005). Lopez-Puertas et al. (2005) investigated changes of neutral species during a so-lar proton event, but did not use any model results to explain his observations. Steady-state, time-dependent and global two-dimensional ion-chemistry models have been presented by Kull et al. (1997), Verronen et al. (2002, 2008, 2011), Kazil et al. (2003), and Winkler et al. (2009). These complex models allow the investigation of the coupling mechanisms between neutral particle chemistry and ion chemistry. A vali-dation of the models has been performed in most cases during strong ionospheric disturbances (Verronen et al., 2008, 2011; Winkler et al., 2009). Particularly, these models made it pos-sible to explain ozone depletion and nitric oxide enhance-ment observed during solar proton events (Solomon et al., 1981, 1982; Zadorozhny, 1982; Seppala et al., 2004, 2007; Verronen et al., 2002, 2005, 2006; Funke et al., 2011). More-over, it is possible to apply these complex models to exam-ine ion concentrations, including both the final and interme-diate cluster ions, if the complete experimental ion compo-sition data required for model–observation comparisons are available. However, as previous studies have suggested, these complex models have some intrinsic limitations that may be associated with inadequacies in the reaction rate constants and uncertainties in some chemical reaction paths included in the detailed ion and neutral chemical schemes. Some ion– molecule reactions are still under discussion. There are also limitations on mass spectrometer observations.
1.2 Simplified ion chemistry schemes
Another approach for modelling the lower ionosphere is based on a reasonable simplification of the ion–molecule processes scheme (Haug and Landmark, 1970; Mitra and Rowe, 1972; Danilov and Yaichnikov, 1985; Smirnova, 1982, 1983a, b; Smirnova et al., 1988). The simplified chemical schemes are likely to avoid possible uncertainties in describ-ing cluster, intermediate positive and negative ion concen-trations by selecting the ion–molecule reactions that are the most important for chemical transformations. Less important chemical processes, i.e. with large reaction rate constant un-certainties, are not considered. These schemes implement ion bond energies, rate constants and efficiencies for each reac-tion participating in the chemical transformareac-tion processes. Moreover, the dependence of these parameters on temper-ature and intermediate ion thermal decomposition are also represented.
Furthermore, models with simplified ion chemistry schemes must accurately reproduce height distributions of electrons and main final ions. These models must also pro-vide a correct description of the generalised principal char-acteristics of the ionosphere, namely,
– f+= [Cluster+]/([NO+] + [O+
2]), a ratio of positive
cluster ions to primary molecular ions,
– λ=N−/Ne, a ratio of negative ion number density to
electron number density,
– hf+=1andhλ=1, the transition heights, and the
effec-tive recombination coefficients
for various solar zenith angles (solar illumination), seasons and geomagnetic disturbance levels.
The ion–molecule reaction efficiencies together with ion-isation and recombination depend on local concentrations of chemically active minor neutral constituents and affect the ionosphere structure. The altitude and spatial distribu-tions of these minor neutral constituents depend on the so-lar zenith angle, season, latitude, soso-lar activity, ionisation sources, transport, diffusion and other factors. Therefore, the modelled ionospheric parameters, which are based on both complex detailed and simple ion chemistry schemes (Smirnova, 1982, 1983a, b), depend on the choice of mi-nor neutral constituent profiles introduced into the model for each particular case study. Osepian et al. (2008, 2009b) im-plemented a simplified ion chemistry scheme to investigate the role of atomic oxygen and ozone concentrations in the ionisation balance in the D region during solar proton events. Moreover, the NO, O and O3 concentration effects on the
electron number density in the quiet D region between 60 and 100 km were studied by Barabash et al. (2012).
In the current study, the simplified ion chemistry model developed by Smirnova and Vlaskov (1982a, 1983) has been applied to examine the water vapour concentration effects on a few ionospheric parameters, namely,
– the efficiency of the channels forming non-proton
(Cl+1)and proton (Cl+2)hydrate layers in the D region and
– the variability of positive ions, electron number
densi-ties and effective recombination coefficients.
Additionally, H2O profiles that are more consistent with
measured electron densities between 60 and 100 km in sum-mer and winter during quiet geophysical conditions have been defined.
2 Theoretical model of the lower ionosphere
Nitric oxide (NO) ionised by Ly-αis the main source of electrons and positive ions between 65 and 85 km in the quiet ionosphere. The bond energy for NO+(H
2O)n ions is high compared to one of the intermediate ions, and the rate of their thermal decomposition is low. The estimations of the rate processes on the second and third hydration stages have shown that the main process intermediate NO+(H2O)1,2.X
(whereXis N2or CO2)ion loss is due to thermal
decompo-sition. Reid (1977) showed that the formation rate of cluster ions from the NO+ ion is strongly temperature-dependent, which is primarily due to the temperature dependence of the NO+(H2O) formation rate via the two-stage hydration
mechanism. The efficiency of the NO+ hydration channel,
B(NO+), including both direct and indirect hydration, is expressed via ion transformation process rate constants and H2O, N2and CO2concentrations:
B(NO+)= [H2O]
r1[N2] +
r2[N2]2r4
C +
r6
r6[H2O] +r−5[N2]
r5[CO2][N2] +
r2[N2]2r3[CO2] C
, (1)
where C =r−2[N2] +r3[CO2] +r4[H2O] andr1,r2,r−2,r5,
and r−5 are functions of temperature. The direct
hydra-tion efficiency of NO+ is ν=r1·[H2O]·[N2]. The
effi-ciencyB(NO+)is inversely proportional to the temperature (Smirnova and Vlaskov, 1982b; Smirnova, 1982, 1983a, b).
Furthermore O+2 ions are lost via charge exchange and reactions, including the formation of intermediate O+4 and O+2.N2 ions followed by the O+2.H2O cluster ion
forma-tion. The O+2 hydration channel becomes the primary clus-ter ion source during strong ionospheric disturbances that are caused by precipitating particles when the O+2 concen-tration is largely increased compared to the NO+ concentra-tion. The efficiency of the O+2 hydration channel, B(O+2), was derived according to Fehsenfeld and Fergusson (1969), Ferguson (1976) and Chakrabarty (1978) and includes, in addition to the typically considered processes, an additional O+2(H2O) formation path via the O+2.N2cluster ion and
ther-mal O+4 decomposition:
B(O+2)= K1[O2]
2+v 1[N2]2 K2[O]+K3[O2(11g)]+K−1[O2]
K4[H2O] +1
, (2)
whereK1, v1, and K−1 are functions of temperature. The
effective parameter,B(O+2), is proportional toT−4.4and
de-pends on the H2O and O concentrations at any temperature.
The NO+(H
2O)n and O+2(H2O)n hydrated cluster ions, formed from the NO+and O+2 primary ions, were combined into a family Cluster+1 (Cl+1) with the average recombina-tion coefficientαCl1+∼2×10⁻⁶cm3s−1(Smirnova, 1982, 1983a, b; Smirnova and Vlaskov, 1982b). The complex pro-ton hydrate formation process is described using a direct hy-dration reaction with the efficiency expressed as follows:
B(Cl+1)=10−27×(300/T )4.4· [H2O] · [N2]. (3)
Because hydration processes are three-body collision pro-cesses with rates that depend on temperature, the ef-fective parameter, B(Cl+1), depends on the temperature and H2O concentration. The H+(H2O)n pure proton hy-drates, forming from Cluster+1, are combined into a fam-ily Cluster+2 (Cl+2) with the average recombination coeffi-cientαCl2+∼1×10⁻⁵cm3s−1(Smirnova, 1982, 1983a, b; Smirnova and Vlaskov, 1982b). The expression for the effi-ciency of the channel transforming the Cl+1 family into Cl+2 proton hydrates is derived via the evaluation and comparison of the formation rates and bond energies for H+(H2O)n−1.X
complex intermediate clusters (whereXis N2or CO2). The
Cl+2 ions recombine with electrons approximately five times faster than the Cl+1 ions.
Table 1 yields rate constants (cm3s−1)used in the NO+ and O+2 hydration channel efficiency expressions, recombi-nation coefficients for NO+and O+
2 with electrons and
neg-ative ions, and cluster ion dissocineg-ative recombination coeffi-cients from Smirnova (1982, 1983a, b).
Ozone, atomic oxygen and nitric oxide participate in the complicated chemical transformation of the O−2 and O− pri-mary negative ions into the O−3, O−4, NO−2 and CO−4 complex intermediate negative ions. These intermediate ions convert into each other very quickly via ion–molecule reactions. Al-though the ion concentrations are low, they are important for the formation of additional CO−3 and NO−3 stable ions. The efficiencies of the channels leading to O−2 and O− losses,
B(O−2)andB(O−), during complex negative ion formation include the principal process rates from the detailed models by Arnold (1980) and Ferguson (1976) and are described as follows:
B(O−2)=β12· [O2]2+β13· [O2] · [CO2] +β14· [O3], (4)
B(O−)=β15· [O2] +β16· [O2] · [CO2] +β17· [O3]. (5)
The reliability of the effective parameter expressions de-duced for each channel have been verified via a compar-ison of the NO+(H2O), O+2(H2O), H+(H2O)n and CO−3
formation rates calculated by both complex and simplified schemes.
The rate constants for the reactions that lead to the forma-tion and loss of the O−2, O−, CO−3 and NO−3 negative ions are presented in Table 2.
The algorithms for calculating solar radiation intensity for different wavelength ranges and ionisation rates, consider-ing all ionisation sources durconsider-ing quiet periods, are presented in Barabash et al. (2012). The NRLMSISE-00 (Naval Re-search Laboratory Mass Spectrometer and Incoherent Scatter Radar) model of the atmosphere is used (Hedin, 1991; Picone et al., 2002).
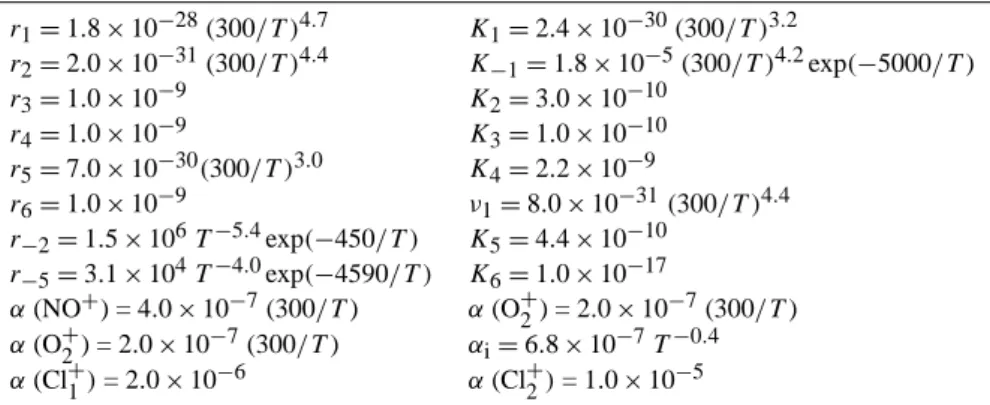
Table 1. Rate constants (cm3s−1)included in the expressions for NO+and O+2 hydration channel efficiencies, recombination coefficients of NO+and O+2 with electrons and negative ions, and cluster ion dissociative recombination coefficients (from Smirnova, 1982, 1983a, b).
r1=1.8×10⁻²⁸(300/T )4.7 K1=2.4×10⁻³⁰(300/T )3.2
r2=2.0×10⁻³¹(300/T )4.4 K−1=1.8×10⁻⁵(300/T )4.2exp(−5000/T)
r3=1.0×10⁻⁹ K2=3.0×10⁻¹⁰
r4=1.0×10⁻⁹ K3=1.0×10⁻¹⁰
r5=7.0×10⁻³⁰(300/T )3.0 K4=2.2×10⁻⁹
r6=1.0×10⁻⁹ ν1=8.0×10⁻³¹(300/T )4.4
r−2=1.5×10⁶T−5.4exp(−450/T ) K5=4.4×10⁻¹⁰
r−5=3.1×10⁴T−4.0exp(−4590/T ) K6=1.0×10⁻¹⁷
α(NO+) = 4.0×10⁻⁷(300/T) α(O+2) = 2.0×10⁻⁷(300/T) α(O+2) = 2.0×10⁻⁷(300/T) αi=6.8×10⁻⁷T−0.4
α(Cl+1)= 2.0×10⁻⁶ α(Cl+2)= 1.0×10⁻⁵
76◦) and nighttime ionosphere (χ is greater than 100◦), re-spectively. To determine the altitude profiles of the minor species for solar zenith angles between 76 and 100◦, two-dimensional correction coefficient matrices for each species are used. The correction coefficients depend on the solar zenith angle and altitude and were derived from the sim-ulated results of Shimazaki and Laird (1970), Turco and Sechrist (1972b), and Ogawa and Shimazaki (1975) for a 5 km vertical domain. In the PGI model, the vertical reso-lution is 1 km. The final twilight profile for the entire altitude range is a combination of daytime and nighttime profiles. The correction factors deduced from the matrix coefficients, which are linearly interpolated to a fine 1 km vertical grid, are considered.
The model input parameters are date, local time, geomag-netic latitude, geographic coordinates, solar activity index
F10.7, temperature, and altitude profiles for O2, N2and minor
neutral constituents (i.e. NO, O, O3, H2O, O2 (11g), NO2
and CO2)for local noon and midnight with a vertical interval
of 1 km. The model solves a system of eight continuity equa-tions for O+2, NO+, Cl+1, Cl+2, O−2, O−, CO−3 and NO−3. Due to the short lifetimes of ions and electrons in the D region, the dynamical and transport effects are not considered. The electron number density,Ne, is calculated as a difference
be-tween the positive and negative ion number densities. In pho-tochemical equilibrium, the effective recombination coeffi-cient is determined as follows (Rishbeth and Garriott, 1969; Danilov and Simonov, 1981):
αeff=(1+λ)·(αd+λαi), (6)
αd=
αNO+
,O+2 +f
+ ·αCl+
/ 1+f+, (7) whereαdis the recombination coefficient weighted for
dif-ferent positive ion types andαiis the ion–ion recombination
coefficient. The latter depends on the cluster ion formation rates or efficiency of the channels forming cluster ions, which then depends on the water vapour concentration and temper-ature.
Fig. 1. Profiles of atomic oxygen, ozone and nitric oxide in the
mesosphere used as model input parameters.
The minor neutral species are taken from the diffusion–photochemical models developed by Ogawa and Shimazaki (1975), Zadorozhny (1982), Solomon et al. (1982), and Rodrigo et al. (1986). Figure 1 presents the atomic oxygen (O), ozone (O3) and nitric oxide (NO)
profiles used as input parameters for our calculations. According to Barabash et al. (2012), the NO-1-d profile is applied for a low solar activity index (i.e.F10.7=70–120)
and the NO-2-d profile is used forF10.7> 120.
The applied model describes and explains (Danilov and Smirnova, 1993, 1994, 2003) changes in thef+parameter, the transit height,hf+=1, andαeff caused by strong
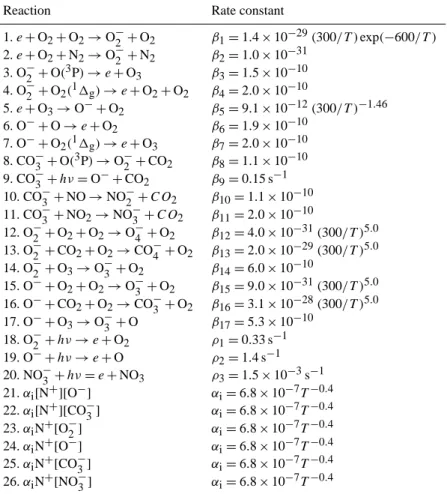
Table 2. Rate constants for the reactions leading to the formation and loss of the O−2, O−, CO−3 and NO−3 negative ions in the Smirnova (1982, 1983a, b) chemical scheme.
Reaction Rate constant
1.e+O2+O2→O−2 +O2 β1=1.4×10⁻²⁹(300/T )exp(−600/T )
2.e+O2+N2→O2−+N2 β2=1.0×10⁻³¹
3. O−2 +O(3P)→e+O3 β3=1.5×10⁻¹⁰
4. O−2 +O2(11g)→e+O2+O2 β4=2.0×10⁻¹⁰
5.e+O3→O−+O2 β5=9.1×10⁻¹²(300/T )−1.46
6. O−+O→e+O2 β6=1.9×10⁻¹⁰
7. O−+O2(11g)→e+O3 β7=2.0×10⁻¹⁰
8. CO−3 +O(3P)→O−2+CO2 β8=1.1×10⁻¹⁰
9. CO−3 +hν=O−+CO2 β9=0.15 s−1
10. CO−3 +NO→NO−2 +CO2 β10=1.1×10⁻¹⁰ 11. CO−3 +NO2→NO−3 +CO2 β11=2.0×10⁻¹⁰
12. O−2 +O2+O2→O−4 +O2 β12=4.0×10⁻³¹(300/T )5.0
13. O−2 +CO2+O2→CO−4 +O2 β13=2.0×10⁻²⁹(300/T )5.0
14. O−2 +O3→O−3 +O2 β14=6.0×10⁻¹⁰
15. O−+O2+O2→O−3 +O2 β15=9.0×10⁻³¹(300/T )5.0
16. O−+CO2+O2→CO−3 +O2 β16=3.1×10⁻²⁸(300/T )5.0
17. O−+O3→O−3 +O β17=5.3×10⁻¹⁰
18. O−2 +hν→e+O2 ρ1=0.33 s−1
19. O−+hν→e+O ρ2=1.4 s−1
20. NO−3 +hν=e+NO3 ρ3=1.5×10⁻³s−1
21.αi[N+][O−] αi=6.8×10⁻⁷T−0.4
22.αi[N+][CO−3] αi=6.8×10⁻⁷T−0.4
23.αiN+[O−2] αi=6.8×10⁻⁷T−0.4
24.αiN+[O−] αi=6.8×10⁻⁷T−0.4
25.αiN+[CO−3] αi=6.8×10⁻⁷T−0.4
26.αiN+[NO−3] αi=6.8×10⁻⁷T−0.4
Model verification is based on the comparison of the mod-elled electron density profiles with several electron density profiles measured by the European Incoherent Scatter (EIS-CAT) radar during auroral absorption and solar proton events (Vlaskov et al., 1990; Kirkwood et al., 2001; Osepian et al., 2009a) and during rocket flights in the quiet ionosphere at mid-latitudes (Barabash et al., 2012).
Water is one of the most important species in the lower ionosphere and is characterised by strong spatial and temporal variability. Pronounced daily water variability is connected to planetary wave activity throughout the year (Hartogh et al., 2010). The largest water vapour concentra-tions have been found during summer because of intensified gravity wave upward propagation. Between 65 and 75 km, an additional water vapour maximum has been observed due to the interaction between upward motions and auto-catalytic water vapour formation (Sonnemann et al., 2005, 2012). Satellite measurements performed during the Mid-dle Atmosphere High-Resolution Spectrograph Investigation indicated a water vapour peak between 10 and 15 ppmv at altitudes between 82 and 84 km in the polar summer
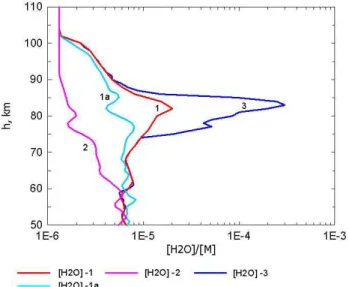
mesosphere (Summers et al., 2001). Data from the Odin satellite give an average peak of 8 ppmv at 80 km for July in high latitudes, i.e. north of 55◦N (Lossow et al., 2007). Measurements from the HALOE (Halogen Occultation Ex-periment) with the Upper Atmosphere Research Satellite (UARS) also exhibit large water profile variability between 60 and 100 km (http://haloe.gats-inc.com/home/index.php). The water vapour profiles measured with the HALOE instru-ment aboard the UARS on 25 January 2004, 4 June 2005 and 19 June 2004 are applied in this study. The H2O-1, H2O-2,
and H2O-3 profiles are presented in Fig. 2. The deviations
be-tween profiles 1 and 2 produce maximum values, i.e. a factor of 12, between 82 and 84 km. The H2O-3 profile is an
artifi-cially modified H2O-1 profile with the number densities that
Fig. 2. Water vapour profiles in ppmv in the mesosphere used as
in-put parameters for calculations. Experimental profiles H2O-1, H2 O-1a, and H2O-2 were retrieved from the HALOE measurements on
19 June 2004 (H2O-1), 4 June 2005 (H2O-1a) and 25 January 2004
(H2O-2).
3 Results
3.1 Effect of the water vapour concentration on channel efficiencies for NO+
→NO+.H
2O and
Cluster+1 →Cluster+2
Figure 3a compares height profiles of the efficiency for the NO+→NO+.H2O channel, B(NO+), calculated for
win-ter and summer based on the H2O-1 and H2O-2 profiles.
Dashed curves 1 and 2 show height profiles for the efficiency of NO+ion direct hydration. Above 60 km, the direct hydra-tion efficiency strongly decreases and the NO+.H
2O cluster
form primarily via indirect hydration. The water concentra-tion growth between 60 and 100 km, e.g. from the H2O-2
to the H2O-1 profile (by a factor of 2–2.5 between 65 and
70 km, by a factor of 4.4 at 75 km and by a factor of 10–12 between 82 and 84 km), increases the NO+indirect hydra-tion efficiency in summer below 82 km (by a factor of 1.95– 1.75 between 65 and 70 km and by a factor of 1.4 at 75 km). In winter,B(NO+)increases at all altitudes in conjunction with the increasing H2O concentrations.
Figure 3b compares the efficiency of a channel transform-ing Cl+1 into Cl+2 with B(NO+). In the lower part of the D region, i.e. below 70 km, B(Cl+1) is always larger than
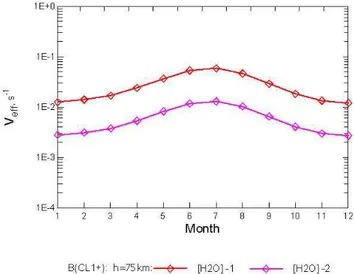
B(NO+). Figure 4a and b present seasonal variations in the efficiency of the NO+→NO+.H2O channel,B(NO+),
calculated at 75 and 80 km and the Cl+1 →Cl+2 channel,
B(Cl+1), at 75 km for the H2O-1 and H2O-2 profiles. It
is clear that the seasonal B(NO+)and B(Cl+1) variations are primarily associated with seasonal neutral mesospheric temperature variations (winter temperature is higher than
Fig. 3a. Efficiency of the NO+→NO+.H2O channel,B(NO+),
calculated for winter and summer based on the H2O-1 and H2
O-2 profiles. Dashed curves 1 and O-2 show the vertical profiles of the efficiency for NO+ion direct hydration.
Fig. 3b.B(NO+)andB(Cl+1)efficiencies calculated for winter and
summer based on the H2O-1 and H2O-2 profiles.
summer temperature). The larger variability in B(NO+)
Fig. 4a. Seasonal variation in theB(NO+) efficiency calculated based on the H2O-1 and H2O-2 profiles for 75 and 80 km.
Fig. 4b. Seasonal variation in the B(Cl+1) efficiency calculated
based on the H2O-1 and H2O-2 profiles for 75 km.
3.2 Case: 16 June 2004
Figure 5a, b and c show the water vapour effect on elec-tron and positive ion height distributions. The elecelec-tron num-ber density measured by the EISCAT radar on 16 June 2004 at 12:00 UT forχ= 47.3◦andF
10.7=110 in northern
Swe-den (69.6◦N, 19.3◦E) is shown in black. Modelled profiles have been calculated for NO-1-d and the H2O-1, H2O-2 and
H2O-3 profiles. The model results agree well with the
ob-servations. However, at lower altitudes, the measured elec-tron density fluctuates. This finding is likely due to receiver noise that increases at lower altitudes with decreasing elec-tron number density.
Figure 5b and c show how different water vapour pro-files can modify positive ion number density and redistribute
Fig. 5a. Electron density profiles for 16 June 2004 at 12:00 UT. The
black line corresponds to the electron density profile measured by the EISCAT radar; red, violet and blue lines correspond to the elec-tron density profiles calculated for the H2O-1, H2O-2 and H2O-3
profiles, respectively.
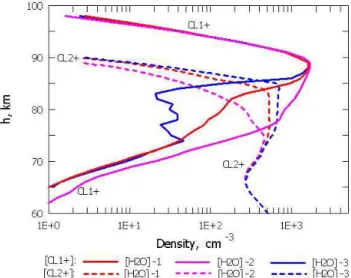
the ion composition. The vertical layer with Cl+2 proton hy-drates expands upward and the Cl+2 number density between 75 and 87 km increases when water concentration increases. The maximum Cl+2 concentration height progressively in-creases from 80 km for H2O-2 to 85 km for H2O-3. The
upper Cl+2 bound, with a numerical density of 100 cm−3,
is located between 85 and 88 km. A similar pattern, albeit less pronounced, is found for Cl+2 with a concentration of 10 cm−3. Therefore, the water vapour concentration increase in the entire mesosphere (transition from the H2O-2 profile to
the H2O-1 and H2O-3 profiles) leads to a reduction in the Cl+1
layer altitude range by shifting the Cl+1 layer lower border upward. For Cl+1, with a concentration of 10 cm−3, the lower border rises from 72.5 km to 75 km and 78 km. The lowest Cl+1 borders for with 100 cm−3are located at 76.5, 81.5 and 85 km. The Cl+1 layer upper border for a given numerical density does not depend on the water vapour concentration.
Specifically, the border is located at 96 km for Cl+1 = 10 cm−3 and at 94.5 km for Cl+1 =100 cm−3. The maximum Cl+1 nu-merical density is also independent of the water vapour con-centration and is located near 89 km. The decrease in the NO+and O+
2 molecular ion number densities below 87 km is
caused by the increased water vapour concentration (Fig. 5c). Figure 6a shows the altitude distribution for thef+ and
λparameters. The transit altitude for positive ions,hf+=1, is
located at approximately 89 km for any water vapour concen-tration. There are also deviations betweenf+ altitude pro-files for different water vapour concentrations below 87 km. Theλaltitude profile is the same for all water profiles; the
Fig. 5b. Number density profiles for the Cl+1 and Cl+2 positive ions cluster families for 16 June 2004 at 12:00 UT, with a solar zenith angle of 47.3◦and calculated for the H2O-1, H2O-2 and H2O-3
profiles.
Fig. 5c. Number density profiles for the O+2 and NO+molecular
ions for 16 June 2004 at 12:00 UT, with a solar zenith angle of 47.3◦ and calculated for the H2O-1, H2O-2 and H2O-3 profiles.
Variations in the effective recombination coefficient,αeff,
caused by changes in the water vapour concentration are shown in Fig. 6b. As shown in Fig. 5b, if the water concen-tration is low (H2O-2), the Cl+2 ions are dominant only up to
78 km (violet curve in Fig. 5b). Between 78 km and 87 km, the Cl+1 hydrate cluster ions become dominant. In this situ-ation, the effective recombination coefficient,αeff, decreases
from 1.2×10⁻⁵cm−3s−1at 75 km, i.e. closer to the dissocia-tive recombination coefficient of Cl+2, to 2.0×10⁻⁶cm−3s−1
at 87 km, i.e. closer to the dissociative recombination coeffi-cient of Cl+1 (violet curve in Fig. 6b). Using the H2O-1
pro-file results in the dominance of Cl+2 proton hydrates over a
Fig. 6a. Profiles forf+(solid lines) andλ=N−/Ne(dashed line)
for 16 June 2004 at 12:00 UT, with a solar zenith angle of 47.3◦and calculated for H2O-1, H2O-2 and H2O-3 profiles.
Fig. 6b. Effective recombination coefficient profiles for
16 June 2004 at 12:00 UT, with a solar zenith angle of 47.3◦ and calculated for the H2O-1, H2O-1a, H2O-2 and H2O-3 profiles
presented in Fig. 2.
broader altitude interval; the effective recombination coeffi-cient,αeff, is approximately 1.2×10⁻⁵cm−3s−1, i.e. close
to the dissociative recombination coefficient of Cl+2, at the altitudes up to 82 km (red curves in Figs. 5b and 6b). An in-crease in the water vapour concentration by approximately an order of magnitude compared to the H2O-2 profile at 84 km
Fig. 7a. Electron density profiles for 19 June 1969 at 15:00 UT, with
χ=43.2◦andF10.7=149, as measured by the rocket (black dotted
line) and calculated for H2O-1, H2O-1a, H2O-2 and H2O-3 profiles presented in Fig. 2.
H2O-3 profile) leads to only minor changes in the Cl+2
num-ber density, occurring only within a very narrow interval be-tween 82 and 86 km (blue curve in Fig. 5b). Water vapour concentration increases by a factor of 10 at 82 km and by a factor of 16 at 84 km relative to the H2O-1 profile, while
the Cl+2 number density increases by only 10 and 30 %, re-spectively. Inside this narrow vertical interval, the effective recombination coefficient increases again to approximately 1.2×10⁻⁵cm−3s−1. Above 85 km, the effective recombina-tion coefficient sharply decreases (a blue curve in Fig. 6b). Therefore, only minor changes in the electron number den-sity (approximately 10 %) occur between 82 and 86 km (blue curve in Fig. 5a). The modelling results show that there is an upper limit for water vapour concentration above which the effect of water vapour on the Cl+2 number density, the effec-tive recombination coefficient and electron density between 75 and 87 km ceases.
3.3 Case: 19 June 1969
The electron density profile measured by a rocket on 19 June 1969 (57.2◦N, −7.14◦E, 15:00 UT, χ=41.4◦,
F10.7=150) is shown in Fig. 7a (black curve). Electron
den-sity profiles have been modelled with NO-2d and all wa-ter vapour profiles presented in Fig. 2. The electron density profiles calculated with the H2O-1 and H2O-3 profiles are
closer to the experimental electron density profile at all alti-tudes. Moreover, electron number density variations associ-ated with differences between the H2O-1 and H2O-3 profiles
do not exceed 10 % at altitudes between 80 and 85 km. Altitude profiles of Cl+1 and Cl+2 number densities and
αeff for different water vapour concentrations are shown
Fig. 7b. Number density profiles for the Cl+1 and Cl+2 positive ions
cluster families for 19 June 1969 at 15:00 UT, with a solar zenith angle of 43.2◦,F10.7=149, and calculated for the H2O-1, H2O-2
and H2O-3 profiles.
Fig. 7c. Effective recombination coefficient profiles for
19 June 1969 at 15:00 UT, with a solar zenith angle of 43.2◦, F10.7= 149, and calculated for the H2O-1, H2O-1a, H2O-2 and H2O-3 profiles presented in Fig. 2.
in Fig. 7b and c. The profiles follow similar patterns to 16 June 2004.
3.4 Case: 12 August 1976
This case is very interesting for analysing modelled results because it describes simultaneous measurements of elec-tron number density, O+2 and NO+ molecular ions densi-ties, NO+.H2O water clusters and H+.(H2O)n=2,3,4proton
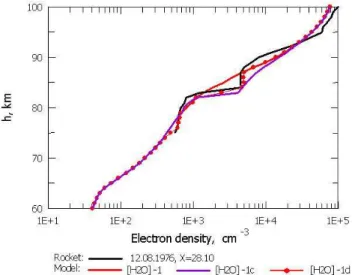
Fig. 8. Electron number density profile measured by Kopp and
Her-rmann (1984) for 12 August 1976 at 10:54 LT, with a solar zenith angle of 28.10◦(black line) and calculated for the H2O-1, H2O-1c and H2O-1d profiles presented in Fig. 11.
Fig. 9. Number density profiles for the NO+ and O+2 molecular
ions calculated for 12 August 1976 at 10:54 LT, with a solar zenith angle of 28.10◦using the H2O-1 (red lines without symbols) and
H2O-1d (red lines with symbols) profiles. The black lines represent
NO+(solid) and O+2 (dashed) profiles measured by Kopp and Her-rmann (1984).
activity index ofF10.7=78 with the NO-1d and H2O-1
pro-files are shown using red curves without symbols. The mod-elled electron number density and ion composition profiles are not able to reproduce the sharp gradients found in the experimental data. Because the gradients at 82 km are ob-served not only for electron number density but also for pos-itive ions, it is likely that these gradients may be caused by peculiarities in the water vapour altitude distribution.
Fig. 10a. Number density profiles of the Cl+1 positive cluster family
calculated for 12 August 1976 at 10:54 LT, with a solar zenith angle of 28.10◦using the H2O-1 (red line without symbols) and H2O-1d
(red line with symbols) profiles. The black line represents the num-ber density profile for the NO+.H2O hydrated cluster ion measured
by Kopp et al. (1978).
In this study we have attempted to select water vapour profiles that can reproduce experimental altitude profiles for electrons, O+2, NO+, Cl+1 and Cl+2, between 75 and 87 km. The H2O-1 profile was artificially modified into the H2O-1c
and H2O-1d profiles presented in Fig. 11. The H2O-1c
pro-file, with a sharp gradient of a few orders of magnitude above 82 km, reproduces a sharp gradient in the electron number density. However, the H2O-1c profile is not able to depict
the characteristic behaviour of the electron number density between 84 and 87 km. The H2O-1d profile reconstructs all
characteristic features for electrons (Fig. 8) and provides O+2 and NO+number densities that are close to the experimental data (Fig. 9).
Figure 10a shows the NO+.H
2O altitude profile observed
by Kopp et al. (1978) (black curve) and Cl+1 profiles mod-elled with the H2O-1 and H2O-1d profiles. The model
re-produces the upper boundary of the hydrate cluster layer fairly accurately. Disagreements between the experimental and modelled numerical hydrate cluster densities are likely related to the overestimates in modelled values because the model considers the sum of NO+and O+2 water clusters. Fig-ure 10b shows that the modelled and measFig-ured proton hy-drate densities between 80 and 85 km agree well; the proton hydrate layer upper border for number densities greater than 20 cm−3nearly coincides.
Fig. 10b. Number density profiles of the Cl+2 positive cluster family calculated for 12 August 1976 at 10:54 LT, with a solar zenith angle of 28.10◦using the H2O-1 (red line without symbols) and H2
O-1d (red line with symbols) profiles. The black line represents the number density profile for H+(H2O)3proton hydrates measured by Kopp et al. (1978).
4 Summary and conclusions
Using the PGI ion chemistry model, we have evaluated the efficiencies for channels forming hydrated cluster ions from the NO+ and O+
2 primary ions – i.e.B(NO
+)andB(O+
2),
respectively – and H+(H2O)n proton hydrates, B(Cl+1), at different altitudes in the ionospheric D region using the dif-ferent water vapour concentration profiles shown in Fig. 2. Below 60 km, the efficiency of NO+ion direct hydration is always higher than for indirect hydration. Moreover, above 60 km, the efficiency of NO+ direct hydration decreases sharply. Therefore, NO+.H
2O formation occurs primarily
via indirect hydration. Increased water vapour concentration above 60 km, from the H2O-2 profile to the H2O-1 profile,
increases the efficiency of NO+indirect hydration. The effi-ciency of O+2 ion direct hydration is always less than for indi-rect hydration. TheB(O+2)efficiency of the O+2 →O+2.H2O
channel, i.e. the efficiency of O+2 indirect hydration, depends on the water vapour concentration only above 70 km.
Below 70 km, the efficiency of the channel forming pro-ton hydrates,B(Cl+1), is higher thanB(NO+)andB(O+2)
for all water vapour concentrations. Above 70 km, the effi-ciency of the Cl+1 →Cl+2 channel is substantially less than
B(NO+)for low water concentrations. However, B(Cl+
1)
approaches B(NO+)with increased water vapour concen-tration (Fig. 3b). Changes of effective parametersB(NO+) and B(Cl+1) with a season (Figs. 4a, b) are mainly due to seasonal variations of the neutral mesospheric temper-ature (the winter tempertemper-ature is greater than the summer one). Since the effective parameter B(Cl+1) has a very
Fig. 11. Water number density profiles. The H2O-1 profile (red
line without symbols) was retrieved from the UARS measurements (http://haloe.gats-inc.com/home/index.php). The H2O-1c (violet
line) and H2O-1d (red line with symbols) profiles are modelled for 12 August 1976 at 10:54 LT, based on the measured electron num-ber density shown with a black line in Fig. 8.
Fig. 12. Effective recombination coefficient calculated for 12
Au-gust 1976 at 10:54 LT, with a solar zenith angle of 28.10◦and the H2O-1 (red line without symbols), H2O-1c (violet line) and H2
O-1d (red line with symbols) profiles.
increases (H2O-2→H2O-1→H2O-3), the proton hydrate
layer expands because its upper border moves upward. Therefore, the vertical interval of the Cl+1 layer decreases be-cause the layer’s lower border shifts upwards. The location of Cl+1 layer upper border does not change. These changes in the vertical distribution of the Cl+1 and Cl+2 layers cause growth of the proton hydrates Cl+2 concentration and strong variations in the effective recombination coefficient between 75 and 87 km (Fig. 6b, 7c, 12). As a result, variations in the water vapour concentration affect parameterf+(Fig. 6a) and the number densities of the primary positive ions (Figs. 5c, 9) and electrons (Figs. 5a, 7a, 8).
Increased water vapour concentration, from the H2O-2
profile to the H2O-1 profile, leads to increases inαdandαeff
(Fig. 6b, 7c) and consequently decreased electron number density between 75 and 87 km becauseαdis primarily
deter-mined by the dissociative recombination coefficient for pro-ton hydrates,αCl+
2. Outside this altitude range, the effective
recombination coefficient and the electron number density do not respond to large changes in the water vapour concentra-tion that occur at other altitudes in the mesosphere.
Furthermore, the subsequent large increase in the water vapour concentration during the H2O-1→H2O-3 transition
modifies the Cl+1 and Cl+2 number densities only within a very narrow altitude interval, i.e. between 82 and 86 km, and does not lead to substantial variations in either the effective recombination coefficient or electron number density. There-fore, the modelled results show that there are upper limits for water vapour concentration beyond which the Cl+2 and Cl+1 number densities, effective recombination coefficient and electron number density in the summer ionosphere are not sensitive to the subsequent increases in water vapour. In the applied model the water vapour concentration upper lim-its are described by a profile that is closer to the H2O-1
pro-file measured in the summer mesosphere by the UARS (http: //haloe.gats-inc.com/home/index.php). Moreover, the elec-tron density profiles modelled based on the H2O-1 profile
correlate well with the electron density measurements from 16 June 2004 and 19 June 1989.
For the event with the observed sharp gradients in posi-tive ion and electron number densities, we modelled a profile with an inhomogeneous water vapour distribution (the H2
O-1d profile in Fig. 11) that can reproduce the characteristic behaviour of ionospheric parameters. A sharp decrease in the water vapour above 82 km, shown by the H2O-1c profile in
Fig. 11, results in the disappearance of the proton hydrate layer (Fig. 10b), contradicting the observations of Kopp et al. (1978). Here, the effective recombination coefficient be-tween 82 and 88 km approaches the average dissociative re-combination coefficient,αd, for the NO+and O+2 molecular
ions, and the modelled electron density strongly exceeds the experimental values.
Under quiet geophysical conditions the theoretical model of the ionisation–recombination cycle in the D region can
be applied for studies of water vapour altitude distribution in the mesosphere. For the case study on 12 August 1976 it was shown that water vapour altitude profiles obtained on the basis of the experimental electron density profiles can be inhomogeneous. Such water profiles might explain sharp gradients in number densities of positive ions and electrons observed during the rocket experiments.
Acknowledgements. The authors thank the Education, Audiovisual
and Culture Executive Agency (EACEA) for support of this work within the frame of the Erasmus Mundus Master Course in Space Science and Technology – SpaceMaster, 2009–2013.
Topical Editor K. Hosokawa thanks two anonymous referees for their help in evaluating this paper.
References
Arnold, F.: The middle ionized component, Proc. ESA Symposium on rocket and balloon programmers, Boumemouth, 1980. Arnold, F. and Krankowsky, D. F.: Negative ions in the lower
ionosphere. A comparison of a model computation and mass-spectrometer measurements, J. Atmos. Terr. Phys., 33, 1693– 1702, 1971.
Albritton, D. L.: Ion-neutral reaction-rate constants measured in flow reactions through 1977, Atom. Data Nucl., 22, 1–101, 1978. Barabash, V., Osepian, A., Dalin, P., and Kirkwood, S.: Electron density profiles in the quiet lower ionosphere based on the results of modeling and experimental data, Ann. Geophys., 30, 1345– 1360, doi:10.5194/angeo-30-1345-2012, 2012.
Brasseur, G. and Salomon, S.: Aeronomy of the Middle Atmo-sphere, 2nd Edn., D. Reidel Publishing Company, Dorhrecht, Holland, 1986.
Brekke, A., Holt, O., Dickinson, P. H. G., Friedrich, M., Hansen, T., Stauning, P., and Thrane, E. V.: Development of D region elec-tron and ion densities under various auroral conditions during the Energy Budget Campaign (EBC), J. Atmos. Terr. Phys., 47, 101–121, 1985.
Chakrabarty, D. K., Chakrabarty, P., and Witt, G.: An attempt to identify the obscured paths of water positive ions build-up in the D region, J. Atmos. Terr. Phys., 40, 437–442, 1978.
Cosby, P. C., Moseley, J. T., and Peterson, J. R.: Photodissociation spectroscopy of O−3, J. Chem. Phys., 70, 2771–2778, 1978. Danilov, A. D. and Simonov, A. G.: A simplified model of the D
re-gion, Geomagn, Aeronomy, 1981.
Danilov, A. D. and Smirnova, N. V.: Ion composition and photo-chemistry of the lower thermosphere. 2. Ion composition of the D- and E-regions, Geomagn. Aeron., 33, 120–133, 1993. Danilov, A. D. and Smirnova, N. V.: Improving the 75 to 300 km
ion composition model of the IRI, Adv. Space Res., 15, 171–178, doi:10.1016/S0273-1177(99)80044-1, 1994.
Danilov, A. D. and Smirnova, N. V.: Comparison of the mid-latitude model with low-latitude ion composition data, Adv. Space Res., 31, 687–696, 2003.
Derblom, H. and Laddel, L.: D region parameters at high latitudes obtained from rocket experiments, J. Atmos. Terr. Phys., 35, 12, 2123–2130, 1973.
Dunkin, D. B., Fehsenfeld, F. C., Schmelrekopf, A. L., and Fergu-son, E. E.: Three-body association reactions of NO+with O2,
N2and CO2, J. Chem. Phys., 54, 3817–3822, 1971.
Fehsenfeld, F. C. and Fergusson, E. E.: Origin of water cluster ions in the D region, J. Geophys. Res., 74, 2217–2222, 1969. Fehsenfeld, F. C. and Fergusson, E.: Laboratory studies of negative
ion reactions with atmosphere trace constituents. Origin of water cluster ions in the D region, J. Chem., Phys., 61, 3181–3193, 1974.
Ferguson, E. E.: D region ion chemistry, Rev. Geophys. Space Phys., 9, 997–1008, 1971a.
Ferguson, E. E.: Laboratory measurements of D region ion-molecule reactions, in Mesospheric Models and Related Experi-ments, edited by: Flocco, G., Reidel Dordrecht, 188–197, 1971b. Ferguson, E. E.: Laboratory measurements of ionospheric ion-molecule reaction rates, Rev. Geophys. Space Phys., 12, 703– 713, 1974.
Ferguson, E. E.: D region ion chemistry, Rev. Geophys. Space Phys., 9, 997–1008, 1976.
Fritzenwallner, J. and Kopp, E.: Model calculations of the negative ion chemistry in the mesosphere with special emphasis on the chlorine species and the formation of cluster ions, Adv. Space Res., 21, 891–894, 1998.
Funke, B., Baumgaertner, A., Calisto, M., Egorova, T., Jackman, C. H., Kieser, J., Krivolutsky, A., López-Puertas, M., Marsh, D. R., Reddmann, T., Rozanov, E., Salmi, S.-M., Sinnhuber, M., Stiller, G. P., Verronen, P. T., Versick, S., von Clarmann, T., Vyushkova, T. Y., Wieters, N., and Wissing, J. M.: Composition changes af-ter the “Halloween” solar proton event: the High Energy Parti-cle Precipitation in the Atmosphere (HEPPA) model versus MI-PAS data intercomparison study, Atmos. Chem. Phys., 11, 9089– 9139, doi:10.5194/acp-11-9089-2011, 2011.
Gabriel, A., Körnich, H., Lossow, S., Peter, D. H., Urban, J., and Murtagh, D.: Zonal asymmetries in middle atmospheric ozone and water vapour derived from Odin satellite data 2001–2010, Atmos. Chem. Phys., 11, 9865–9885, 2011,
http://www.atmos-chem-phys.net/11/9865/2011/.
Grygalashvyly, M., Sonnemann, G. R., and Hartogh, P.: Long-term behavior of the concentration of the minor constituents in the mesosphere – a model study, Atmos. Chem. Phys., 9, 2779–2792, doi:10.5194/acp-9-2779-2009, 2009.
Gumbel, J. and Witt, G.: Cluster ions and ice particle nucleation: Positive feedback at the summer mesopause, J. Geophys. Res. Lett., 29, 29.1–29.4, doi:10.1029/2002GL015146, 2002. Hartogh, P., Sonnermann, G. R., Grygalashvily, M., Li Song,
Berger, U., and Lübken, F. J.: Water vapour measure-ments at ALOMAR over a solar cycle compared with model calculations by LIMA, J. Geophys. Res, 115, D00117, doi:10.1029/2009JD012364, 2010.
Haug, A. and Landmark, B.: A two-ions model of electron-ion re-combination in the D region, J. Atmos. Terr. Phys., 32, 405–407, doi:10.1016/0021-9169(70)90012-7, 1970.
Hedin, A. E.: Extension of the MSIS thermospheric model into the middle and lower atmosphere, J. Geophys. Res. 96, 1159–1172, 1991.
Hervig, M. and Siskind, D.: Decadal and inter-hemispheric variabil-ity in polar mesospheric clouds, water vapour, and temperature, J. Atmos. Terr. Phys., 68, 30–41, 2006.
Hodges, R. V., Lee, L. C., and Moseley, J. T.: Photodissociation and photodetachment of molecular negative ions, J. Chem. Phys., 72, 2998–3000, 1980.
Jackman, C. H. and Meade, P. E.: Effect of solar proton events in 1978 and 1979 on the odd nitrogen abundance in the middle at-mosphere, J. Geophys. Res., 93, 7984–7090, 1988.
Jackman, C. H., Cerniglia, M. C., Nielsen, J. E., Allen, D. J., Za-wodny, J. M., McPeters, R. D., Douglass, A. R., Rosenfield, J. E., and Rood, R. B.: 2D and 3D model simulations, measure-ments, and interpretation of the influence of the October 1989 solar proton events in the middle atmosphere, J. Geophys., Res., 100, 11641–11660, 1995.
Jackman, C. H., McPeters, R. D., Lanow, G. J., Fleming, E. L., Praderas, C. J., and Russel, M.: Northern hemisphere atmo-spheric effects due to the July 2000 solar proton event, Geophys. Res. Lett., 28, 2883–2886, 2001.
Jackman, C. H., DeLand, M. T., Labow, G. J., Fleming, E. L., Weisentein, D. K., Ko, M. K. W., Sinnhuber, M., Anderson, J., and Russell, J. M.: The influence of the several very large solar proton events in years 2000–2003 on the neutral middle atmo-sphere, J. Adv. Space Res., 35, 445–450, 2005.
Johannessen, A. and Krankowsky, D.: Positive-ion composition measurement in the upper mesosphere and lower thermosphere at high latitudes during summer, J. Geophys. Res., 77, 2888–2901, 1972.
Kazil, J., Kopp, E., Chabrillat, S., and Bishop, J.: The University of Bern Atmospheric Ion Model: Time dependent modelling of the ions in the mesosphere and lower thermosphere, J. Geophys. Res., 18, 4432, doi:10.1029/2002JD003024, 2003.
Kirkwood, S., Osepian, A., and Smirnova, N.: Quantitative descrip-tion of electron precipitadescrip-tion during auroral absorpdescrip-tion events in the morning and around noon local time sectors, J. Atmos. Sol.-Terr. Phys., 63, 1907–1921, 2001.
Kopp, E. and Herrmann, U.: Ion composition in the lower iono-sphere, Ann. Geophys., 2, 84–94, 1984,
http://www.ann-geophys.net/2/84/1984/.
Kopp, E., Eberhardt, P., and Hermann, U.: Summer daytime pos-itive ion composition in the D region above Wallop Island, in COSPAR: Space Research, Vol. XVIII, edited by: Mycroft, M. J. and Stickland, A. C., 245–248, Pergamon, New York, 1978. Kopp, E., Eberhardt, P., Hermann, U., and Björn, L. G.: Positive ion
composition of the high latitude summer D region with noctilu-cent clouds, J. Geophys. Res., 90, 148–227, 1985.
Krankowsky, D., Lämmerzahl, P., Götzelmann, A.: Positive ion composition in the lower ionosphere at high latitudes during MAP/WINE, J. Atmos. Terr. Phys., 49, 809–818, 1987. Kull, A., Kopp, E., Granier, C., and Brasseur, G.: Ions and electrons
of the lower-latitude D region, J. Geophys. Res.,102, 9705–9716, 1997.
Lopez-Puertas, M., Funke, B., Gil-Lopez, S., von Clarmann, T., Stiller, G. P., Höpfner, M., Kellmann, S., Mengistu Tsidu, G., Fischer, H., and Jackman, C. H.: HNO3, N2O5
and ClONO2 enhancements after the October–November
Lossow, S., Joachim, U., Eriksson, P., Murtagh, D., and Gumbel, D.: Critical parameters for the retrieval of mesospheric water vapour and temperature from Odin/SMR limb measurements at 557 GHz; Advances in Space Research, COSPAR, Elsevier Ltd, doi:10.1016/j.asr.2007.05.026, 2007.
Mitra, A. P. and Rowe, J. N.: Ionospheric effects of solar flares-IV, changes in D region ion chemistry during solar flares, J. Atmos., Terr. Phys., 34, 795–806, 1972.
Nacisi, R. S., Bailej, A. D., Della Lucca, L., Sherman, C., and Thomas, D. M.: Mass spectrometric measurements of negative ions in the D-e and lower E regions, J. Atmos. Terr. Phys., 33, 1147–1159, 1971.
Ogawa, T. and Shimazaki, T.: Diurnal variations of odd nitrogen and ionic densities in the mesosphere and lower thermosphere: simultaneous solution of photochemical-diffusive equations, J. Geophys. Res., 80, 3945–3960, 1975.
Osepian, A., Tereschenko, V., Dalin, P., and Kirkwood, S.: The role of atomic oxygen concentration in the ionization balance of the lower ionosphere during solar proton events, Ann. Geophys., 26, 131–143, doi:10.5194/angeo-26-131-2008, 2008.
Osepian, A., Kirkwood, S., and Dalin, P.: Influence of ozone con-centration on the lower ionosphere- modelling and measurements during the 29–30 October 2003 solar proton event, Ann. Geo-phys., 27, 577–589, 2009a,
http://www.ann-geophys.net/27/577/2009/.
Osepian, A., Kirkwood, S., Dalin, P., and Tereschenko, V.: D-region electron density and effective recombination coefficients during twilight – experimental data and modelling during solar proton events, Ann. Geophys., 27, 3713–3724, doi:10.5194/angeo-27-3713-2009, 2009b.
Picone, J. M., Hedin, A. E., Drob, D. P., and Aikin, A. C.: NRLMSISE-00 empirical model of the atmosphere: Statistical comparisons and scientific issues, J. Geophys. Res., 107, 1468, doi:10.1029/2002JA009430, 2002.
Reid, G. C.: The production of water cluster positive ions in the quiet daytime D region, Planet. Space Sci., 25, 3, 275–290, 1977. Reid, G. C.: Radar observations of negative-ion photodetachment at sunrise in the auroral- zone mesosphere, Planet. Space Sci., 35, 27–37, 1987.
Rishbeth, H. and Garriott, K.: Introduction to Ionospheric Physics, Academic Press, New York, 1969.
Rodrigo, R., Lopez-Moreno, J. J., Lopez-Puertas, M., Moreno, F., and Molina, A.: Neutral atmospheric composition between 60 and 220 km: A theoretical model for mid-latitudes, Planet. Space Sci., 34, 723–743, 1986.
Rohen, G., von Savigny, C., Sinnhuber, M., Liewellyn, E. J., Kauser, J. W., Jackman, C. H., Kallenrode, M. B., Schröter, J., Eich-mann, K.-U., BovensEich-mann, H., and Burrows, J. P.: Ozone de-pletion during the solar proton events of October/November 2003 as seen by SCIAMACHY, J. Geophys. Res., 110, A09S39, doi:10.1029/2004JAO10984, 2005.
Seppala, A., Verronen, P. T., Kyrölä, E., Hassinen, S., Backman, L., Hauchecorne, A., Bertaux, J. L., and Fussen, D.: Solar pro-ton events of Ocotber–November 2003: ozone depletion in the northern hemisphere polar winter as seen by GOMOS/Envisat, J. Geophys. Res. Lett., 31, L19107, doi:10.1029/2004GL021042, 2004.
Seppala, A., Verronen, P. T., Cilverd, M. A., Randall, C. E., Tamminen, J., Sofieva, V., Beckman, L., and Kyrölä, E.:
Arc-tic and AntarcArc-tic polar winter NOx and energetic particle
pre-cipitation in 2002–2006, J. Geopys. Res. Lett., 34, L12810, doi:10.1029/2007GL029733, 2007.
Shimazaki, T.: The photochemical time constants of minor con-stituents and their families in the middle atmosphere, J. Atmos. Terr. Phys., 46, 173–191, 1984.
Shimazaki, T. and Laird, A.: A model calculation of the diurnal vari-ation in minor neutral constituents in the mesosphere and lower thermosphere including transport effects, J. Geophys. Res., 75, 3221–3235, 1970.
Smirnova, N. V.: Modeling of the ionization-recombination cycle in the D region., Mathematical modelling of the complex processes, Academy of Sciences of the USSR, 22–34, 1982 (in Russian). Smirnova, N. V.: The D region during SP-events: the formation rates
of the positive cluster ions and negative ions. Ionospheric Re-search, Academy of Sciences of the USSR, 35, 67–75, 1983a (in Russian).
Smirnova, N. V.: The model of the ionization-recombination cycle in the D region, PhD thesis, VINITI, Academy of Sciences of the USSR, 1983b (in Russian).
Smirnova, N. V. and Vlaskov, V. A.: The negative ions in the iono-spheric D region, Preprint PGI-82-3-17, Apatity, 46, 1982a (in Russian).
Smirnova, N. V. and Vlaskov V. A.: Seasonal variations of the ion composition. Mathematical modelling of the complex processes, Academy of Sciences of the USSR, 83–96, 1982b (in Russian). Smirnova, N. V. and Vlaskov, V. A.: Aeronomic aspects of the D
re-gion winter anomaly, Preprint PGI-8, Apatity, 20, 1983 (in Rus-sian).
Smirnova, N. V., Ogloblina, O. F., and Vlaskov, V. A.: Modeling of the lower ionosphere, Pageoph., 127, 353–379, 1988.
Smith, D. and Church, M. J.: Ion-ion reaction rates in the earth’s atmosphere, Planet. Space Sci., 25, 433–439, 1977.
Smith, D., Adams N. G., and Church M. J.: Mutual neutralization rates of ionospherically important ions, Planet. Space Sci., 24, 697–703, 1976.
Smith, G. P., Lee, L. C., and Moseley, J. T.: Photodissociation and photodetachement of molecular negative ions. VII. Ions formed in CO2/O2/H2O/ mixtures 3500–5300 Å, J. Chem. Phys., 71,
4024–4031, 1979.
Singer, W., Latteck, R., Friedrich, M., Wakabayashi, M., and Rapp, M.: Seasonal and solar activity variability of D region electron density at 69◦N, J. Atmos. Terr. Phys., 73, 925–935, 2011. Solomon, S., Rusch, D. W., Gerard, J. C., Reid, G. C., and Crutsen,
P. J.: The effect of particle precipitation events on the neutral and ion chemistry of the middle atmosphere: II. Odd hydrogen, J. Planet. Space Sci., 29, 885–893, 1981.
Solomon, S., Reid, G. C., Roble, R. G., and Crutsen, P. J.: Photho-chemical coupling between the thermosphere and lower atmo-sphere, 2. D region ion chemistry and the winter anomaly, J. Geophys. Res., 87, 7221–7227, 1982.
Sonnemann, G. R., Grygalashvily, M., and Berger, U.: Autocatalytic water vapour production as asource of large mixing ratios within the middle to upper mesosphere, J. Geohys. Res., 110, D15303, doi:10.1029/2004JD005593, 2005.
meso-sphere/lowe thermosphere – a model study, Adv. Space Res., COSPAR, Elsevier Ltd., doi:10.1016/j.asr.2012.05.016, 2012. Summers, M. E., Conway, R. R., Englert, C. R., Siskind, D. E.,
Stevens, M. H., Russel, J. M., Gordley, L. L., and McHugh, M. J.: Discovery of a water vapour layer in the Arctic summer mesosphere: implications for polar mesospheric clouds, Geo-phys. Res. Lett., 28, 3601–3604, 2001.
Thomas, L.: NO+and water cluster ions in the D region, J. Atmos. Terr. Phys., 38, 61–67, 1976a.
Thomas, L.: Mesospheric temperatures and the formation of water cluster ions in the D region, J. Atmos. Terr. Phys., 38, 1235– 1250, 1976b.
Thomas, L. and Bowman, M. R.: A study of pre-sunrise changes in negative ions and electrons in the D-region, Ann. Geophys., 4, 219–228, 1986,
http://www.ann-geophys.net/4/219/1986/.
Turco, R. P. and Sechrist, C. F.: An investigation of the ionospheric D region at sunrise. 2. Estimation of some photodetachment rates, Radio Sci., 7, 717–724, 1972a.
Turco, R. P. and Sechrist, C. F.: An investigation of the ionospheric D region at sunrise. 1. Time variations of ozone, metastable molecular oxygen and atomic oxygen, Radio Sci., 7, 703–716, 1972b.
Turunen, E., Matveinen, H., and Ranta, H.: Sodankyla Ion Chem-istry (SCI) Model, Sodankyla Geophysical Observatory Report, No. 49, Finland, 1992.
Verronen, P. T. and Lehmann, R.: Analysis and parameterisa-tion of ionic reacparameterisa-tions affecting middle atmospheric HOx and
NOyduring solar proton events, Ann. Geophys., 31, 909–956,
doi:10.5194/angeo-31-909-2013, 2013.
Verronen, P. T., Turunen, E., Ulich, Th., and Kyrölä, E.: Modelling the effects of the October 1989 solar proton event on meso-spheric odd nitrogen using a detailed ion and neutral chemistry model, Ann. Geophys., 20, 1967–1976, doi:10.5194/angeo-20-1967-2002, 2002.
Verronen, P. T., Seppälä, A., Clilverd, M. A., Rodger, C. J., Kyrölä, E., Enell, C.-F., Ulich, T., and Turunen, E.: Diur-nal variation of ozone depletion during the October–November 2003 solar proton events, J. Geophys. Res., 110, A09S32, doi:10.1029/2004JA010932, 2005.
Verronen, P. T., Seppälä, A., Kyröla, E., Tamminen, J., Pickett, H. M., and Turunen, E.: Production of odd hydrohen in the meso-sphere during the January 2005 soplar proton event, Geopyys. Res. Lett., 33, L24811, doi:10.1029/2006GL028115, 2006. Verronen, P. T., Funke, B., Lopez-Puertas, M., Stiller, G. B., von
Clarmann, T., Glatthor, N., Enell, C.-F., Turunen, E., and Tam-minene, J.: About the increase of HNO3 in the stratopause
re-gion during the Halloween 2003 solar proton event, Geophys. Res. Lett., 35, L20809, doi:10.1029/2008GL035312, 2008. Verronen, P. T., Santee, M. L., Manney, G. L., Lehmann, R.,
Salmi, S. M., and Seppälä, A.: Nitric acid enhancements in the mesosphere during the January 2005 and December 2006 solar proton events, J. Geophys. Res., 116, D17301, doi:10.1029/2011JD016075, 2011.
Vlaskov, V. A., Osepian, A. P., Churikova, T. V., and Turunen, E.: Electron number densities in the auroral zone. Experiment and model, Geomagnetizm i Aeronomiia, 30, 143–146, 1990 (in Rus-sian).
Winkler, H., Kazeminejad, S., Sinnhuber, M., Kallenrode, M.-B., and Notholt, J.: Conversion of mesospheric HCl into ac-tive chlorine during the solarproton event in July 2000 in the northern polar region, J. Geophys. Res., 114, D00I03, doi:10.1029/2008JD011587, 2009.
Wisemberg, J. and Kockarts, G.: Negative ion chemistry in the ter-restrial D region and signal flow graph theory, J. Geophys. Res., 85, 4642–4652, 1980.