during Warfarin Initiation Therapy in Asian Patients
Based on Population
Pharmacokinetic-Pharmacodynamic Analyses
Minami Ohara1, Harumi Takahashi1*, Ming Ta Michael Lee2,4, Ming-Shien Wen3, Tsong-Hai Lee3, Hui-Ping Chuang4, Chen-Hui Luo1, Aki Arima1, Akiko Onozuka1, Rui Nagai1, Mari Shiomi1, Kiyoshi Mihara5, Takashi Morita6, Yuan-Tsong Chen4
1Department of Biopharmaceutics, Meiji Pharmaceutical University, Tokyo, Japan,2Laboratory for International Alliance on Genomic Research, RIKEN Center for Integrative Medical Sciences, Kanagawa, Japan,3Departments of Medicine and Neurology, Chang Gung Memorial Hospital and Chang Gung University College of Medicine, Taoyuan, Taiwan,4Institute of Biomedical Sciences, Academia Sinica, Taipei, Taiwan,5Faculty of Pharmacy, Center for Clinical Pharmacy, Musashino University, Tokyo, Japan,6School of Medicine, Juntendo University, Tokyo, Japan
Abstract
To clarify pharmacokinetic-pharmacodynamic (PK-PD) factors associated with the over-anticoagulation response in Asians during warfarin induction therapy, population PK-PD analyses were conducted in an attempt to predict the time-courses of the plasmaS-warfarin concentration, Cp(S), and coagulation and anti-coagulation (INR) responses. In 99 Chinese patients we analyzed the relationships between dose and Cp(S) to estimate the clearance ofS-warfarin, CL(S), and that between Cp(S) and the normal prothrombin concentration (NPT) as a coagulation marker for estimation of IC50. We also analyzed the
non-linear relationship between NPT inhibition and the increase in INR to derive the non-non-linear indexl. Population analyses accurately predicted the time-courses of Cp(S), NPT and INR. Multivariate analysis showed thatCYP2C9*3mutation and body surface area were predictors of CL(S), thatVKORC1andCYP4F2polymorphisms were predictors of IC50, and that baseline
NPT was a predictor ofl. CL(S) andlwere significantly lower in patients with INR$4 than in those with INR,4 (190 mL/h vs 265 mL/h, P,0.01 and 3.2 vs 3.7, P,0.01, respectively). Finally, logistic regression analysis revealed that CL(S), ALT and hypertension contributed significantly to INR$4. All these results indicate that factors associated with the reduced metabolic activity of warfarin represented by CL(S), might be critical determinants of the over-anticoagulation response during warfarin initiation in Asians.
Trial Registration:ClinicalTrials.gov NCT02065388
Citation:Ohara M, Takahashi H, Lee MTM, Wen M-S, Lee T-H, et al. (2014) Determinants of the Over-Anticoagulation Response during Warfarin Initiation Therapy in Asian Patients Based on Population Pharmacokinetic-Pharmacodynamic Analyses. PLoS ONE 9(8): e105891. doi:10.1371/journal.pone.0105891
Editor:Hugo ten Cate, Maastricht University Medical Center, Netherlands ReceivedApril 3, 2014;AcceptedJuly 23, 2014;PublishedAugust 22, 2014
Copyright:ß2014 Ohara et al. This is an open-access article distributed under the terms of the Creative Commons Attribution License, which permits unrestricted use, distribution, and reproduction in any medium, provided the original author and source are credited.
Data Availability:The authors confirm that all data underlying the findings are fully available without restriction. All relevant data are within the paper and its Supporting Information files.
Funding:This work was supported in part by grants from the Ministry of Education, Culture, Sports, Science and Technology of Japan (KAKENHI C, 20590548) and the Department of Health, Taiwan (DOH101-TD-PB-111-TM005). The funders had no role in study design, data collection and analysis, decision to publish, or preparation of the manuscript.
Competing Interests:The authors have declared that no competing interests exist. * Email: harumit@my-pharm.ac.jp
Introduction
Initiation therapy with warfarin has been hampered by two major problems, one of which is a large inter-individual variability in the maintenance dose and the other is an over-anticoagulation response leading to bleeding complications, especially before establishment of the maintenance dose. Genetic polymorphisms of
VKORC1and CYP2C9have been established as major determi-nants of inter-individual variability in the maintenance dose, especially in whites. [1,2] Accordingly, pharmacogenetic-based algorithms or a table and guidelines for estimating the initial dose of warfarin necessary for achieving a therapeutic International Normalized Ratio (INR) are currently available [3,4,5,6].
With regard to bleeding complications, although many clinical prediction scores/schemes including an age of.60–75 yr, labile INR, concomitant drugs, abnormal kidney/liver function and several complications, e.g., hypertension, have been reported, [7,8,9] validation studies have exhibited their insufficient predic-tive accuracies for routine use in practice. [10,11] Up to now, none of these bleeding prediction studies have considered the pharma-cokinetic-pharmacodynamic (PK-PD) related risk factors of warfarin for over- anticoagulation, except for one study [7] in which CYP2C9 mutation related to the low clearance of S -warfarin was included as a risk factor.
[12,13] recent two large prospective trials have evaluated the impact of genotype-based warfarin dosing on INR control in terms of the time within the therapeutic range during initiation therapy. [14,15] However, the results of these two studies were completely different. The EU-PACT study showed that genotype information clearly improved anti-coagulation control and the rate of INR$4. [14] On the other hand, the COAG study found no improvement in either anti-coagulation control or the rate of INR$4. [15] These trials have also shown that almost 20–30% of patients have experienced an over-anticoagulation response during induction therapy even after consideration of the two genotypes. [14,15] In addition to these observations, a previous study has reported that information on both genotypes, the early INR response and patients’ characteristics accounted for only 16% of inter-patient variability in the time required to reach INR.4, [16] indicating the involvement of currently unknown factors in the over-anticoagulation response to warfarin.
Furthermore, previous studies have reported the association of either of the variants of CYP2C9 and VKORC1, or their combination, with the risk of hemorrhage or an over-anticoagu-lation response in whites, but not in African Americans, [17,18] indicating that the predictability of risk for over-anticoagulation might be inconsistent among different races. Since Asians represent a highly homogeneous population with regard to the two genes (more than 80% of Asians possesses a combination of
CYP2C9*1/*1 and VKORC1*2/*2), we hypothesized that the contribution of genotypes to over-anticoagulation response would be different in Asians from that in the more heterogeneous white population.
Based on these previous observations, we considered that predictions of the time-course of the INR and contributors related to the PK-PD relationship after warfarin initiation would be of great clinical value for revealing factors responsible for the over-anticoagulation response, and accordingly we decided to employ a mechanism-based PK-PD approach using a population pharma-cokinetic technique. The goal of the present study was to clarify which parameter(s) of PK-PD of warfarin, including their predictors such as CYP2C9 and VKORC1 polymorphisms, contributes to the over-anticoagulation response during the induction therapy in Asian patients.
Methods
Patients
The present study (n = 99) represents part of a randomized prospective trial to compare genotype-guided (n = 77) [3,4,19] vs. standard warfarin dosing (n = 22) [20] conducted at outpatient clinics in Taiwan (Figure 1). [21] The entire date range for participant recruitment and follow-up was September 1, 2009– December 31, 2013 and samples analyzed in this study were collected from July 1, 2010 to February 1, 2012. Each patient received at least three fixed initial loading doses (1.5 times the predicted maintenance dose) of warfarin based on theirCYP2C9
and VKORC1genotypes by using either a dosing table (n = 18) [19] or dosing equations (n = 59), [3,4] or on the standard warfarin initiation protocol without reference to genetic information (n = 22). [20] A subsequent dosing titration was performed based on the INR in order to achieve target INR values of 2.0–3.0. The maintenance dose in this study was defined as the daily dose given to patients when two consecutive INR values measured at least one week apart were found to be controlled within the therapeutic range of 2 to 3, with no dose adjustments. Three bleeding complications (GI 1 case; eye 2 cases) occurred during the follow-up period. Demographic characteristics of patients were shown in
Table 1. Concurrent medications that might have affected warfarin metabolism included amiodarone (n = 6), rosuvastatin (n = 3), diltiazem (n = 16), and phenytoin (n = 2).
Study protocol
The protocol for this trial and supporting CONSORT checklist are available as supporting information; see Checklist S1 and Protocol S1. Blood sampling to measure the INR (8–13 points and 11.1 points on average) was performed at least 5 times before warfarin treatment, and at 4 days, and 1, 2 and 4 weeks after warfarin initiation with/without measurement of the plasma concentrations of warfarin enantiomers (Cp; 1–12 points and 9.2 points on average) and the fully carboxylated normal prothrombin concentration (NPT) as a biomarker of coagulation activity (4–12 points and 10.2 points on average). Thereafter, the patients were followed at least monthly for up to a maximum of 3 months. Separated plasma samples for analyses of Cp of warfarin enantiomers and NPT concentrations, and the buffy coat for DNA extraction, were stored at –80uuntil analysis.
Ethics Statement
The study protocol was approved by the respective IRBs of the participating hospitals, Academia Sinica, Taiwan, and Meiji Pharmaceutical University, Japan, and written informed consent was obtained from each patient. The study protocol was registered in ClinicalTrials.gov (NCT02065388). However, as the protocol did not involve the new drug, this study was not considered as a clinical trial in Taiwan, so that the study was started without registration.
Analyses of Cp of warfarin enantiomers and NPT concentrations in plasma
Cp of warfarin enantiomers was measured as reported previously. [22] The coagulation activity and anticoagulant effect of warfarin were assessed through measurement of the plasma NPT concentration by the carinactivase-1 method [23] and the INR value.
Genotyping forCYP2C9, VKORC1andCYP4F2
DNA was extracted using the PUREGENE DNA purification system (Gentra Systems, MN). Allelic variants of CYP2C9*3
(rs1057910; 1075 A.C),VKORC1*2(rs9923231;21639 G.A) and CYP4F2*3 (rs2108622; 1297 C.T) were determined by PCR-RFLP or Taqman analysis and confirmed by direct sequencing [19,24].
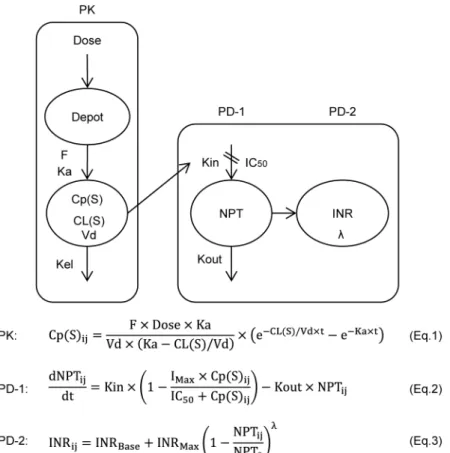
Relationships between Dose-Cp(S), Cp(S)-NPT and NPT-INR
Dose-Cp(S), Cp(S)-NPT and NPT-INR relationships (Figure 2) were analyzed using NONMEM version 7.2.0 (Icon Development Solutions, Ellicott City, MD). [25] The first-order conditional estimation (FOCE) method was used for all analyses of Dose-Cp(S), Cp(S)-NPT and NPT-INR relationships. Model selection was guided by the decrease in the objective function value (OFV). The model building was performed by the following three steps (Figure 2):
Cp(S)ij~F|Dose|Ka=Vd|(Ka{CL(S)=Vd)
|fexp({CL(S)=Vd|t)exp({Ka|t)g ð1Þ
where Cp(S)ijrepresents the Cp(S) in the ith individual at the jth observation, F is the bioavailability fixed at 1.0, Ka is the absorption rate constant fixed at 2 h21
and Vd is the volume of distribution of S-warfarin fixed at 13.8 L. [26] The inter-individual variability in CL(S) and the residual intra-individual variability in Cp(S) were estimated using an exponential model and an additive error model, respectively.
2) The time course of NPT concentration in response to an increase in Cp(S) after warfarin administration was described by an indirect model (Eq.2) to express the time delay between Cp(S) and NPT, in which NPT synthesis was assumed to be inhibited by the Emax model. [27] The population means and the inter-individual error of IC50and Kout, covariates of IC50 and the residual error of NPT were analyzed employing the ADVAN6 library.
dNPTij=dt~Kin|f1{(IMax|Cp(S)ij)=(IC50zCp(S)ij)g
{Kout|NPTij
ð2Þ Figure 1. Flow diagram of the randomized trial of the control and genotype groups.The patient numbers participated during the entire date range of the study were shown in parentheses and samples analyzed in this study were collected from 2010 to 2012.
where NPTijrepresents the NPT in the ith individual at the jth observation, Kin is expressed as Kout6NPT0(baseline NPT before warfarin administration), IMaxis the maximum decrease in NPT concentration assumed to be 1.0 (complete inhibition of NPT synthesis), Cp(S)ij is the Cp(S) in the ith individual at the jth prediction obtained using Eq.1, and IC50 is the Cp(S) that inhibits NPT synthesis at 50% of IMax. The inter-individual variabilities in IC50and Kout were estimated using exponential models, and the residual intra-individual variability in NPT was estimated by an additive error model. Three patients were excluded from the NPT analysis, because NPT0data were missing.
3) The time course of INR in response to a decrease in the plasma concentration of NPT after warfarin administration was described by a non-linear model based on the percentage
inhibition of NPT0, [21] and the population mean, the inter-individual error and covariates of the exponent l and the residual error of INR were analyzed using Eq.3: [21].
INRij~INRBasezINRMax|(1{NPTij=NPT0)
l ð3Þ
where INRijrepresents the INR in the ith individual at the jth observation, and INRBaseand NPT0 represent the baseline INR and NPT before warfarin administration, respectively. INRMax is the maximum INR increase from the baseline, which was set at 5 (the maximum INRij was fixed at 6), because the observed maximum INRijin 97.3% of the study patients was less than 6. The exponentlaccounts for the non-linear relationship between NPT inhibition and the increase in INR by warfarin. The inter-individual variability inland
Table 1.Patient demographics.
Variablea n = 99 INR
,4 (n = 64) INR$4 (n = 35) P-valued
Age (yr) 64.5615.2 60.7615.9 71.4610.8 0.002
Gender (F/M) 39/60 25/39 14/21 0.547
Body weight (kg) 68.4612.4 69.3612.4 66.7612.5 0.279
Height (cm) 163.668.2 164.667.7 161.968.9 0.104
Body surface area (m2) 1.74
60.18 1.7560.17 1.7160.18 0.111 Algorithm (Genotype/Standard) 77/22 (77.8%) 55/9 (85.9%) 22/13 (62.9%) 0.009
Starting dose (mg/day) 4.3460.98 4.3760.99 4.2860.96 0.709
Maintenance dose (mg/day)b 2.94
61.35 3.2661.31 2.3161.20 0.000
NPT0(mg/mL) 118.2622.1 119.0624.4 116.6617.4 0.777
INR0 1.0560.10 1.0560.11 1.0460.08 0.447
INRc 2.25
60.88 2.1060.62 2.5261.16 0.000
AST (IU/L) 29.2616.3 28.9616.7 29.8615.7 0.471
ALT (IU/L) 27.2617.5 23.9615.1 33.3620.2 0.011
Creatinine clearance (mL/min) 73.3636.6 80.0637.2 61.1632.6 0.009
Alcohol (+/2) 28/71 (28.3%) 23/41 (35.9%) 5/30 (14.3%) 0.018
Smoking (+/2) 20/79 (20.2%) 15/49 (23.4%) 5/30 (14.3%) 0.207
Complications
Diabetes mellitus (+/2) 19/80 (19.2%) 11/53 (17.2%) 8/27 (22.9%) 0.333 Hypertension (+/2) 66/33 (66.7%) 36/28 (56.3%) 30/5 (85.7%) 0.002 Hepatic disease (+/2) 10/89 (10.1%) 8/56 (12.5%) 2/33 (5.7%) 0.241 Chronic kidney disease (+/2) 16/83 (16.2%) 5/59 (7.8%) 11/24 (31.4%) 0.003 Indication
Atrial fibrillation 54 (54.5%) 27 (42.2%) 27 (77.1%) 0.001
Stroke 29 (29.3%) 16 (25.0%) 13 (37.1%) 0.150
Deep vein thrombosis 25 (25.3%) 22 (34.4%) 3 (8.6%) 0.003
Pulmonary embolism 8 (8.1%) 6 (9.4%) 2 (5.7%) 0.413
Coronary artery embolism 1 (1.0%) 1 (1.6%) 0 (0.0%) 0.646
Others 14 (14.1%) 9 (14.1%) 5 (14.3%) 0.598
Genotypes Wild/Hetero/Homo (MAF)
CYP2C9*3rs1057910 (1075 A.C) 88/11/0 (0.056) 59/5/0 (0.039) 29/6/0 (0.086) 0.141
VKORC1*2rs9923231 (–1639 G.A) 1/17/81 (0.904) 0/12/52 (0.906) 1/5/29 (0.900) 0.536
CYP4F2*3rs2108622 (1297 C.T) 50/43/6 (0.278) 28/32/4 (0.313) 22/11/2 (0.214) 0.054
aData are mean values
6SD or number (%).
bMaintenance doses were determined in 89 of 99 patients. cData are mean values of all measured INRs.
dP-value between the INR
the residual intra-individual variability in INR were estimated using an exponential model and a relative error model, respectively. Since NPT0data were missing in three patients, these patients were excluded from the INR analysis.
The adequacy of the model predictions was checked using visual diagnostic plots of the respective population and individual predicted values of Cp(S), NPT and INR versus the corresponding observed values, and the population predicted values versus the corresponding respective weighted residuals (Figure 3). The robustness of the model was assessed using a non-parametric bootstrap procedure in which means and 95% confidence intervals (95% CI) were obtained for population parameters using 1,000 re-sampling data sets for Cp(S) and INR and 100 re-re-sampling data sets for NPT (Table 2). The entire procedure was performed using Wings for NONMEM (Version 720, http://wfn.sourceforge.net) [28].
Predicted time courses of Cp(S), NPT and INR in the respective patients were depicted using hourly predicted individual values.
Multivariate analysis of predictors
The contribution of patients’ demographic predictors [i.e., age, body weight, BSA, body mass index, AST, ALT and CLcr as continuous variables, and sex, liver disease, chronic kidney disease, congestive heart failure, hypertension and history of alcohol or smoking as categorical variables] to CL(S), IC50 and l, respec-tively, was assessed by multivariate analyses using NONMEM. In addition, the effects of CYP2C9*3 on CL(S), VKORC1*2 and
CYP4F2*3on IC50, and NPT0 on l were also evaluated. For respective continuous variables, e.g., the effect of BSA on CL(S), the following two models (a power model and an exponential model) were examined;
CL(S)~CL(S)mean|(BSAindividual=BSAmedian)hBSA ð4Þ
CL(S)~CL(S)mean|expfhBSA|(BSAindividual{BSAmedian)g ð5Þ
Multivariate analyses to select significant predictors of CL(S), IC50 and l, respectively, involved a forward inclusion step (P, 0.05 as guided by the decrease in the OFV) for the full model and a backward deletion step (P,0.01 as guided by the increase in the OFV) to build up the final model.
Logistic regression analysis of factors associated with INR$4
The obtained PK-PD parameters and patients’ demographic covariates, described in the multivariate analysis section above, were evaluated as independent variables contributing to INR$4. After examining the internal correlations of each variable with CL(S) andl, forward and backward logistic regression analyses (SPSS version 17.0) were performed. Odds ratios (ORs) and 95% CIs of significant predictors associated with INR$4 during the initiation phase were obtained.
Statistics
Relationships between patients’ continuous demographic data and respective CL(S), IC50 and l values were examined by the Pearson correlation test. Comparisons between the median CL(S), IC50 and l obtained from patients with different categorical variables, those having differentCYP2C9,VKORC1andCYP4F2
genotypes, and those with/without an INR$4 were performed by the Mann-Whitney U test, respectively. The probability was compared using either the chi-squared test or Fisher’s exact test. The c-statistic was employed to quantify the predictability of the scheme obtained by logistic regression analyses. Data are
presented as means6 SD or medians and the upper and lower quartile ranges (25th and 75th percentiles) where appropriate. A two-tailed P-value of,0.05 was considered statistically significant for all analyses. All statistical analyses were performed using SPSS version 17.0.
Results
Patient characteristics
guided initiation doses of warfarin (initial dose; 4.161.0 mg/d for the Genotype group vs 5.0 mg/d for the Standard group, P, 0.001). The maintenance doses were defined in almost 90% of the patients during follow-up periods, and the maintenance dose in Chinese patients (2.961.4 mg/d) was lower than those reported in Caucasian and African American patients. [2] There were significant (P,0.05) correlations between age and body weight (r =20.358), body surface area (BSA) (r =20.397) and CLcr (r =20.568) (i.e., elderly patients had significantly lower body weight, BSA and CLcr). During the induction phase, 35% of the patients experienced an INR$4 (n = 35) and were significantly older and showed higher ALT and average INR and lower maintenance dose and CLcr (P,0.05). Patients with hypertension, chronic kidney disease and atrial fibrillation showed higher rates of INR$4 (ORs and 95% CIs; 4.7 (1.6–13.6), 5.4 (1.7–17.2), and 4.6 (1.8–11.7), respectively, P,0.01). The standard dosing group showed a higher rate of INR$4 (13/22, 59%) than the genotype group (22/77, 29%) (OR and 95% CI; 3.6 (1.4–9.7), P,0.01). No
differences were found in the initiating doses of warfarin between the INR$4 and,4 groups.
MAFs for the three genetic variants (CYP2C9*3, CYP4F2*3
andVKORC*2) were consistent with those reported previously in Asian populations. [29] No differences in the MAFs of the three respective variants were observed between the INR$4 and,4 groups.
Relationships between Dose-Cp(S), Cp(S)-NPT and NPT-INR
The three models were employed sequentially to predict INR response quantitatively by warfarin, as depicted schematically in Figure 2. Overlapped means and 95% CIs for population parameters obtained from the original data set and those from the bootstrap values are shown in Table 2. A visual predictive check of the 3 models of respective Cp(S), NPT and INR was demonstrated in the diagnostic plots (Figure 3; A–C). For further confirmation of goodness of model fitting, the predicted time
Table 2.Summary of population PK-PD parameters for Cp(S), NPT and INR.
Original data set Bootstrap value
Mean 95% CI Meana 95% CIb
PK estimates: Cp(S)
CL(S) (mL/h)c 240 220, 260 240 219, 260
Effect of BSA on CL(S) 2.14 1.12, 3.16 2.14 1.14, 3.23
Effect ofCYP2C9*3on CL(S) 0.543 0.374, 0.712 0.550 0.380, 0.723 Inter-individual error
vCL(S)(%) 39.9 31.3, 48.5 38.5 27.5, 49.2
Residual error
s(mg/mL) 0.0697 0.0676, 0.0718 0.0687 0.0557, 0.0834
PD-1 estimates: NPT
IC50(mg/mL)d 0.0725 0.0631, 0.0819 0.0719 0.0629, 0.0818
Kout (1/h) 0.0136 0.0121, 0.0151 0.0138 0.0123, 0.0155
Effect ofVKORC1*2on IC50 2.07 1.58, 2.56 2.11 1.58, 2.65
Effect ofCYP4F2*3on IC50 1.30 1.07, 1.53 1.32 1.11, 1.57
Inter-individual error
vIC50(%) 38.5 34.1, 42.9 37.1 31.5, 42.4
vKout(%) 45.6 32.9, 58.3 44.0 31.1, 58.1
Residual error
s(mg/mL) 12.2 216.6, 41.1 12.2 11.2, 13.4
PD-2 estimates: INR
INRMax(fixed) 5 - 5
-le 3.48 3.30, 3.66 3.48 3.31, 3.65
Effect of NPT0onl 0.00588 0.00304, 0.00872 0.00578 0.00283, 0.00867
Inter-individual error
vl(%) 24.1 21.6, 26.7 23.4 18.1, 28.9
Residual error
s(%) 24.7 23.9, 25.5 24.6 23.1, 26.2
aMean of 1,000 bootstrap analyses for PK and PD-2 estimates and mean of 100 bootstrap analyses for PD-1 estimates. bThe 2.5th and 97.5th values of the ranked bootstrap parameter estimates.
cCL(S) mL/h = 240
60.543CYP2C9*36(BSAindividual/1.74)2.14, where CYP2C9*3 = 0 in patients withCYP2C9*1/*1and CYP2C9*3 = 1 in patients withCYP2C9*1/*3. BSAmedianis
1.74 m2. dIC
50mg/mL = 0.072562.07VKORC1*261.30CYP4F2*3, where VKORC1*2 = 0 in patients withVKORC1*2/*2, VKORC1*2 = 1 in patients withVKORC1*1/*2, CYP4F2*3 = 0 in patients withCYP4F2*1/*1and CYP4F2*3 = 1 in patients withCYP4F2*1/*3orCYP4F2*3/*3.
el= 3.48
courses of Cp(S), NPT and INR and the observed values in the respective 34 or 35 patients with INR$4 (NPT0being missing in 1 patient) during the induction phase are shown in Figures S1–S3, respectively.
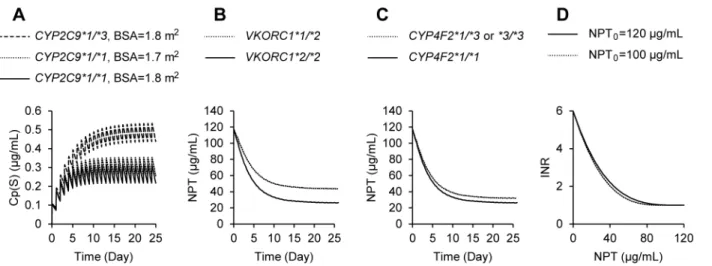
Predictors of the PK-PD parameters and their impacts BSA with the power model (Eq.4 in Methods) andCYP2C9*3
genotype were significant independent contributors to overall variability in CL(S), i.e., a 46% reduction in CL(S) for patients withCYP2C9*3relative to patients with the wild type and a 13% reduction in CL(S) per20.1 m2in BSA from 1.8 m2to 1.7 m2, which was roughly equivalent to a 210 kg reduction in body weight from 68 kg to 58 kg (height = 165 cm) (Table 2 &
Figure 4). Regarding the relationship between Cp(S) and NPT, genotypes of VKORC1*2 and CYP4F2*3 were extracted as significant predictors for IC50, i.e., IC50being 2.1 and 1.3 times larger in patients with theVKORC1*1/*2and CYP4F2*1/*3&
*3/*3 genotypes, respectively (Table 2 & Figure 4). In the relationship between NPT and INR, baseline NPT (NPT0) was selected as a significant predictor for the l value (Table 2 & Figure 4), the lower the NPT0, the smaller the non-linear indexl leading to a sharp increase in INR in response to the reduction of NPT after warfarin dosing. As shown in Figure 4, CYP2C9*3
mutation showed a stronger impact than that of BSA on CL(S), while mutation ofVKORC1*2had a greater influence than that of
CYP4F2*3on IC50[30].
Figure 4. Impacts of predictors extracted from PK-PD analyses.Influences ofCYP2C9*3mutation and body surface area (BSA) on CL(S) in the time courses of Cp(S) (A),VKORC1*2andCYP4F2*3on IC50in the time courses of NPT (B and C, respectively) and NPT0onlin the relationship between NPT and INR (D) were predicted in typical Chinese patients with a BSA of 1.77 m2(165 cm and 70 kg) after administration of racemic warfarin at 3.0 mg/d.
doi:10.1371/journal.pone.0105891.g004
Figure 5. Comparisons of PK-PD parameters between the INR$4 and,4 groups.Oral clearance ofS-warfarin, CL(S), IC50and the exponent
lwere compared between the two groups of patients with an INR of$4 and,4 during warfarin induction treatment. Data are shown as box-and-whisker plots. Thehorizontal lineindicates the median and the box covers the 25–75th percentiles.Closed circles(
N
) are outliers. **P,0.01 between the two groups.PK-PD factors contributing to INR$4 during the induction phase
In order to clarify the PK-PD step(s) contributing to over-anticoagulation by warfarin, individual estimates of CL(S), IC50 and l obtained by population analyses were compared between the INR$4 and,4 groups (Figure 5). This showed that patients with INR$4 had a 30% lower CL(S) (190 mL/h vs 265 mL/h, P,0.01) and a 14% lowerl(3.2 vs 3.7, P,0.01) than those with INR,4. However, no significant difference in IC50was observed between the two groups, being consistent with the similar frequencies of VKORC1*2 and CYP4F2*3 in both groups (Table 1).
Logistic regression analysis of factors associated with INR$4 during the induction phase
Four variables, i.e., a smaller CL(S), a greater log ALT, the presence of hypertension and absence of deep vein thrombosis, were extracted as those contributing significantly to INR$4 (Table 3). The sensitivity, specificity and c statistic of the constructed model were 51.4%, 81.3% and 0.796, respectively.
Discussion
On the basis of a population PK-PD approach, we obtained accurate predictions for the time courses ofS-warfarin, NPT and INR after warfarin induction (Figures 3 and S1–S3) and showed that the selected predictors of PK-PD for warfarin and their impact were consistent with previously reported data (Table 2 & Figure 4). [3,21,26] Most importantly, the present study is the first to demonstrate that CL(S) of warfarin, a PK determinant, and not PD factor of IC50, is a significant contributor to the over-anticoagulation response in Asian patients during induction therapy. This is consistent with a recent Chinese study that demonstrated an association of hemorrhagic complications with
CYP2C9*3genotype, shown to be the major PK predictor in the present study. [31] In addition to predictors of CL(S) found in the present study, e.g., the CYP2C9*3 variant and BSA, our data indicate that any factors associated with a reduction in CYP2C9 activity such as concomitant use of inhibiting drugs might potentially cause an over-anticoagulation response in Asians. Factors such as being elderly, a lower maintenance dose, higher ALT and chronic kidney disease shown in Table 1 could be potentially associated with the reduced CYP2C9 activity, thereby CL(S). These results indicate that INR should be monitored more carefully in patients receiving a lower maintenance dose of warfarin than in those receiving higher doses, as the former may be more likely to have a low CL(S).
Elderly patients are the main target population for warfarin treatment, because they have a higher risk of thrombosis, as indicated by the CHADS2/VASc score. [32,33] In addition, this
population has a higher bleeding risk, as shown by reported schemes/scores. [7,8,9] Although age was eliminated as a predictor for CL(S) andl, because of the correlation with BSA and NPT0, respectively, age was significantly correlated with CL(S) (r = –0.454, P,0.01) in our population, as has been reported for whites. [26] Age-dependent reductions in the synthesis of drug-metabolizing enzymes, such as CYP2C9 and coagulation factors, as well as in liver size, may lead to lower values of CL(S) and also NPT0, possibly resulting in a sharp increase of the INR. [21] Overall, these results indicate that elderly patients possess multiple risk factors for over-anticoagulation with warfarin. Therefore, further studies on INR management, in terms of the time within the therapeutic range and bleeding complications, are warranted, especially for elderly patients.
The majority of our patients were given genotype-based initial doses of warfarin. The PK-PD relationship (Dose-Cp-NPT-INR) and related parameters, such as CL(S) are independent of the initiating dosing protocol, either with or without genotype information, as long as the PK of warfarin shows linearity. However, INR control and the over- anticoagulation response might be influenced by the genotype-guided dosing. This possibility might reflect the fact that the genetic algorithm was less commonly employed in the patients with INR$4 than in those with INR,4 (62.9% vs 85.9%, P,0.01). Therefore, the contri-bution ofCYP2C9*3 orVKORC1*2to the over-anticoagulation response might have been underestimated in the present study, because more patients in the INR,4 group were started on warfarin doses adjusted already by their genotypes. We are currently analyzing patients data using the standard protocol to quantify the influences ofCYP2C9*3andVKORC1*2.
In this study, we were able to show that the PK process (CL(S)) is one of the main determinants of the over-anticoagulation response to warfarin in an Asian population. However, several studies have reported thatVKORC1, the major PD determinant, has more impact than CYP2C9 polymorphisms on early INR control and bleeding rates in white patients. [18,34] Population differences may exist in the relationships between not only dose and Cp(S) (the PK process), but also between Cp(S) and NPT (the PD process) among whites, African American and Asian populations, as we have reported previously. [2,35] In order to evaluate the applicability of our models constructed using data from Asian patients to white or African American patients, investigations of the PK-PD relationship for warfarin and associated predictors are essential in populations of differing ethnicity.
Supporting Information
Figure S1 Predicted time courses for the S-warfarin
concentration in plasma, Cp(S).These were depicted using
Table 3.Logistic regression analysis of predictors associated with INR$4.
Variable b OR (95% CI) P-value
Constant 22.817 0.060 0.074
S-warfarin clearance 20.006 0.994 (0.989, 0.999) 0.032
log ALT 2.124 8.368 (1.191, 58.798) 0.033
Hypertension 1.318 3.735 (1.171, 11.914) 0.026
Deep vein thrombosis 21.643 0.193 (0.049, 0.760) 0.019
individual predicted estimates of CL(S) obtained by the model analysis (Eq.1 in Method) in patients with an INR of$4 during the warfarin induction treatment (n = 35). Open circles (#) represent the observed values.
(TIF)
Figure S2 Predicted time courses for the normal prothrombin concentration in plasma, NPT. These were depicted using individual predicted estimates of CL(S), IC50and Kout by the model analyses (Eqs.1 & 2 in Method) in patients with an INR of$4 during the warfarin induction treatment. As NPT0 data was missing in one of the patients with an INR of $4, 1 patient was excluded from the analyses (n = 34).Open circles(#) represent the observed values.
(TIF)
Figure S3 Predicted time courses for the INR.These were depicted using individual predicted estimates oflobtained by the model analysis (Eq.3 in Method) in patients with an INR of$4 during the warfarin induction treatment. As NPT0 data was missing in one of the patients with an INR of$4, 1 patient was
excluded from the analysis (n = 34).Open circles(#) represent the observed values.
(TIF)
Protocol S1 Trial protocol.
(DOC)
Checklist S2 CONSORT Checklist.
(DOC)
Acknowledgments
We would like to thank Naoko Kaneko for her excellent technical assistance.
Author Contributions
Conceived and designed the experiments: HT MTML YTC. Performed the experiments: MSW THL HPC CHL AA AO RN. Analyzed the data: MO MS KM. Contributed reagents/materials/analysis tools: TM. Wrote the paper: MO HT.
References
1. Rieder MJ, Reiner AP, Gage BF, Nickerson DA, Eby CS, et al. (2005) Effect of VKORC1 haplotypes on transcriptional regulation and warfarin dose. N Engl J Med 352: 2285–2293.
2. Takahashi H, Wilkinson GR, Nutescu EA, Morita T, Ritchie MD, et al. (2006) Different contributions of polymorphisms in VKORC1 and CYP2C9 to intra-and inter-population differences in maintenance dose of warfarin in Japanese, Caucasians and African-Americans. Pharmacogenet Genomics 16: 101–110. 3. The International Warfarin Pharmacogenetics Consortium (2009) Estimation of
the warfarin dose with clinical and pharmacogenetic data. N Engl J Med 360: 753–764.
4. Gage BF, Eby C, Johnson JA, Deych E, Rieder MJ, et al. (2008) Use of pharmacogenetic and clinical factors to predict the therapeutic dose of warfarin. Clin Pharmacol Ther 84: 326–331.
5. Bristol-Myers Squibb. Coumadin (Warfarin Sodium) Tablets and Coumadin for Injection (application number NDA009218). http://packageinserts.bms.com/ pi/pi_coumadin.pdf. Accessed January 20, 2014.
6. Johnson JA, Gong L, Whirl-Carrillo M, Gage BF, Scott SA, et al. (2011) Clinical pharmacogenetics implementation consortium guidelines for CYP2C9 and VKORC1 genotypes and warfarin dosing. Clin Pharmacol Ther 90: 625–629. 7. Gage BF, Yan Y, Milligan PE, Waterman AD, Culverhouse R, et al. (2006) Clinical classification schemes for predicting hemorrhage: results from the national registry of atrial fibrillation (NRAF). Am Heart J 151: 713–719. 8. Fang MC, Go AS, Chang Y, Borowsky LH, Pomernacki NK, et al. (2011) A new
risk scheme to predict warfarin-associated hemorrhage: the ATRIA (Anticoag-ulation and risk factors in atrial fibrillation) study. J Am Coll Cardiol 58: 395– 401.
9. Pisters R, Lane DA, Nieuwlaat R, de Vos CB, Crijns HJ, et al. (2010) A novel user-friendly score (HAS-BLED) to assess 1-year risk of major bleeding in patients with atrial fibrillation: the Euro Heart Survey. Chest 138: 1093–1100. 10. Loewen P, Dahri K (2011) Risk of bleeding with oral anticoagulants: an updated systematic review and performance analysis of clinical prediction rules. Ann Hematol 90: 1191–1200.
11. Donze´ J, Rodondi N, Waeber G, Monney P, Cornuz J, et al. (2012) Scores to predict major bleeding risk during oral anticoagulation therapy: a prospective validation study. Am J Med 125: 1095–1102.
12. Connolly SJ, Pogue J, Eikelboom J, Flaker G, Commerford P, et al. (2008) Benefit of oral anticoagulant over antiplatelet therapy in atrial fibrillation depends on the quality of international normalized ratio control achieved by centers and countries as measured by time in therapeutic range. Circulation 118: 2029–2037.
13. Wallentin L, Yusuf S, Ezekowitz MD, Alings M, Flather M, et al. (2010) Efficacy and safety of dabigatran compared with warfarin at different levels of international normalized ratio control for stroke prevention in atrial fibrillation: an analysis on the RE-LY trial. Lancet 376: 975–983.
14. Kimmel SE, French B, Kasner SE, Johnson JA, Anderson JL, et al. (2013) A pharmacogenetic versus a clinical algorithm for warfarin dosing. N Engl J Med 369: 2283–2293.
15. Pirmohamed M, Burnside G, Eriksson N, Jorgensen AL, Toh CH, et al. (2013) A randomized trial of genotype-guided dosing of warfarin. N Engl J Med 369: 2294–2303.
16. Li C, Schwarz UI, Ritchie MD, Roden DM, Stein CM, et al. (2009) Relative contribution of CYP2C9 and VKORC1 genotypes and early INR response to the prediction of warfarin sensitivity during initiation of therapy. Blood 113: 3925–3930.
17. Limdi NA, McGwin G, Goldstein JA, Beasley TM, Arnett DK, et al. (2008) Influence of CYP2C9 and VKORC1 1173C/T genotype on the risk of hemorrhagic complications in African-American and European-American patients on warfarin. Clin Pharmacol Ther 83: 312–321.
18. Limdi NA, Wiener H, Goldstein JA, Acton RT, Beasley TM (2009) Influence of CYP2C9 and VKORC1 on warfarin response during initiation of therapy. Blood Cells Mol Dis 43: 119–128.
19. Wen MS, Lee M, Chen JJ, Chuang HP, Lu LS, et al. (2008) Prospective study of warfarin dosage requirements based on CYP2C9 and VKORC1 genotypes. Clin Pharmacol Ther 84: 83–89.
20. Tait RC, Sefcick A (1998) A warfarin induction regimen for out-patient anticoagulation in patients with atrial fibrillation. Br J Haematol 101: 450–454. 21. Ichimura Y, Takahashi H, Lee MT, Shiomi M, Mihara K, et al. (2012) Inter-individual differences in baseline coagulation activities and their implications for international normalized ratio control during warfarin initiation therapy. Clin Pharmacokinet 51: 799–808.
22. Takahashi H, Kashima T, Kimura S, Muramoto N, Nakahata H, et al. (1997) Determination of unbound warfarin enantiomers in human plasma and 7-hydorxywarfarin in human urine by chiral stationary-phase liquid chromatog-raphy with ultraviolet or fluorescence and on-line circular dichroism detection. J Chromatogr B Biomed Sci Appl 701: 71–80.
23. Yamada D, Morita T (1999) CA-1 method, a novel assay for quantification of normal prothrombin using a Ca2+
-dependent prothrombin activator, carinacti-vase-1. Thromb Res 94: 221–226.
24. Lee MT, Chen CH, Chou CH, Lu LS, Chuang HP, et al. (2009) Genetic determinants of warfarin dosing in the Han-Chinese population. Pharmacoge-nomics 10: 1905–1913.
25. NONMEM user’s guides. Beal SL, Sheiner LB: NONMEM Project Group, University of California San Francisco; 1994.
26. Hamberg AK, Dahl ML, Barban M, Scordo MG, Wadelius M, et al. (2007) A PK-PD model for predicting the impact of age, CYP2C9, and VKORC1 genotype on individualization of warfarin therapy. Clin Pharmacol Ther 81: 529–538.
27. Jusko WJ, Ko HC (1994) Physiologic indirect response models characterize diverse types of pharmacodynamic effects. Clin Pharmacol Ther 56: 406–419. 28. Parke J, Holford NH, Charles BG (1999) A procedure for generating bootstrap
samples for the validation of nonlinear mixed-effects population models. Comput Methods Programs Biomed 59: 19–29.
29. The National Human Genome Research Institute’s Haplotype Map Project. http://hapmap.ncbi.nlm.nih.gov/. Accessed 2014 January 20.
30. Danese E, Montagnana M, Johnson JA, Rettie AE, Zambon CF, et al. (2012) Impact of the CYP4F2 p.V433M polymorphism on coumarin dose requirement: systematic review and meta-analysis. Clin Pharmacol Ther 92: 746–756. 31. Ma C, Zhang Y, Xu Q, Yang J, Zhang Y, et al. (2012) Influence of warfarin
dose-associated genotypes on the risk of hemorrhagic complications in Chinese patients on warfarin. Int J Hematol 96: 719–728.
32. Gage BF, Waterman AD, Shannon W, Boechler M, Rich MW, et al. (2001) Validation of clinical classification schemes for predicting stroke: results from the National Registry of Atrial Fibrillation. JAMA 285: 2864–2870.
34. Lund K, Gaffney D, Spooner R, Etherington AM, Tansey P, et al. (2012) Polymorphisms in VKORC1 have more impact than CYP2C9 polymorphisms on early warfarin international normalized ratio control and bleeding rates. Br J Haematol 158: 256–261.
![Figure 4). [3,21,26] Most importantly, the present study is the first to demonstrate that CL(S) of warfarin, a PK determinant, and not PD factor of IC 50 , is a significant contributor to the over-anticoagulation response in Asian patients during inductio](https://thumb-eu.123doks.com/thumbv2/123dok_br/16405728.193992/9.918.93.836.117.259/importantly-demonstrate-determinant-significant-contributor-anticoagulation-patients-inductio.webp)
