CG Methylation Covaries with Differential
Gene Expression between Leaf and Floral Bud
Tissues of
Brachypodium distachyon
Kyria Roessler1, Shohei Takuno2, Brandon S. Gaut1*
1Department of Ecology and Evolutionary Biology, University of California Irvine, Irvine, California, United States of America,2SOKENDAI (Graduate University for Advanced Studies), Hayama, Kanagawa, Japan
Abstract
DNA methylation has the potential to influence plant growth and development through its influence on gene expression. To date, however, the evidence from plant systems is mixed as to whether patterns of DNA methylation vary significantly among tissues and, if so, whether these differences affect tissue-specific gene expression. To address these ques-tions, we analyzed both bisulfite sequence (BSseq) and transcriptomic sequence data from three biological replicates of two tissues (leaf and floral bud) from the model grass species
Brachypodium distachyon. Our first goal was to determine whether tissues were more dif-ferentiated in DNA methylation than explained by variation among biological replicates. Tis-sues were more differentiated than biological replicates, but the analysis of replicated data revealed high (>50%) false positive rates for the inference of differentially methylated sites (DMSs) and differentially methylated regions (DMRs). Comparing methylation to gene expression, we found that differential CG methylation consistently covaried negatively with gene expression, regardless as to whether methylation was within genes, within their pro-moters or even within their closest transposable element. The relationship between gene expression and either CHG or CHH methylation was less consistent. In total, CG methyla-tion in promoters explained 9% of the variamethyla-tion in tissue-specific expression across genes, suggesting that CG methylation is a minor but appreciable factor in tissue differentiation.
Introduction
The term‘epigenetics’refers to processes beyond (epi-) genetics and, more concretely, to heri-table chromosomal modifications that have the potential to vary during development and stress [1,2]. Epigenetic modifications include histone variants but also DNA methylation. In plants, the methylation of cytosines occurs in three sequence contexts: CG, CHG and CHH, where H = A, C or T. All three contexts are usually methylated in repetitive sequences, which serves to limit the transcription and proliferation of transposable elements (TEs) [3]. Genes are often also methylated, but typically only in the CG context [4–6]. The function of this gene-body methylation (gbM) is not yet clear, but potential functions include the exclusion of
OPEN ACCESS
Citation:Roessler K, Takuno S, Gaut BS (2016) CG Methylation Covaries with Differential Gene Expression between Leaf and Floral Bud Tissues of Brachypodium distachyon. PLoS ONE 11(3): e0150002. doi:10.1371/journal.pone.0150002
Editor:Shin-Han Shiu, Michigan State University, UNITED STATES
Received:October 15, 2015
Accepted:February 8, 2016
Published:March 7, 2016
Copyright:© 2016 Roessler et al. This is an open access article distributed under the terms of the
Creative Commons Attribution License, which permits unrestricted use, distribution, and reproduction in any medium, provided the original author and source are credited.
Data Availability Statement:All BSseq data are available in the Short Read Archive (accession nos. SRX208151–SRX208156)http://www.ncbi.nlm.nih.
gov/sra. All RNAseq data are available from the Short Read Archive (accession no. SRP063465)http:// www.ncbi.nlm.nih.gov/sra.
histone H2A.Z [7], control of aberrant intragenic expression [8], protection from transposable element (TE) insertion [9], and facilitation of intron-exon splicing [10–12].
DNA methylation has long been hypothesized to have a direct effect on gene regulation dur-ing development [13,14]. With the growing availability of single base resolution methylation data, like bisulfite sequencing (BSseq) data, this hypothesis has been tested directly. In humans, for example, DNA methylation varies dramatically throughout development, and this variation is often correlated with gene expression [15–18]. In plants, the available evidence suggests that methylation levels vary for highly specialized tissues, such as the endosperm and the pollen vegetative nucleus [19–22], and that this methylation variation likely contributes to genetic imprinting and trans-generational silencing of TEs [23–25].
Outside of these few specialized tissues, a clear picture has not yet emerged as to whether methylation commonly varies among plant tissues and, if so, whether methylation variation contributes to tissue-specific gene expression (GE). Some evidence suggests that most plant tis-sues do not vary substantially in DNA methylation. For example, genome-wide profiling in rice (Oryza sativaL.) identified few DNA methylation differences between shoot and root, and only a few additional differences in CHH methylation between these two tissues and the embryo [22]. Moreover, a survey of severalA.thalianaaccessions found that tissue-specific variation in methylation was much less pronounced than genetic variation, leading the authors to conclude that“. . .DNA methylation is less dynamic than gene expression patterns in plants
and only plays a role during specific stages of development or cell type, such as companion cells”[26].
In contrast to these studies, there is some emerging evidence that differential methylation may play a role in tissue specific GE. For example, researchers have detected ~2000 differen-tially methylated regions (DMRs) among four soybean tissues, and a subset of these DMRs cor-relate with tissue-specific GE of ~60 genes [27]. Similarly, analysis of tissue-specific DNA methylation patterns inSorghum bicolor [28],Populus tichocarpa[29] and maize (Zea mays
ssp.mays) [30] hint that epigenetic variation among vegetative tissues correlates with tissue-specific expression. However, not all of these studies have measured methylation at single-base resolution, which greatly limits the ability to draw firm conclusions; the number of contrasts of methylation between plant tissues is growing, but such studies remain rare.
Methodological differences among studies have also made conclusions difficult. For exam-ple, few methylation studies have employed biological replication, and thus it is usually unclear whether methylation variation between tissues exceeds the statistical variation expected from within a single sampled tissue. Even when the data are at single-base resolution, studies have used different summaries of the data as the basis for inferences, and this has caused confusion. Some studies have focused on summarizing methylation for genomic features like genes and TEs [31,32]. Other studies have focused on DMRs as a summary of the data. DMRs were ini-tially defined as stretches of DNA sequence for which methylation differences between samples were higher than expected at random [16]. While the initial definition of DMRs is straightfor-ward and meaningful, more recent studies have used empirical means, such as sliding windows, to identify DMRs, and these empirical definitions vary from study to study [27,33]. As a result, the interpretation and meaning of DMRs varies among studies, compromising the value of inferences.
This study is focused ultimately on the question of whether DNA methylation and GE covary between tissues. To that end, we have measured both DNA methylation and gene expression between two tissues (leaves and floral buds) ofBrachypodium distachyon (brachy-podium), a grass species that has served as a model for genomic studies [34]. While our ulti-mate goal is to assess methylation and GE, our proximal goals include an empirical assessment of the effects of replication both on inferring methylation differentiation between tissues and
was supported by NSF grant IOS-1542703 to BSG. The funders had no role in study design, data collection and analysis, decision to publish, or preparation of the manuscript.
on the impact of summary methods (i.e., DMRs vs. single-base metrics) on inferences. Overall, we find the two tissue samples to be significantly different in DNA methylation patterns, but we also find that the false positive rate without replication is high (>50%). In all respects,
DMRs are less useful than single-base or regional measures in our empirical analyses. Alto-gether, we find that CG methylation and GE covary between tissues, explaining up to 9% of variation in gene expression.
Results and Discussion
DNA Methylation within and between tissue samples
To assess methylation variation, we utilized BSseq data from a previous study [35] that gener-ated reads from three biological replicates of two tissues: leaf and immature flower buds. We denoted the leaf replicates as L1, L2 and L3 and the floral bud replicates as F1, F2 and F3. The data had conversion error rates of<1.3% for each replicate [35](S1 Table). Following the
previ-ous study, we mapped BSseq reads to theB.distachyongenome and tallied only uniquely map-ping reads. Each replicate yielded ~15X of mapped coverage, such that each tissue had ~45X coverage per base, on average [35].
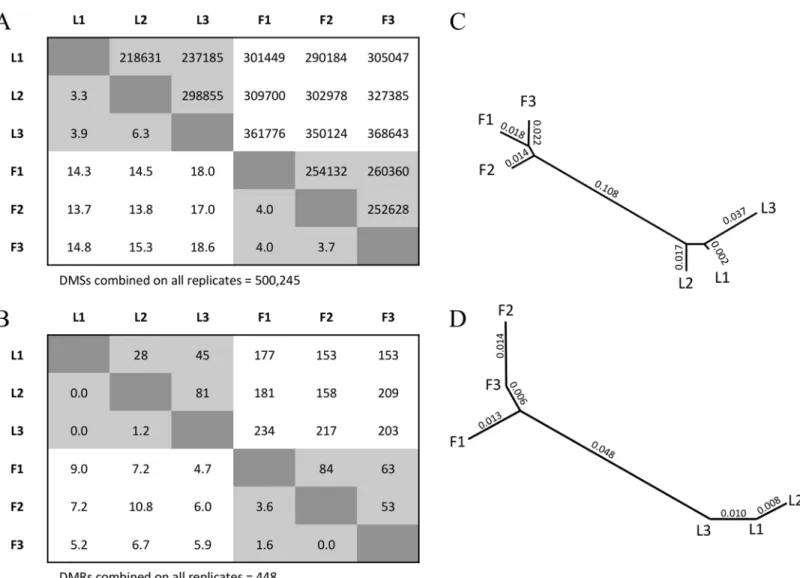
To our knowledge, no plant DNA methylation papers have assessed whether tissue-specific variation exceeds that expected from proper biological replication. To assess this question, we first tested for a signal of differentiation between two BSseq datasets at single nucleotide sites, which we call Differentially Methylated Sites (DMSs). To identify DMSs, we required a mini-mum coverage of 3 reads for each site in each tissue and then applied Fisher’s Exact Test (FET) [16] (seeMethods). There were many DMSs between two biological replicates from the same tissue. For example, there were 218,631 DMSs between L1 and L2 and an average of ~250,000 DMSs between two leaf replicates (Fig 1A). However, DMSs were more abundant between rep-licates from different tissues, with an average of ~324,000 differential sites (Fig 1A). The aver-age number of DMSs was significantly higher for between-tissue vs. intra-tissue comparisons (permutation,p<0.01), indicating that the tissue samples were significantly differentiated.
We also inferred DMSs by combining the three replicates within each tissue and then com-paring the combined leaf data (L1+L2+L3) to the combined floral data (F1+F2+F3). Using the combined replicates from each tissue, FET analyses identified 500,245 DMSs. Following a pre-vious study [36], we assumed these 500,245 DMSs to be our best estimate of“true”DMSs between tissues and found that this true set rarely overlapped in location with DMSs that were identified between replicates within a tissue; typically<5% of within-tissue DMSs overlapped
with the true set (Fig 1A). In contrast, the overlap was more significant, at 15.6% on average, between the true set and DMSs identified between replicates from different tissues (Fig 1A). These percentages define genetic distances between two BSseq replicates that can then be used for clustering analyses. A neighbor-joining analysis clearly separated replicates from different tissues (Fig 1B), further supporting the contention that the two tissue samples differ in DNA methylation beyond that expected from sampling.
The 15.6% average amount of overlap between the‘true’set of DMSs and the DMSs based on single replicates likely reflects, in part, lower statistical power for the single replicates. It is interesting to note, however, that comparisons between single-replicates also yield high false-positive rates (FPRs), which cannot be an artifact of higher statistical power with combined data. For example, the comparison of L3 and F3 replicates yielded 368,643 DMSs (Fig 1A). Of these, 92,989 (or 18.6%) overlapped with the set of true DMSs; hence, 81.4% of the DMSs iden-tified between these two replicates were not supported by the larger, combined data set. In other words, had we relied on a single replicate from each tissue for this study,>80% of our
can be reduced either by increasing the stringency of the FET or by adjusting the FET for mul-tiple-tests, but these adjustments do not help in this case. For example, when we focused on the L3 vs. F3 comparison and applied a false discovery rate (FDR) correction atq<0.05, we found
10,435 DMSs compared to 368,643 without FDR adjustment (Fig 1A). However, none of these DMSs overlapped with the true set, yielding an FPR of 100%.
A potential advantage of studying DMRs, as opposed to DMSs, is that they summarize sig-nals over contiguous sites, and it is thus possible that they reduce the FPR. As we have noted, the definition of a DMR varies widely among studies; here we focused on the original definition to define DMRs as a region of non-random differentiation between samples [16]. To determine expectations under‘randomness’, we permutated cytosine methylation states throughout the genome (seeMaterials & Methods); permutations indicated that5 DMSs in a row were 1.3% of those expected at random (S1 Fig). Accordingly, we defined a DMR as5 DMSs in a row
Fig 1. The inferred number of DMSs and DMRs between replicates.A) The upper matrix reports the number of DMSs between two BSseq replicates. The lower matrix reports the percentage of DMSs that map to the same location as the 500,245 DMSs inferred from the combined data sets. B) A neighbor-joining phylogeny representing the relationship among the six BSseq samples, based on distances defined by the lower matrix in A. C) The upper matrix reports the number of DMRs between two BSseq replicates. The lower matrix provides the percentage of DMRs that overlap with the 448 DMRs inferred from the combined data set. D) A neighbor-joining phylogeny representing the relationship among the six BSseq samples, based on distances defined by the lower matrix in C.
that had a consistent direction of methylation bias (i.e., hypomethylated in one or the other tis-sue). These DMRs contain 2,672 DMSs, which is a small percentage (0.5%) of the total set of 500,245 DMSs (Table 1), indicating that DMSs are rarely clustered across the genome more than expected at random.
With this definition, we again observed more DMRs between tissues (187, on average) than within tissues (59, on average)(Fig 1C), and this difference was again statistically significant (permutation,p<0.01). By combining data (L1+L2+L3 vs. F1+F2+F3), we inferred a‘true’set
of 448 DMRs with an average size of 38.4 bp, a minimum length of 5.00 bp and a maximum length of 522 bp. For DMRs, 1.0% of within-tissue DMRs overlapped on average with the true set, whereas 6.9% of between-tissue DMRs overlapped with the true set on average. These dis-tances again separated the tissues in clustering analyses (Fig 1D), verifying significant tissue differentiation. However, the between-tissue FPR based on single BSseq replicates was consis-tently higher for DMRs than for DMSs, with aminimumFPR of 89.2%. In other words, ~80% or more of our DMR inferences were incorrect for contrasts between single replicates relative to the more extensive dataset.
This raises the question as to why the FPR is so high and whether our observations are unique. To answer the latter question, to our knowledge only one other study of plants has used biological replication for BSseq data to compare methylation betweenArabidopsis thali-anaandA.lyrata[37]. (At least one other paper replicated their control but not experimental samples [38].) In theArabidopsis paper, the authors used replication to help filter the number sites for testing, thus reducing the multiple test problem and increasing statistical power. They did not, however, explicitly report on the level of within vs. between tissue differences. To address the former question, the FPR may be high for technical, statistical and/or biological reasons. Technically, BSseq data are subject to conversion error, but conversion errors are unlikely to explain our observations because coverage is high and conversion error is low. Sta-tistically, it is easy to envision that the FET may signal numerous false-positives, but the FPR remains high for DMSs when the FET is FDR corrected [39], as noted above. Finally, biological variation among replicates may contribute to the FPR, both because tissue samples are likely to include mixtures of different cell types that vary in proportion among replicates [40] and also because it is likely that there is heterogeneity in methylation levels even among cells of a single type [41]. We thus suspect, but cannot prove, that the largest contribution to variation among replicates is biological in origin.
Our FPR calculations deserve two further comments. First, the FPR calculations rely on the assumption that the set of‘true’DMSs and DMRs are defined by our analysis of combined data. This assumption cannot hold fully because there must be false-positives in the combined data, but the FPR rate of the combined data are difficult to assess. Second, we note that as levels of methylation differentiation become more pronounced, the signal:noise ratio will also increase. Thus, our data reflect the importance of replication for contrasts between tissues in the same species; however, it may not be as useful to replicate data that are designed to summa-rize broad-scale differences in methylation patterns between distantly related species [31,32].
Differences in methylation patterns between tissues
Given that we found tissue-specific differentiation between leaves and floral buds, we sought to categorize the pattern of methylation differences, both in terms of cytosine contexts and geno-mic locations. For these results, we based all analyses on combined leaf (L1+L2+L3) and floral (F1+F2+F3) data, following [36].
between the two tissues–i.e., Conserved Methylated Sites (CMSs). To be a CMS, a site required the support of a binomial test [5] at ap-value of 0.05 in both tissue samples. Overall, we found that 18,780,682 cytosines were methylated in both tissues (Fig 2A;Table 1), representing 18.7% of the 100,229,480 genomic cytosines in the proper context for methylation (i.e., CG, CHG or CHH). Among CMSs, most (62.7%) were in the CG context, with an appreciable minority in the CHG context (29.8%) and relatively few in the CHH context (7.5%). Overall, the set of CMSs and DMSs were mutually exclusive, and there were 37-fold more CMSs (Fig 2A;Table 1). Other stud-ies have also found more similaritstud-ies than differences among plant tissue samples [22,27].
Our second finding was that most variation between tissues occurred at CHG sites. Cyto-sines were most commonly methylated in the CG context, but 56.5% (282,440 sites) of DMS sites occurred in the CHG context (Table 1;Fig 2A). To investigate further, we estimated the DMS‘rate’by comparing the observed number of DMSs to the available number of cytosines in a particular context. For example, there were 19,722,162 cytosines in the CHG context throughout the genome and a total of 282,440 DMSs, yielding a rate of 1.43% (Table 1). In con-trast, CG and CHH methylation had lower rates, at 0.55% and 0.17%, respectively (Table 1). CHH methylation may not be as differentiated in part because the overall proportion of meth-ylated CHH sites was much lower than CG or CHG sites. Interestingly, the direction of DMSs was biased, because 57% were methylated in floral buds but not leaf, representing a deviation from the expectation of equality (binomial, p<10−15).
Our observation that variability between tissues was highest at CHG sites is similar to com-parisons among rice tissues [22] and among somaclonal variants of oil palm [42]. Similarly, in
Arabidopsisspecies tissue-specific differences were attributable to CHH and CHG methylation changes within DMRs [37]. However, CG methylation varies more than CHH or CHG methyl-ation among tomato developmental stages [43] and also between generations ofA.thaliana mutation accumulation lines [39]. Thus, the principle context of DNA methylation variability varies either as a function of species or the tissues sampled.
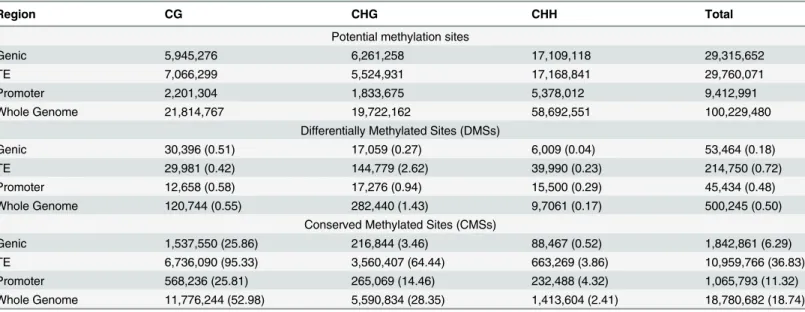
Table 1. The number of potential methylation sites, DMSs and CMSs in each of three sequence contexts (CG, CHG and CHH) throughout the entire brachypodiumgenome and also for three features separately (Genes, Promoters and TEs).
Region CG CHG CHH Total
Potential methylation sites
Genic 5,945,276 6,261,258 17,109,118 29,315,652
TE 7,066,299 5,524,931 17,168,841 29,760,071
Promoter 2,201,304 1,833,675 5,378,012 9,412,991
Whole Genome 21,814,767 19,722,162 58,692,551 100,229,480
Differentially Methylated Sites (DMSs)
Genic 30,396 (0.51) 17,059 (0.27) 6,009 (0.04) 53,464 (0.18)
TE 29,981 (0.42) 144,779 (2.62) 39,990 (0.23) 214,750 (0.72)
Promoter 12,658 (0.58) 17,276 (0.94) 15,500 (0.29) 45,434 (0.48)
Whole Genome 120,744 (0.55) 282,440 (1.43) 9,7061 (0.17) 500,245 (0.50)
Conserved Methylated Sites (CMSs)
Genic 1,537,550 (25.86) 216,844 (3.46) 88,467 (0.52) 1,842,861 (6.29)
TE 6,736,090 (95.33) 3,560,407 (64.44) 663,269 (3.86) 10,959,766 (36.83)
Promoter 568,236 (25.81) 265,069 (14.46) 232,488 (4.32) 1,065,793 (11.32)
Whole Genome 11,776,244 (52.98) 5,590,834 (28.35) 1,413,604 (2.41) 18,780,682 (18.74)
Numbers in parentheses represent the percentage of sites in context that are methylated. Those sites that are not DMSs or CMSs either lack evidence of methylation in both tissues or do not have a significant FET.
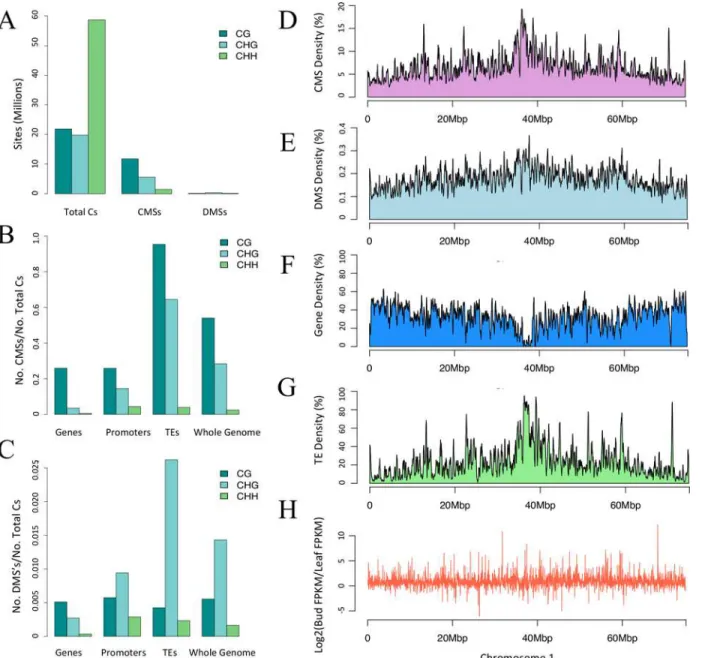
Having assessed the effect of context, we shifted our attention to three genomic features of interest: genes, promoters and transposable elements (TEs). Among the three features, the set of 68,264 non-genic, annotated TEs had the highest CMS rates (Fig 2B), as was expected from previous studies of plant genomes [39,44], with methylation levels of 95.3% at CG sites and 64.4% at CHG sites (Table 1;Fig 2B). That said, TEs also had the highest DMS rates, at 2.62% in the CHG context (Table 1;Fig 2C). CHH methylation levels were low (<5%) throughout
TEs, as noted previously for the entire brachypodium genome [35]. In contrast to TEs, the 26,072 annotated genes had the lowest DMS rate at 0.18% (Table 1;Fig 2C), but this low rate
Fig 2. Context, direction, and regions of CMSs and DMSs.A) The number of sites in the correct context for methylation throughout the genome (Total Cs), along with the number of CMSs and DMSs in context. B) The proportion of CMSs relative to cytosines in the correct context for Genes, Promoters, TEs and the Whole Genome. C) The proportion of DMSs relative to cytosines in the correct context for Genes, Promoters, TEs and the Whole Genome. Note the difference in the scale of they-axis between panels B and C. D to F) The graphs show the CMS, DMS, gene and TE density along chromosome 1. Density was measured within a 50kb sliding window for smoothing. H) Differential gene expression plotted along the physical length of chromosome 1. The other chromosomes are represented inS2 Fig.
may reflect the fact that genes were primarily methylated in the CG context, which had the lowest DMS rates. Promoter regions, which were defined as 1.0 kb 5’upstream of the 26,072 genes, had noticeably higher levels of conserved CHG methylation between tissues (at 14.5%) than genes (3.46%), but were similar to genes in most other respects (Fig 2;Table 1).
Given that CMSs and DMSs were especially prominent in TEs, it was not surprising that the distribution of CMSs and DMSs across chromosomes mimicked the density of TEs (Fig 2and
S2 Fig), and there was no obvious correlation between CMSs and DMSs with gene density (Fig 2GandS2 Fig). Altogether, the analysis of single sites paints a clear picture: most methylation occurred in TEs and most variation between tissues was within TEs in the CHG context.
Finally, we examined the pattern and location of the 448 DMRs identified between tissues to assess whether they paralleled results based on single sites. First, 65% of DMRs were hypo-methylated in floral buds (p<0.01), verifying increases in overall methylation in this tissue.
Second, although most DMSs were found in the CHG context (Fig 2C), we found that 67% of the DMSs within all of our DMRs were sites in the CHH context. This observation suggests that there may be a spatial (clustered) context to the mechanisms that underlie CHH differ-ences between tissues, consistent with the observation in maize that CHH sites tend to be clus-tered [44]. Finally, the location of DMRs was biased: 39% of DMRs were found in unannotated regions of the genome, but 31% were found within TEs, 17% within genes and 13% within pro-moter regions. Given that the total number of cytosine sites within TEs and within genes was similar, at ~29 million bases (Table 1) each, the lower percentage in genes again indicates that genic methylation is more highly conserved between tissues than methylation of TEs.
Methylation & Gene Expression
The primary goal of this paper is to determine whether methylation differentiation between tis-sues covaries with GE. The idea that GE and methylation covary traces back to the origin of epigenetics [45] and seems to be upheld by weak signals from plant data [27,43].
Gene expression data. To measure GE, we generated RNAseq data from leaf and floral tis-sues, using the same three plants and samples (biological replicates) that were used to generate BSseq data (seeMethods). Each of the replicates had>12 million RNAseq reads that mapped
uniquely to theB.distachyongenome (S2 Table). Out of 26,552 annotated protein-coding genes, we retained 26,072 that did not overlap with annotated TEs, of which 19,956 had evi-dence of expression in at least one tissue, as determined by a cutoff of FPKM>0.02 (see
Mate-rials and Methods). Second, we identified differentially expressed genes between tissues at an FDR ofq<0.01 (S3 Fig). A total of 7,704 genes were significantly differentially expressed
between leaf and floral tissue; these exhibited no obvious clustering by chromosomal position (Fig 2HandS2 Fig). GO analyses of differentially expressed genes suggested enrichment for functions in membrane and microtubule development (S3 Table).
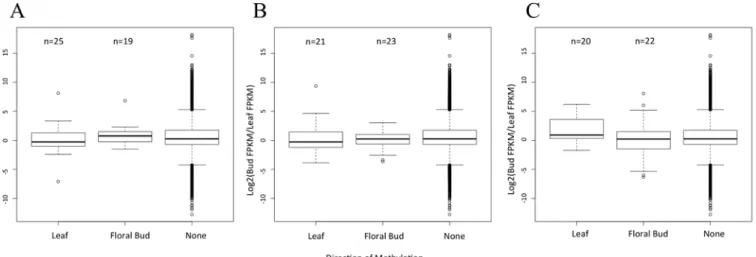
Thinking that we may have missed an important signal by focusing on the entire genome, we delved into the three genomic features separately. For each feature, we focused on DMRs that were hyper-methylated in one vs. the other tissue. For example, we tallied DMRs within 25 genes that were hyper-methylated within floral buds. For this set of 25 genes, we predicted lower GE in floral than leaf tissue. Similarly, for the 19 genes that had a methylated DMR in leaf but not floral tissue, we predicted lower GE in leaf. These predictions were not upheld by the data, however (Fig 3A). In fact, the average level of differential expression did not vary among genes that had a hyper-methylated DMR in floral bud, a hyper-methylated DMR leaf or no DMR whatsoever (Fig 3A). We repeated this analysis for promoter regions of 1.0 kb 5’
upstream of genes, and again found no discernible pattern (Fig 3B). Finally, because the meth-ylation of TEs may effect the expression of nearby genes [3,46], we also examined DMRs within annotated TEs closest to a gene. Again, there was no signal (Fig 3C). While the lack of signal may reflect low sample sizes, the presence of DMRs did not correlate with differential GE between the two tissues.
The proportion of converted reads. To investigate covariation between GE and methyla-tion more thoroughly, we turned to a measure of DNA methylamethyla-tion that summarizes the pro-portion of non-converted reads over the total number of reads at cytosine residues in the proper contexts (CG, CHG or CHH) [32]. This measure, which we callpropC, can be applied to
the entire genome, to specific genomic features or to specific contexts (e.g.,propCG,propCHG,
propCHH). For example, over the entire genome,propcwas estimated to be 0.1815 for leaf tissue
and 0.1823 for floral bud tissue throughout the entire genome, suggesting again (very) slightly higher levels of methylation in floral bud tissue. Thepropmeasures provide an estimate of the methylation level for a region, but without a corresponding measure of significance. We focus on the use of these measures for the remainder of our analyses.
GE and Genic Methylation. To better understand patterns of methylation within genes, we first assessed the relationship amongpropCG,propCHG, andpropCHHwithin a tissue, using
correlation analyses. In brief, all are significantly correlated with one another, withrvalues
Fig 3. Gene expression with respect to DMRs and their direction.A) A graph of the distribution of gene expression when a DMR is located within a gene and hypermethylated in the Leaf or Floral Bud, or when there is no DMR in the gene (None). For the 25 genes hypermethylated in leaf, we predicted positive values on they-axis, signaling higher expression in floral bud, but no bias was detected. For the 19 genes hypermethylated in floral bud, we predicted negative values on they-axis, signaling higher expression in leaf, but again no bias was detected. B) The same graph of differential expression when the gene contains a DMR in its a promoter region. Again, there are no detectable biases in the direction of gene expression relative to genes that do not contain a DMR in their promoter region. C) A graph of differential gene expression when the TE nearest to a gene has a DMR that is hypermethylated in leaf, flower or no (None) DMR. For all graphs, the box plots represent the median, first, and third quartile. The whiskers represent the minimum and maximum, The numbers above the graph refer to sample size in each category.
ranging from 0.43 to 0.61 (Table 2). However,propCGandpropCHGwere positively correlated
in a somewhat striking pattern: CHG methylation was often present but rarely higher than CG methylation (i.e., in only 3,424 of 26,072 genes) (Fig 4A). This observation reaffirms that meth-ylation in the CG context is predominant for genes [4,5,47] but also illustrates that genic meth-ylation is not limited to the CG context [48].
Given that CG methylation is the primary component of genic methylation, we compared
propCGto GE within a tissue. Previous work has shown that the relationship between GE and
gene body methylation is complex [5]. In general, methylated genes have intermediate levels of expression, such that hypo-methylated genes are both more-highly and less-highly expressed than hyper-methylated genes [32,47,49]. As expected, GE and genic methylation were corre-lated within tissues (r= 0.287;p<2.2e-16;Table 2), but in a complex pattern (Fig 3B).propCHG
andpropCHHwere also correlated with GE but at lower levels (r= 0.046,p= 1.21x10⁻¹³and
r= 0.073,p<2.2x10⁻¹⁸).
Lastly, we compared differential methylation to differential GE between tissues, focusing on either all of the 19,956 genes or just the 7,704 that were significantly differentially expressed. Differential GE and methylation were not correlated withpropC,propCHHorpropCHG(Table 3;
Fig 3C) but were correlated between CG methylation and differential expression of the subset
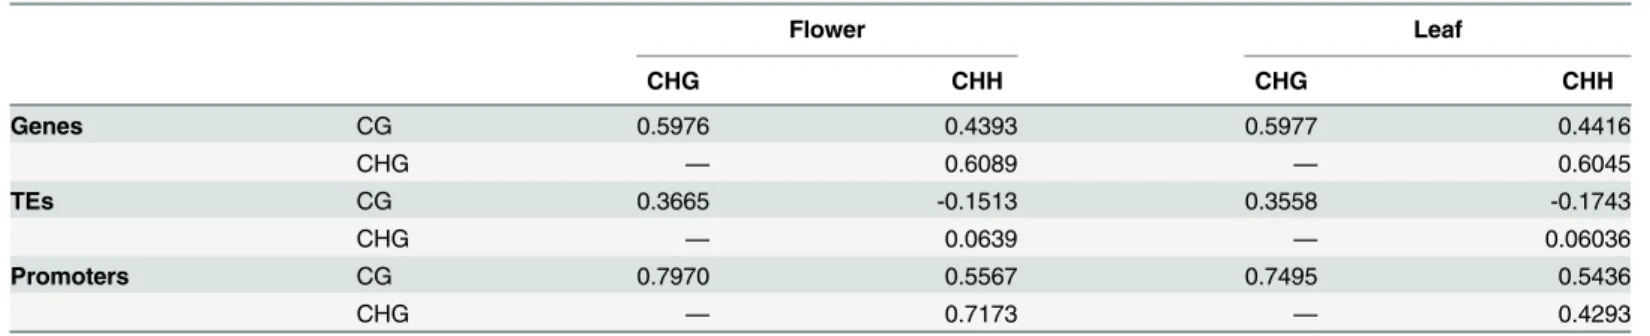
Table 2. Spearman correlation coefficients betweenpropvalues within a tissue.
Flower Leaf
CHG CHH CHG CHH
Genes CG 0.5976 0.4393 0.5977 0.4416
CHG — 0.6089 — 0.6045
TEs CG 0.3665 -0.1513 0.3558 -0.1743
CHG — 0.0639 — 0.06036
Promoters CG 0.7970 0.5567 0.7495 0.5436
CHG — 0.7173 — 0.4293
The p-values of all coefficients are<2.2 e-16 and significant after sequential Bonferroni correction.
doi:10.1371/journal.pone.0150002.t002
Fig 4. Methylation patterns within genes.A) The correlation betweenpropCGandpropCHGbetween genes for leaf tissue (r= 0.5977;p<2.2e-16); floral
bud tissue is not shown but the relationship is essentially identical. Methylation is plotted on a log scale. B) A comparison of propCG, on a log scale, and gene expression (FPKM) on a log2 scale within leaf (r= 0.2867;p<2.2e-16); again, floral bud tissue is not shown but essentially identical. C) A comparison of differential gene expression [log2fold (flower/leaf)] vs. the difference inpropCGbetween leaf and floral bud tissue.
of 7,704 genes (Table 3). This significant correlation was negative, indicating that higher gene expression covaries with lower methylation levels. Note that the correlation, while significant, had a low absolute value (r= -0.0393;Table 3), suggesting that methylation differences explain at best a small proportion (3.9%) of the variance in GE between tissues. To sum: on a genome-wide scale, we uncovered moderate evidence that CG methylation and differential GE covary within genic regions.
Promoter methylation and GE. Differential methylation of promoter regions has been reported to correlate with GE during tomato ripening [43] and perhaps to tissue-specific GE of soybean genes [27]. Accordingly we assessed relationships between promoter methylation and GE. For promoter regions there is a clear expectation of an inverse relationship between meth-ylation levels and GE [47], such that higher expression correlates with lower levels of
methylation.
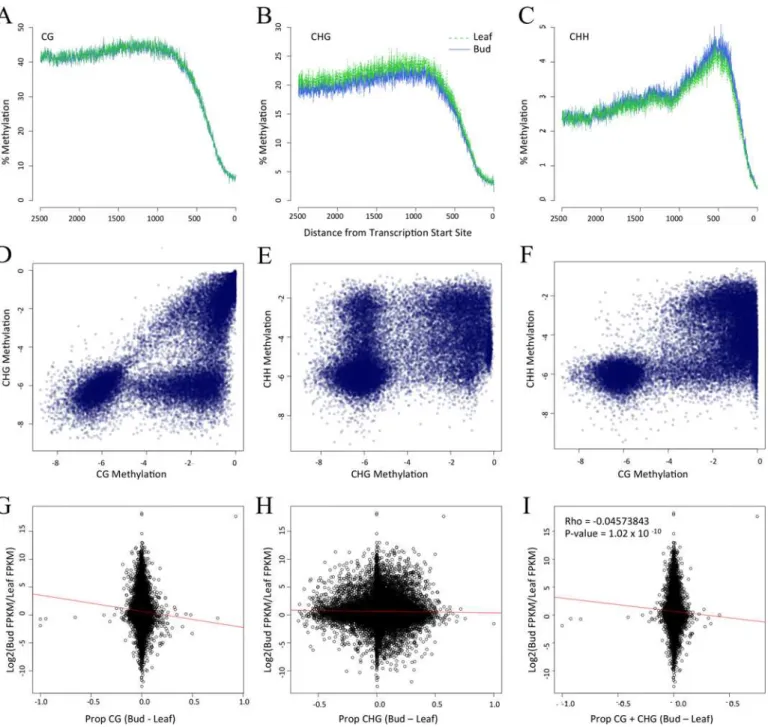
We first assessed the pattern of DNA methylation within promoters and note that it varies as a function of both distance from the TSS and cytosine context. For example, CG and CHG methylation both reach a zenith ~750 bp from the TSS (Fig 5A and 5B), as documented previ-ously [4,5], but CHH methylation was maximal ~500 bp from the TSS (Fig 5C). Within a tis-sue, promoters again exhibited the striking pattern ofpropCGandpropCHGcorrelation, where
the former is higher than the latter for 80% of observations (Fig 5D). The same relationships was evident between CG and CHH methylation (Fig 5F;Table 2) but not between CHG and CHH methylation (Fig 5E).
We expected a negative correlation between differential methylation and differential GE, and indeed the expected relationship was evident for both CG and CHG methylation (Table 3). With 1000 bp promoter regions, the correlation was as high asr= -0.0908 (p = 4.99e10-14) for the subset of 7,704 differentially expressed genes (Fig 5G;Table 3). In contrast to CG and CHG methylation,propCHHwas significantlypositivelycorrelated with differential GE (Table 3),
showing that higher CHH methylation relates to enhanced gene expression. Overall, for pro-moter regions we conclude that:i) CG and CHG methylation covary with differential GE in the expected direction,ii) that CG methylation explains up to ~9% of the variation in gene
Table 3. Spearman correlations between the difference inpropvalues between tissues and the log2 fold change in gene expression.
All Genes (19,956) Differential Genes (7,704)1
Region Context Rho p-value2 Rho p-value2
Gene CG -0.0107 0.1301 -0.0393 0.0007
CHG -0.0055 0.4358 -0.0064 0.5834
CHH 0.0214 0.0025 0.0225 0.0529
All 0.0045 0.5247 -0.0154 0.1857
Promoter (1kb) CG -0.0543 1.696e-14 -0.0908 4.990e-15
CHG -0.0357 4.429e-07 -0.0295 0.0112
CHH 0.0767 2.200e-16 0.1183 2.200e-16
All 0.0187 0.0083 0.0202 0.0821
TE CG -0.0438 6.263e-10 -0.0731 3.018e-10
CHG 0.0205 0.0038 0.0262 0.0240
CHH 0.0651 2.200e-16 0.0915 3.152e-15
All 0.0454 1.339e-10 0.0659 1.357e-08
1Includes only the subset of genes that were signi
ficantly differentially expressed between tissues.
2Boldedvalues indicate correlations that remain signi
ficant atp<0.01 after sequential bonferonni correction.
expression between tissues for differentially expressed genes, butiii) CHH methylation differs from the expected pattern.
TE methylation and GE. Because the methylation of TEs is known to suppress the expres-sion of nearby genes [3,46,50], we expected that differences in GE would correlate negatively with differential methylation of nearby TEs. That is, if a TE nearest to a gene is more highly
Fig 5. Methylation patterns within promoters and its relationship to gene expression.Graphs A,B and C present the level of CG, CHG and CHH methylation, respectively, in terms of distance from the Transcription Start Site. Graphs D, E and F compare methylation contexts, as measured byprop statistics in a log scale, within leaf tissue. Floral bud comparisons are not shown but are visually identical. Panels G, H and I compare differential gene expression [log2fold (FKPM_Flower/FKPM_Leaf)] vs. the difference inpropbetween floral bud and leaf tissue. The correlation values for G and H are in Table 3.
methylated in floral bud, we predicted it should suppress GE in flowers, thus yielding a negative correlation in our analyses. We detected this predicted negative correlation but only in the CG context (Table 3). In contrast, correlations between differential GE and bothpropCHGand
propCHHwere positive, with thepropCHHcomparisons reaching statistical significance
(Table 3). Across all contexts (propC), the relationship was also significantly positive, likely
owing to the positive trends forpropCHGandpropCHHcountervailing the trend forpropCG.
Finally, we also applied a linear model to disentangle the effects of methylation vs. the distance (in bases) of the TE from the gene (S4 Table). In the linear model, the effect of methylation remained significant (p<10−3), but the effect of distance explained little and was not
significant.
Conclusions
Although there is a widespread belief that methylation affects gene expression during develop-ment [1], relatively few studies have contrasted methylation and gene expression between tis-sues on a genomic scale. Moreover, BSseq data have rarely been replicated in these studies. Hence, our first goal was simple: to determine whether methylation between two tissues is, in fact, differentiated beyond the level expected from proper replication. For this comparison we chose two tissues that have been sampled commonly in other plant studies—leaves and floral buds. Overall, we were able to detect a significant signal of differentiation between tissue sam-ples based on two methodological approaches (permutation tests and clustering analyses) and two measures of variation (DMSs and DMRs).
Nonetheless, a sobering observation was that the false positive rate (FPR) was extremely high for contrasts between single replicates. For DMS analyses, the lowest FPR in our analyses was 75%. In other words, had we based our inferences on single replicates, three-quarters of our inferences about the sites of“tissue-specific”methylation would have been incorrect rela-tive to inferences based on the larger, replicated dataset. The FPR for DMR analyses was simi-larly large, at least 80%. While there are ways to decrease the FPR statistically in theory, they may result in the cost of sensitivity and power. Such tradeoffs in the use of BSseq replicates are the topics of ongoing theoretical and algorithmic research, but thus far these render improve-ments only for data with less coverage those in this study [51]. Altogether, we conclude that reliance on single BSseq replicates may be misleading when the goal is to focus on specific DMRs or DMSs. For this reason, we recommend analyzes that summarize over a region–e.g., genes [49] or promoters or TEs–as opposed to individual sites or individual DMRs. Moreover, because replication has been applied so rarely in plant studies, we hope that our description of within- and between-tissue replicates helps guide interpretation of the existing literature.
Although we detected significant methylation differentiation between tissues, our results were similar to previous studies in documenting that tissues are far more similar than different in their methylation patterns [22]. For example, we detected ~37-fold more sites conserved between tissue samples than variable sites. Most of the observed differences occurred in the CHG context within TEs and promoters, but there were also slight biases intotalmethylation between leaf and floral bud. Overall, these observations add to the growing notion that methyl-ation differences between plant tissues are slight, except for a few exceptional tissues, such as the endosperm and the pollen vegetative nucleus [19–22]. Since neither of these tissues contrib-utes to ensuing generations, these epigenetic changes may be of little evolutionary consequence, although it seems that the pollen vegetative nucleus may play a role in generation-to-genera-tion epigenetic reprogramming [23].
To address this question, we generated RNAseq data for the same sets of replicates and exam-ined the correlation between differential GE and differential methylation, many of which were significant. The most striking aspect of these results is that they vary by methylation context. In general, CG methylation correlates with GE as predicted: higher CG methylation in one tissue correlates with lower GE in that tissue. This relationship is true whether one examines genes, promoters or TEs (Table 3). In contrast, the results for CHH and CHG variation are more var-ied, with CHH methylation trending in the opposite direction than predicted for both promot-ers and TEs. These observations indicate that CG methylation is the primary component of variation to affect (or at least covary with) GE. This observation is consistent with the fact that genic expression in pines covaries with CG but not CHG methylation, even though pine genes are heavily methylated in both contexts [48].
Another interesting aspect about methylation contexts is that they appear to be hierarchical, because typically neither CHH nor CHG variation exceeds CG methylation, regardless of the region under consideration (Figs4A,5D, 5E and 5F). These results suggest that CG methyla-tion acts in some unknown way to limit methylamethyla-tion in the other contexts, at least in brachypo-dium. It remains to be seen whether this relationship holds for other species and additional tissues.
Overall, our study suggests that methylation patterns covary with tissue-specific expression, but also that differential CG methylation explains only a small proportion of tissue-specific variation in GE (i.e., between 1% and 9% of variation;Table 3). We note, however, that our study likely underestimates the magnitude of the effect, for at least two reasons. First, the pre-dictive power will probably increase with the number of tissues sampled. An explicit goal of future studies should be to estimate the percentage of GE variation explained by DNA methyla-tion based on a broader range of tissue-types; however, to do so will require better sampling–
both in terms of tissues and replicates–than has been performed to date. Second, like most other papers in plant epigenetic research, our tissue samples undoubtedly included multiple cell types; indeed we suspect that the variation in cell types is the primary reason for high varia-tion in DMSs and DMRs among biological replicates (Fig 1). A recent review has called to question the value of‘tissue’vs.‘cell’samples [40]. In the review, the authors argue that the sig-nal of differentiation for highly specialized cells will be masked within tissue samples that con-tain multiple cell types. This may or not be true, as it depends critically on the as-yet-unknown pattern of cell differentiation and of course the cellular composition of tissue samples. None-theless, their point is well taken: it is possible that tissue, as opposed to cell-type, samples lead to underestimate of the overall contribution of epigenetic variation to gene expression.
Materials and Methods
BSseq Data and Mapping
reference genome (version 1.0) following [35], which included filtering of low-quality reads and bases (q<20) and mapping with BRAT software [52]. Mismatches for mapping were
allowed only at potentially methylated sites.
mRNAseq data and analysis
RNAseq data were generated from the same tissue samples as BSseq [35] and are publicly in the Short Read Archive (accession number SRP063465). RNAseq relied on total RNA isolation with the Qiagen RNeasy Kit, cDNA generation with the Ovation RNA-seq system v. 2 and library preparation with the Illumina TruSeq DNA Sample Prep. V2. The libraries were sequenced on the HiSeq2500 (100 cycle, single read) in the UCI High Throughput Genomics Facility in 2013. RNAseq reads were processed using Trimmomatic (v 0.30) to remove low quality reads (<20) and adapter sequence.
Analyses of RNAseq data was based on read mapping to theB.distachyonMIPs v.1.2 refer-ence sequrefer-ence, using TopHat (v1.49.0) [53] with default parameters. In this analysis, reads were counted for each annotated gene, so long as that gene did not overlap with an annotated transposable element (see below). Reads were counted for each gene in each replicate, and then DESeq (v1.16.0) [54] was employed to identify differential expression between tissues with a false discovery rate ofq<0.01. For the comparison of differential gene expression and
differ-ential methylation we used all genes that had the number of fragments per kilobase of tran-script per million mapped reads (FPKM)>0.02 in both tissues. The difference in gene
expression was defined as [log2 (Flower_FPKM)/(Leaf_FPKM)], where Flower_FPKM and Leaf_FPKM were based on data from all three replicates.
Definitions of genomic features, DMSs, CMSs, and
prop
values
We used genome annotations to define genes, promoters and TEs. A gene was defined from the transcription start site (TSS) to the transcription stop site, including putative introns, using the MIPs (v1.2) annotation [55]. TEs were also based on the MIPs (v1.2) annotation. TEs that overlapped with genes were removed from analysis along with any genes that were contained in a TE. Gene annotations were also the basis for promoter annotation, which were defined as the 1.0 kb region upstream from the TSS.
To determine whether individual cytosines were methylated or unmethylated, we computed a binomial probability at a significance level ofp0.01, following [5]. This probability required a rate of conversion error, which was calculated on contaminating chloroplast data and was ~1% [35]. The specific error rate for each tissue was found for each replicate and for each tissue (i.e., L1+L2+L3 and F1+F2+F3;S1 Table). Once a base was defined as methylated or unmethylated in each tissue, a base that was methylated in each tissue was deemed a con-served methylation site (CMS).
To identify Differentially Methylated Sites (DMSs), we applied a Fisher exact test (FET), which was based on a 2X2 table of the number of converted Cs to non-converted C’s across the two samples [5]. A site was considered as differentially methylated between two samples–i.e., a DMS–when the FET yielded a p-value<0.05.
permuted DMSs and CMSs among genomic sites in their appropriate contexts, identified DMRs within permutated genomes, and ascertained DMR lengths. After permuting across the genone, we identified DMRs and noted the number of DMSs that constitute each DMR (S1 Fig). DMRs that were of a length expected found atp<0.01 in the permuted genome were
considered‘significant’for analysis of observed data.
The final metric was the proportion of methylation orpropc, which was used as a measure
of methylation across a region. Thepropvalue was determined by adding the total number of converted reads over the total number of reads for cytosines in a specific context. The context could be CG (propCG), CHG (propCHG), CHH (propCHH) or all three contexts (propC).
Additional Statistical Analyses
To construct the trees inFig 1, distance values were converted to Newick format and unrooted neighboring-joining trees were made using the ape and phyclust libraries in R [56].
To determine whether DMRs were closer to differential expressed genes than other genes, we first labeled each gene as either differentially expressed or not. We then calculated both the observed distance from a differentially expressed gene to its closest DMR and its average across the genome. We then randomized the labels (differentially expressed or not) among genes within the genome and recalculated the average distance between a differentially expressed gene and its nearest DMR. The randomization was performed 1000 times to generate a distri-bution of the average distance from a DMR to a gene and to determine whether the observed average was extreme (S4 Fig).
All correlations were based on cor.test in R, using the Spearman correlation.
Supporting Information
S1 Fig. A histogram of the length of DMRs found after randomization of methylated cyto-sines within thebrachypodiumgenome.Methylated cytosines were randomized in the proper context, and the number of DMRs in the same direction were counted. Within a randomized genome, a run of five or more methylated cytosines in length represented 1.3% of all potential runs; we defined a DMR to be5 methylated cytosines in the same direction, because this length represented a significant observation at the p ~0.01 threshold. SeeMaterials and Meth-odsfor additional details.
(TIF)
S2 Fig. Plots of chromosomal densities of methylation features.Plots of chromosomal densi-ties of A) CMSs, B) DMSs, C) genes, and D) TEs. Density was measured within a 50kb sliding window for smoothing. E) The graphs plot differential gene expression plotted along the physi-cal length of chromosomes. This figure mimicsFig 2of the main text, but includes the remain-ing four chromosomes.
(TIF)
S3 Fig. A volcano plot of the 26,072 genes tested for differential gene expression between leaf and floral tissue samples.
(TIF)
S4 Fig. A histogram of the average distance between DMRs and genes.The histogram is based on 1000 randomizations (seeMaterials and Methods). The red line denotes the observed value.
S1 Table. The estimate of the rate of conversion error.Estimates are based on analysis of chloroplast DNA in each replicate or on combined replicates.
(DOCX)
S2 Table. A summary of RNAseq data.The table provides the number of reads after quality trimming, the number of reads that TopHat used to map for both left and right reads, and the maximum and minimum read lengths. The total number of transcripts is from based on output from cufflinks.
(DOCX)
S3 Table. Go enrichment terms for differentially expressed genes between leaf and flower.
Only the enrichments terms with a p-value<0.01 are given.
(DOCX)
S4 Table. Results of the application of linear models.The models test for an effect of the TE distance to a gene and of TE methylation to differential gene expression.
(DOCX)
Acknowledgments
We are grateful to D. Garvin (USDA, Minnesota) for plant material and to R.L. Gaut for gener-ating the BSseq and RNAseq dataset. K. Roessler was supported by the National Institute of Biomedical Imaging and Bioengineering, National Research Service Award EB009418 from the University of California, Irvine, Center for Complex Biological Systems. S. Takuno is supported by an internal grant from SOKENDAI and JSPS Grant-in-Aid for Young Scientists (B) (Grant No. 15K18585). The work was supported by NSF grant IOS-1542703 to BSG.
Author Contributions
Conceived and designed the experiments: BSG. Analyzed the data: KR ST. Wrote the paper: KR BSG.
References
1. Law JA, Jacobsen SE (2010) Establishing, maintaining and modifying DNA methylation patterns in plants and animals. Nat Rev Genet 11: 204–220. doi:10.1038/nrg2719PMID:20142834
2. Dowen RH, Pelizzola M, Schmitz RJ, Lister R, Dowen JM, Nery JR, et al. (2012) Widespread dynamic DNA methylation in response to biotic stress. Proc Natl Acad Sci U S A 109: E2183–E2191. doi:10. 1073/pnas.1209329109PMID:22733782
3. Lippman Z, Gendrel AV, Black M, Vaughn MW, Dedhia N, McCombie WR, et al. (2004) Role of trans-posable elements in heterochromatin and epigenetic control. Nature 430: 471–476. PMID:15269773 4. Cokus SJ, Feng S, Zhang X, Chen Z, Merriman B, Haudenschild CD, et al. (2008) Shotgun bisulphite
sequencing of the Arabidopsis genome reveals DNA methylation patterning. Nature 452: 215–219. doi:10.1038/nature06745PMID:18278030
5. Lister R, O’Malley RC, Tonti-Filippini J, Gregory BD, Berry CC, Millar AH, et al. (2008) Highly integrated single-base resolution maps of the epigenome in Arabidopsis. Cell 133: 523–536. doi:10.1016/j.cell. 2008.03.029PMID:18423832
6. Greaves IK, Groszmann M, Ying H, Taylor JM, Peacock WJ, Dennis ES (2012) Trans chromosomal methylation in Arabidopsis hybrids. Proc Natl Acad Sci U S A 109: 3570–3575. doi:10.1073/pnas. 1201043109PMID:22331882
7. Coleman-Derr D, Zilberman D (2012) Deposition of Histone Variant H2A.Z within Gene Bodies Regu-lates Responsive Genes. PLoS Genet 8: e1002988. doi:10.1371/journal.pgen.1002988PMID: 23071449
9. Regulski M, Lu Z, Kendall J, Donoghue MT, Reinders J, Meyers BC, et al. (2013) The maize methylome influences mRNA splice sites and reveals widespread paramutation-like switches guided by small RNA. Genome Res 23: 1651–1662. doi:10.1101/gr.153510.112PMID:23739895
10. Lorincz MC, Dickerson DR, Schmitt M, Groudine M (2004) Intragenic DNA methylation alters chromatin structure and elongation efficiency in mammalian cells. Nat Struct Mol Biol 11: 1068–1075. PMID: 15467727
11. Luco RF, Pan Q, Tominaga K, Blencowe BJ, Pereira-Smith OM, Misteli T (2010) Regulation of alterna-tive splicing by histone modifications. Science 327: 996–1000. doi:10.1126/science.1184208PMID: 20133523
12. Shukla S, Kavak E, Gregory M, Imashimizu M, Shutinoski B, Kashlev M, et al. (2011) CTCF-promoted RNA polymerase II pausing links DNA methylation to splicing. Nature 479: 74–79. doi:10.1038/ nature10442PMID:21964334
13. Bird A (1997) Does DNA methylation control transposition of selfish elements in the germline? Trends Genet 13: 469–472. PMID:9433135
14. Richards EJ (1997) DNA methylation and plant development. Trends Genet 13: 319–323. PMID: 9260518
15. Franklin GC, Adam GI, Ohlsson R (1996) Genomic imprinting and mammalian development. Placenta 17: 3–14. PMID:8710810
16. Lister R, Pelizzola M, Dowen RH, Hawkins RD, Hon G, Tonti-Filippini J, et al. (2009) Human DNA methylomes at base resolution show widespread epigenomic differences. Nature 462: 315–322. doi: 10.1038/nature08514PMID:19829295
17. Hawkins RD, Hon GC, Lee LK, Ngo Q, Lister R, Pelizzola M, et al. (2010) Distinct epigenomic land-scapes of pluripotent and lineage-committed human cells. Cell Stem Cell 6: 479–491. doi:10.1016/j. stem.2010.03.018PMID:20452322
18. Reik W (2007) Stability and flexibility of epigenetic gene regulation in mammalian development. Nature 447: 425–432. PMID:17522676
19. Lauria M, Rupe M, Guo M, Kranz E, Pirona R, Viotti A, et al. (2004) Extensive maternal DNA hypo-methylation in the endosperm of Zea mays. Plant Cell 16: 510–522. PMID:14729913
20. Hsieh TF, Ibarra CA, Silva P, Zemach A, Eshed-Williams L, Fischer RL, et al. (2009) Genome-wide demethylation of Arabidopsis endosperm. Science 324: 1451–1454. doi:10.1126/science.1172417 PMID:19520962
21. Ibarra CA, Feng X, Schoft VK, Hsieh TF, Uzawa R, Rodrigues JA, et al. (2012) Active DNA demethyla-tion in plant companion cells reinforces transposon methylademethyla-tion in gametes. Science 337: 1360–1364. doi:10.1126/science.1224839PMID:22984074
22. Zemach A, Kim MY, Silva P, Rodrigues JA, Dotson B, Brooks MD, et al. (2010) Local DNA hypomethy-lation activates genes in rice endosperm. Proc Natl Acad Sci U S A 107: 18729–18734. doi:10.1073/ pnas.1009695107PMID:20937895
23. Slotkin RK, Vaughn M, Borges F, Tanurdzic M, Becker JD, Feijo JA, et al. (2009) Epigenetic reprogram-ming and small RNA silencing of transposable elements in pollen. Cell 136: 461–472. doi:10.1016/j. cell.2008.12.038PMID:19203581
24. Choi Y, Gehring M, Johnson L, Hannon M, Harada JJ, Goldberg RB, et al. (2002) DEMETER, a DNA glycosylase domain protein, is required for endosperm gene imprinting and seed viability in arabidop-sis. Cell 110: 33–42. PMID:12150995
25. Gehring M, Bubb KL, Henikoff S (2009) Extensive demethylation of repetitive elements during seed development underlies gene imprinting. Science 324: 1447–1451. doi:10.1126/science.1171609 PMID:19520961
26. Schmitz RJ, Schultz MD, Urich MA, Nery JR, Pelizzola M, Libiger O, et al. (2013) Patterns of population epigenomic diversity. Nature 495: 193–198. doi:10.1038/nature11968PMID:23467092
27. Song QX, Lu X, Li QT, Chen H, Hu XY, Ma B, et al. (2013) Genome-wide analysis of DNA methylation in soybean. Mol Plant 6: 1961–1974. doi:10.1093/mp/sst123PMID:23966636
28. Zhang M, Xu C, von Wettstein D, Liu B (2011) Tissue-specific differences in cytosine methylation and their association with differential gene expression in sorghum. Plant Physiol 156: 1955–1966. doi:10. 1104/pp.111.176842PMID:21632971
29. Vining KJ, Pomraning KR, Wilhelm LJ, Priest HD, Pellegrini M, Mockler TC, et al. (2012) Dynamic DNA cytosine methylation in the Populus trichocarpa genome: tissue-level variation and relationship to gene expression. BMC Genomics 13: 27. doi:10.1186/1471-2164-13-27PMID:22251412
30. Candaele J, Demuynck K, Mosoti D, Beemster GT, Inze D, Nelissen H, et al. (2014) Differential methyl-ation during maize leaf growth targets developmentally regulated genes. Plant Physiol 164: 1350–
31. Feng S, Cokus SJ, Zhang X, Chen PY, Bostick M, Goll MG, et al. (2010) Conservation and divergence of methylation patterning in plants and animals. Proc Natl Acad Sci U S A 107: 8689–8694. doi:10. 1073/pnas.1002720107PMID:20395551
32. Zemach A, McDaniel IE, Silva P, Zilberman D (2010) Genome-wide evolutionary analysis of eukaryotic DNA methylation. Science 328: 916–919. doi:10.1126/science.1186366PMID:20395474
33. Schmitz RJ, He Y, Valdes-Lopez O, Khan SM, Joshi T, Urich MA, et al. (2013) Epigenome-wide inheri-tance of cytosine methylation variants in a recombinant inbred population. Genome Res 23: 1663–
1674. doi:10.1101/gr.152538.112PMID:23739894
34. International Brachypodium Initiative (2010) Genome sequencing and analysis of the model grass Bra-chypodium distachyon. Nature 463: 763–768. doi:10.1038/nature08747PMID:20148030
35. Takuno S, Gaut BS (2013) Gene body methylation is conserved between plant orthologs and is of evo-lutionary consequence. Proc Natl Acad Sci U S A 110:1797–1802. doi:10.1073/pnas.1215380110 PMID:23319627
36. Ziller MJ, Hansen KD, Meissner A, Aryee MJ (2014) Coverage recommendations for methylation analy-sis by whole-genome bisulfite sequencing. Nat Methods
37. Seymour DK, Koenig D, Hagmann J, Becker C, Weigel D (2014) Evolution of DNA Methylation Patterns in the Brassicaceae is Driven by Differences in Genome Organization. PLoS Genet 10: e1004785. doi: 10.1371/journal.pgen.1004785PMID:25393550
38. Stroud H, Greenberg MV, Feng S, Bernatavichute YV, Jacobsen SE (2013) Comprehensive analysis of silencing mutants reveals complex regulation of the Arabidopsis methylome. Cell 152: 352–364. doi: 10.1016/j.cell.2012.10.054PMID:23313553
39. Becker C, Hagmann J, Muller J, Koenig D, Stegle O, Borgwardt K, et al. (2011) Spontaneous epigenetic variation in the Arabidopsis thaliana methylome. Nature 480: 245–249. doi:10.1038/nature10555 PMID:22057020
40. Ji L, Neumann DA, Schmitz RJ (2015) Crop Epigenomics: Identifying, Unlocking, and Harnessing Cryp-tic Variation in Crop Genomes. Mol Plant
41. Smallwood SA, Lee HJ, Angermueller C, Krueger F, Saadeh H, Peat J, et al. (2014) Single-cell genome-wide bisulfite sequencing for assessing epigenetic heterogeneity. Nat Methods 11: 817–820. doi:10.1038/nmeth.3035PMID:25042786
42. Ong-Abdullah M, Ordway JM, Jiang N, Ooi SE, Kok SY, Sarpan N, et al. (2015) Loss of Karma transpo-son methylation underlies the mantled somaclonal variant of oil palm. Nature 525: 533–537. doi:10. 1038/nature15365PMID:26352475
43. Zhong S, Fei Z, Chen YR, Zheng Y, Huang M, Vrebalov J, et al. (2013) Single-base resolution methy-lomes of tomato fruit development reveal epigenome modifications associated with ripening. Nat Bio-technol 31: 154–159. doi:10.1038/nbt.2462PMID:23354102
44. Gent JI, Ellis NA, Guo L, Harkess AE, Yao Y, Stam M, et al. (2013) CHH islands: de novo DNA methyla-tion in near-gene chromatin regulamethyla-tion in maize. Genome Res 23: 628–637. doi:10.1101/gr.146985. 112PMID:23269663
45. Diez CM, Roessler K, Gaut BS (2013) Epigenetics and plant genome evolution. Curr Opin Plant Biol 18C: 1–8.
46. Hollister JD, Gaut BS (2009) Epigenetic silencing of transposable elements: A trade-off between reduced transposition and deleterious effects on neighboring gene expression. Genome Res 19: 1419–1428. doi:10.1101/gr.091678.109PMID:19478138
47. Zhang X, Yazaki J, Sundaresan A, Cokus S, Chan SW, Chen H, et al. (2006) Genome-wide high-reso-lution mapping and functional analysis of DNA methylation in arabidopsis. Cell 126: 1189–1201. PMID: 16949657
48. Takuno S, Ran J-H, Gaut BS (2016) Evolutionary patterns of genic DNA methylation vary among Land Plants. Nature Plants doi:10.1038/nplants.2015.222
49. Takuno S, Gaut BS (2012) Body-methylated genes in Arabidopsis thaliana are functionally important and evolve slowly. Mol Biol Evol 29: 219–227. doi:10.1093/molbev/msr188PMID:21813466 50. Hollister JD, Smith LM, Guo YL, Ott F, Weigel D, Gaut BS (2011) Transposable elements and small
RNAs contribute to gene expression divergence between Arabidopsis thaliana and Arabidopsis lyrata. Proc Natl Acad Sci U S A 108: 2322–2327. doi:10.1073/pnas.1018222108PMID:21252301 51. Sun D, Xi Y, Rodriguez B, Park HJ, Tong P, Meong M, et al. (2014) MOABS: model based analysis of
bisulfite sequencing data. Genome Biol 15: R38. doi:10.1186/gb-2014-15-2-r38PMID:24565500 52. Harris EY, Ponts N, Levchuk A, Roch KL, Lonardi S (2010) BRAT: bisulfite-treated reads analysis tool.
53. Trapnell C, Roberts A, Goff L, Pertea G, Kim D, Kelley DR, et al. (2012) Differential gene and transcript expression analysis of RNA-seq experiments with TopHat and Cufflinks. Nat Protoc 7: 562–578. doi: 10.1038/nprot.2012.016PMID:22383036
54. Anders S, Huber W (2010) Differential expression analysis for sequence count data. Genome Biol 11: R106. doi:10.1186/gb-2010-11-10-r106PMID:20979621
55. Nussbaumer T, Martis MM, Roessner SK, Pfeifer M, Bader KC, Sharma S, et al. (2013) MIPS PlantsDB: a database framework for comparative plant genome research. Nucleic Acids Res 41: D1144–D1151. doi:10.1093/nar/gks1153PMID:23203886