© 2014 Karuppiah and Rajaram, This open access article is distributed under a Creative Commons Attribution (CC-BY) 3.0 license
doi:10.3844/ajassp.2014.1292.1300 Published Online 11 (8) 2014 (http://www.thescipub.com/ajas.toc)
Corresponding Author: A. Babu Karuppiah, Department of ECE, Velammal College of Engineering and Technology, Madurai, India
SIGNED GRAPH APPROACH IN ADAPTIVE
TRANSMISSION POWER TO ENHANCE THE
LIFETIME OF WIRELESS SENSOR NETWORKS
1
A. Babu Karuppiah and
2S. Rajaram
1
Department of ECE, Velammal College of Engineering and Technology, Madurai, India 2
Department of ECE, Thiagarajar College of Engineering, Madurai, India
Received 2014-02-19; Revised 2014-03-17; Accepted 2014-05-13
ABSTRACT
A Wireless Sensor Network (WSN) comprises a collection of sensor nodes networked for applications like surveillance, battlefield, monitoring of habitat. Nodes in a WSN are usually highly energy-constrained and expected to operate for long periods from limited on-board energy reserves. When a node transmits data to a destination node the data is overheard by the nodes that are in the coverage range of the transmitting node or the forwarding node. Due to this, the individual nodes might waste their energy in sensing data that are not destined to it and as a result the drain in the energy of the node is more resulting in much reduced network life time. As power is a limiting factor in a WSN, the major challenge in deploying a WSN is to enhance the network life time. So, it becomes inevitable to devise an efficient method of conserving the power. In this study, a novel algorithm, Signed Graph based Adaptive Transmission Power (SGATP) is developed to avoid redundancy in sensing the data thereby enhancing the life time of the network. The concept of adapting the transmission power based on the distance of the next neighbor is proposed while a node communicates with the Cluster Head during Intrusion Detection. The simulation results show that the average network life time is greatly improvised by 96.8% when the proposed method is adopted.
Keywords: Wireless Sensor Networks, Adaptive Transmission Power, Network Life Time, Signed Graph Theory, Power Consumption
1. INTRODUCTION
A Wireless Sensor Network (WSN) is a specialized wireless network composed of a number of sensor nodes deployed in a specified area for monitoring environment conditions such as temperature, air pressure, humidity, light, motion or vibration and can communicate with each other using a wireless radio device. It is a subclass of MANETs and comprises processor, battery, sensor devices and transceiver. In ad hoc networks it is possible to replace the batteries or recharge it but it cannot happen in a WSN. So, energy conservation becomes a crucial parameter. Efficient designing of a network in a way efficiently utilizes the energy of the nodes to prolong the lifetime of the network. Since communication consume
significant amount of battery power, sensor nodes should spend as little energy as possible when receiving and transmitting data (Kahn et al., 1999; Akyildiz et al., 2002; Chen and Zhao, 2005). Energy conservation is one of the most important goals, while per-node fairness and latency are less important (Qian and Zhenzhou, 2010).
The challenges faced in designing sensor network systems and applications include:
• Limited hardware
• Limited support for networking
• Limited support for software development
of the network. By this technique the source is able to efficiently communicate the intrusion information to the Cluster Head with less usage of nodes’ resources thus extending the life time of the network.
The rest of the paper is organized as follows: Section II discusses on the basic concepts of graph theory and the reason for adopting it by means of its wide usage. The work related to application of graph theory in different types of network and the evolution of the Transmission Power control is elaborated under Section III. The proposed work is dealt in Section IV followed by the simulation results in Section V. Finally, concluding remarks are given in Section VI.
2. GRAPH THEORY
Graph theory is an extensive and popular branch of Mathematics. It is cross-disciplinary between Mathematics, Computer Science, Electrical and Electronics Engineering and Operations Research which has been applied to many problems in mathematics, computer science and other scientific and not-so-scientific areas. The basis of graph theory is in combinatory and the role of “graphics” is only in visualizing things. Graph-theoretic applications and models usually involve connections to the “real world” on the one hand-often expressed in vivid graphical terms-and the definitional and computational methods given by the mathematical combinatory and linear-algebraic machinery on the other.
Graph theoretical concepts are widely used to study and model various applications, in different areas. Graphs and networks are all around us including technological networks like the internet, power grids, telephone networks and transportation networks, social networks like social graphs and affiliation networks, information networks like world wide web, citation graphs and patent networks, biological networks like biochemical networks, neural networks and food webs and many more. Graphs provide a structural model that makes it possible to analyze and understand how many separate systems act together.
2.1. Graph Theory and Networks
Conceptually, a graph is formed by vertices and edges connecting the vertices. Formally, a graph is a pair of sets (V, E), where V is the set of vertices and E is the set of edges, formed by pairs of vertices. E is a multi-set, in other words, its elements can occur more than once so that every element has a multiplicity.
A computer network, or simply a network, is a collection of computers and other hardware components interconnected by communication channels that allow sharing of resources and information. Simply, more than one computer interconnected through a communication medium for information interchange is called a computer network. Using graph the nodes of the network are represented as a collection of points, called vertices and a collection of lines, called arcs or edges represent the communication link connecting these points. The major role of graph theory in computer applications is the development of graph algorithms. Numerous algorithms are used to solve problems that are modelled in the form of graphs (Grin, 2012). These algorithms are used to solve the graph theoretical concepts which intern used to solve the corresponding computer science application problems. Some algorithms are as follows:
• Shortest path algorithm in a network • Finding a minimum spanning tree • Finding graph planarity
• Algorithms to find adjacency matrices • Algorithms to find the connectedness • Algorithms to find the cycles in a graph
• Algorithms for searching an element in a data structure
3. RELATED WORK
first, called Hybrid, calculates the ideal transmission power using a closed control loop that iterates over the available transmissions powers in order to maintain a target link quality. The second, called AEWMA employs calculations to determine the ideal transmission power based on the reception power, transmission power and average noise.
Pantazis et al. (2008) have proposed an adaptive power based transmission scheme for WSN where transmit power is adapted depending on node density and channel conditions so as to maintain a desired level of signal detection probability at a receiving node as demanded by sensing range. They have compared the energy level performance of fixed and the proposed transmit power schemes. With respect to energy consumption, they have shown that the proposed scheme consumes less energy than FTPS in moderate and high node spatial density region. Khemapech et al. (2007); Pantazis et al. (2008) the authors have addressed examples of the Dynamic Transmission Power Control (DTPC) problems in WSN. Erciyes et al. (2007) have utilized the concept of Graph theory and have performed Clustering of sensor nodes using dominating sets of the theory. They have provided the survey on the clustering algorithms using graph theory. The authors (Wang et al., 2012) proposes a novel transmission power control approach named Local Adaptive Transmit Power Assignment (LA-TPA). The approach considers both the path loss exponent and the energy control coefficient in order to characterize the minimum cover district of each node more accurately and precisely according to network environment and application scenario of the network. Moreover, it provides a self-healing function that makes the network maintain the best performance for a long time when a few of the nodes exhaust their energy or a fresh batch of nodes is deployed.
Kubisch et al. (2003), for dynamically adjusting transmission power level on per node basis, two algorithms LMN and LMA have been evaluated and it is shown that the developed algorithms outperform fixed power level assignment. (Bathla and Sharma, 2011) the authors have thrown light on the scheme to find an optimal transmission power to control the connectivity properties of the network or a part of it, which could be power per node, per link, or a single power level for the whole network. Algorithms have been framed in (Banerjee and Misra, 2003) for computing minimum-energy paths for a reliable packet delivery leading to reliable wireless communication. (Kumar Ray and Kumar Turuk, 2010), have proposed three energy
efficient techniques for ad hoc network environment to reduce energy consumption at protocol level. The first technique minimizes route request message. Second technique optimizes the transmission power at each node and third techniques increases network capacity by topology control mechanism. Lin et al. (2006) in their paper have developed a mechanism where each node builds a model for each of its neighbours, describing the correlation between transmission power and link quality. With this model, feedback-based transmission power control algorithm is employed to dynamically maintain individual link quality over time. The basic concepts and applications are dealt with finesse by the authors in (Shirinivas et al. 2010).
4. PROPOSED WORK
The main objective of the paper is to develop an adaptive transmission power technique using signed graph approach. The Signed Graph based Adaptive Transmission Power (SGATP) is developed to prolong the lifetime of WSN by reducing the communication mechanism with reduced processing and network power consumption. The basic ideology behind this novel method is to reduce the transmission power of the node automatically so that the communication happens on a one to one basis.
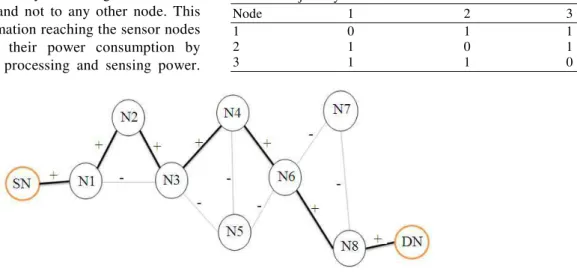
The concept of the adaptive transmission technique is best implemented with Graph Theory. In Graph Theory, the nodes are treated as vertices and the links between them are considered as edges of the graph. Consider the network shown in Fig. 1.
Here in the Fig. 1, SN denotes the Source node and DN the destination node. The nodes labelled from N1 to N8 denote the wireless sensor nodes that are deployed and utilized for communication.
The proposed algorithm-SGATP involves five different phases:
• Inter-node distance calculation • Neighbour nodes detection • Shortest path calculation • Adaptive transmission of power
• Calculation of power consumption of the network
4.1. Inter-Node Distance Calculation
Fig. 1. Sample wireless sensor network
Calculating the distance from the node also helps in finding the amount of power required to reach the next neighbour node. The distance of all other nodes from each node is found by just reading the x and y coordinates of each node in a localised network. Once the coordinates of each node (x, y) are obtained, the inter distance between each node from every other node can be calculated using the two point distance formula given as in Equation 1:
(
) (
2 2 1)
22 1
= − + −
D y y x x (1)
where, ‘D’ is the distance, (x1, y1) and (x2, y2) are the coordinates of the nodes.
Algorithm 1: Inter Node Distance Calculation
1: if Distance of node i from node i then 2: Distance←0
3: else Distance of node i from node j
4: Calculate the distance using the formula 5: end if
The Algorithm 1 explains the steps in calculating the distances from all other nodes from each node.
4.2. Neighbour Nodes Detection
The inter-node distances help in calculating the number of neighbors to each node. Algorithm 2 gives the flow in which the neighbors are found out. From the Internode distance calculation, if the distance is less than the sensing radii of the sensor node then both the nodes are said to be neighbouring nodes.
Algorithm 2: Neighbour Node Detection
1: Node i = Node j then
3: if Distance of a node i is less than from node j by 50m
4: Node j is a neighbour of Node i 5: end if
6: end if
After the neighbor node discovery the Adjacency matrix ‘A’ is.
From Table 1, it is inferred that the Adjacency matrix for a 3 node network created is binary symmetric which has entries either a ‘0’ or ‘1’. The entries aij in the matrix A is given by Equation 2:
i j ij
1, if n n set of neighbors a
0, otherwise
∈
(2)
Since loops are not allowed for any node i , aii = 0.
4.3. Shortest Path Calculation
The Inter-node distance calculation and the neighborhood discovery form the basis for finding the shortest path that can be taken to communicate between the source and the destination with reduced power requirement thereby prolonging the life time of the network.
Algorithm 3: Shortest Path Calculation
1: for all nodes in the network
2: Calculate the number of neighbours (edges) from that particular node
3: From the number of edges calculate the edge with the least weight
4: The other end of the edge forms the next neighbour. 5: Update a list with the selected neighbours.
7: Calculate the next least weight of that neighbour to that node
8: end if 9: end for
10: The number of nodes in the updated list gets involved in consuming power.
Algorithm 3 explicates the steps involved in finding out the shortest path from the source to the destination.
After finding the shortest path, from the signed and unsigned means of graph representation, the existence of communication link between the edges can be easily determined. For the sample network shown in Fig. 1, the signed graph representation is shown in Fig. 2. On applying the signed graph theory representation of the sample network shown in Fig. 1, a ‘+’ in the edges of
Fig. 2 represents a communication link between nodes and a ‘-’ represents no communication link available.
Once the signed representation of the network is created using graph theory and the shortest distance with least weight is determined, the algorithm for adaptive transmission between nodes is performed for efficient utilization of power in the network.
4.4. Adpative Trasmission and Calculation of
Power Consumption of the Network
Finding the shortest distance from the source to the destination helps to find the route the data has to travel without travelling any redundant paths. The objective of adaptive transmission is to find the shortest distance from the node to the next neighbour. The technique uses extra hardware for adjusting the transmitted power and it does so to transmit only to the neighbour with the least distance from it and not to any other node. This avoids unwanted information reaching the sensor nodes and thereby reducing their power consumption by making it forfeit their processing and sensing power.
The total power consumed is obtained from the formula given in Equation 3:
Power consumed Number of nodes *
(SensingPower Processing power)
=
+ (3)
Algorithm 4: Calculation of Power Consumption
1: Assume a value for the transmitting power of the sensor node
2: For all node in the updated list
3: For any node i calculate the neighbour node with the least distance
4: Adjust the transmission power of node i in accordance with the distance.
5: end for 6: end for
7: For the number of nodes in the updated list 8: Calculate the power consumed by using the formula
9: end for
10: For the number of nodes in the network 11: Calculate the power consumed by using the formula
12: end for
13: Compare the results of power consumed with SGATP with that of power consumed without
SGATP
Using algorithm 4 the transmitted power is made to adapt itself to the distance with least weight calculated with respect to a node.
Table 1. Adjacency matrix
Node 1 2 3
1 0 1 1
2 1 0 1
3 1 1 0
5. RESULTS
It is assumed that the network setup is static, meaning that the location of the sensor nodes does not change. It is also assumed that the sensor nodes have the same transmitting power. In the simulation of the network the number of the nodes is entered.
Based on the number of nodes the topology of the network is determined. The topology of the network has the number of nodes to be 10. The nodes are represented as vertices and are shown as circles with the node ID inside the circle. The communication links between nodes are the edges and they are gives as directed lines between them. It is assumed that Node 1 is the source and the value of the number of nodes in the network is the destination.
6. DISCUSSION
For this topology the inter-node distance between nodes is calculated and the neighbour discovery process leads to the number of neighbours for each and every node. It is assumed that the nodes within the coverage range of 50m of a particular node are considered to be the neighbours of that node. The Adjacency matrix is determined from the neighbour detection and it is shown in Table 2.
From the above table, it is interpreted that the entries having a ‘1’ are the nodes that are neighbours of a particular node. For example, for Node 1, Nodes 2, 3, 4, 6, 8, 9 and 10 are neighbours since they fall under the coverage range of Node 1. After determining the neighbours the least distance among the neighbours from a node is calculated and the process proceeds in a similar fashion for the shortest distance between the source and the destination is found out. Now the shortest distance between the source and the destination has been calculated and the necessary intermediate nodes are determined. It is inferred that the information may be passed from the source to the destination via these nodes alone instead of broadcasting to the entire coverage area.
The objective of this study is to reduce the unwanted processing of data since the node will process the data even if it is not destined to it. This can be easily overcome if the transmission is on one to one basis rather than a broadcast transmission. This can be achieved by the additional hardware that needs to be designed inside the Wireless Sensor node to take care of the transmission power that needs to be decreased based on the distance to the next neighbour. It is assumed that the hardware has been designed and it perfectly adapts the power based on the distance. Assuming the transmission power to be 6mW and sensing power to be 2mW, the power consumption of the network is calculated by executing the algorithm and by substituting the required values in (2). The following simulation results were obtained as given in Table 3.
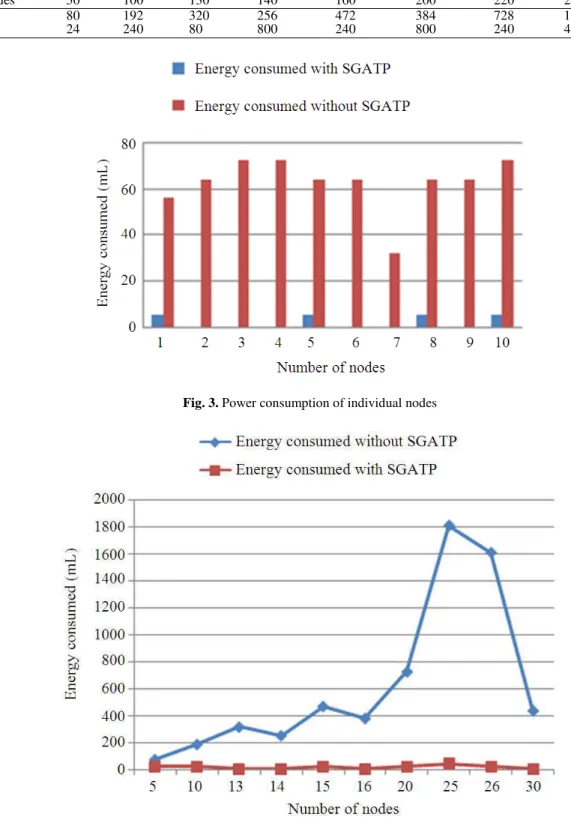
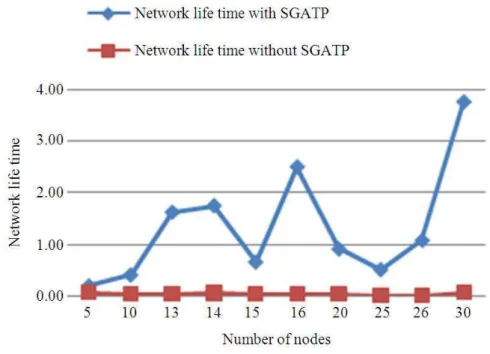
Table 3 shows the simulated result of the proposed method where it is inferred that the Power consumption is greatly reduced when the concept of adaptive transmission based on distance is taken into consideration. From Fig. 3, it is clearly understood that the power consumption of the individual nodes is more when there is no adaptive transmission in power whereas it is reduced to a greater extent when SGATP is implemented. When the individual nodes’ power consumption is reduced it means that the network life time is extended. This is inferred from Fig. 4. It shows the comparison graph of energy consumption between two techniques where it is inferred that the proposed graph theory based adaptive transmission technique reduces the redundant processing of data by nodes which greatly reduces the power consumption of the node. From Fig. 3 and 4 it is clearly seen that using SGATP, the power consumption of individual nodes is greatly reduced thereby enhancing the life time of the network than the existing method (Tahir et al., 2013). Figure 5
depicts the network life time (Cheng and Chuah, 2004) of the proposed method with that of the existing method. It is inferred that the life time of the nodes using the proposed algorithm is enhanced.
Table 2. Adjacency matrix for the 10 node network
Node 1 2 3 4 5 6 7 8 9 10
1 0 1 1 1 0 1 0 1 1 1
2 1 0 1 1 1 1 0 1 1 1
3 1 1 0 1 1 1 1 1 1 1
4 1 1 1 0 1 1 1 1 1 1
5 0 1 1 1 0 1 1 1 1 1
6 1 1 1 1 1 0 0 1 1 1
7 0 0 1 1 1 0 0 0 0 1
8 1 1 1 1 1 1 0 0 1 1
9 1 1 1 1 1 1 0 1 0 1
Table 3. Simulation result of energy consumed in the network
No of nodes 50 100 130 140 160 200 220 2500 2600
X 80 192 320 256 472 384 728 1808 1608
Y 24 240 80 800 240 800 240 4800 2400
Fig. 3. Power consumption of individual nodes
Fig. 5. Comparison of network lifetime with and without SGATP
6. CONCLUSION
Extending the life of the WSN is a challenge and to address this parameter of importance, a Novel algorithm SGATP is developed. Simulation results show a considerable decrease in the Power consumption of individual nodes. Moreover, the results reveal that when the number of nodes in the network increases there is no alarming increase in the power consumption. As there is a substantial reduction in the power consumption of individual nodes the overall network lifetime is greatly enhanced. This is done mainly by altering the transmission power of the node based on the distance of its immediate neighbor. The usefulness of the proposed algorithm can be realized in Intrusion detection. During Intrusion detection in sensor networks, some genuine nodes need to communicate with the Cluster Head (CH) to inform about the details of malicious nodes and finally the CH validates and informs the other nodes about the intruder. In this scenario, when a node transmits data to a destination node, the data can be sent without being overheard by the neighboring nodes thereby reducing the wastage in power consumption. SGATP which has been proved to be efficient in improving the life of the network has future scope in the aspect that: The network is assumed to be static where this proposed algorithm can be implemented for a dynamically
changing topology where the issue of information transfer in WSN after nodes leave the network due to its exhaustion of energy can be addressed to.
7. REFERENCES
Akyildiz, I.F. S. Weilian, Y. Sankarasubramania and E. Cayirci, 2002. A survey on sensor networks. IEEE Commun. Magazine, 40: 102-114. DOI: 10.1109/MCOM.2002.1024422
Pantazis, N.A., D.D. Vergados, N.I. Miridakis and D.J. Vergados, 2008. Power control schemes in wireless sensor networks for homecare e-health applications. Proceedings of the 1st international conference on PErvasive Technologies Related to Assistive Environments, Jul. 15-19, ACM New York. DOI: 10.1145/1389586.1389683
Banerjee, S. and A. Misra, 2003. Adapting transmission power for optimal energy reliable multi-hop wireless communication. Proceedings of the Wireless Optimization Workshop, (WOW’ 03), Sophia-Antipolis, France.
Bathla, M. and N. Sharma, 2011. A review paper on topology control in wireless sensor networks. Int. J. Electron. Commun. Tech.
Cheng, P. and C.N. Chuah, 2004. Energy-aware node placement in wireless sensor network. Proceedings of the Global Telecommunications Conference, (GTC’ 04).
Correia, L.H.A., D.F. Macedo, D.A.C. Silva, A.L.D. Santos, A.A.F. Loureiro et al., 2005. Transmission power control in MAC protocols for wireless sensor networks. Proceedings of the 8th ACM International Symposium on Modeling, Analysis and Simulation of Wireless and Mobile Systems, Oct. 10-13, ACM
New York, pp: 282-289. DOI:
10.1145/1089444.1089494
Erciyes, K., O. Dagdeviren, D. Cokuslu and D. Ozsoyeller, 2007. Graph theoretic clustering algorithms in mobile ad hoc networks and wireless sensor networks survey. Appl. Comput. Math., 6: 162-180.
Grin, C., 2012. Graph Theory. Penn State Math 485 Lecture Notes Version, 1: 2011-2012.
Kahn, J.M. R.H. Katz and K.S.J. Pister, 1999. Next century challenges: Mobile networking for “smart dust”. Proceedings of the 5th Annual ACM/IEEE International Conference on Mobile Computing and Networking,Aug. 15-19, ACM New York, pp: 271-278. DOI: 10.1145/313451.313558
Khemapech, I., A. Miller and I. Duncan, 2007. A survey of transmission power control in wireless sensor networks. University of St Andrews.
Kubisch, M., H. Karl, A. Wolisz, L.C. Zhong and J. Rabaey, 2003. Distributed algorithms for transmission power control in wireless sensor networks. Proceeding of the IEEE Wireless Communications and Networking, Mar. 20-20, IEEE Xplore Press, New Orleans, LA, USA., pp: 558-563. DOI: 10.1109/WCNC.2003.1200410 Kumar Ray, N. and A. Kumar Turuk, 2010. Energy
efficient techniques for wireless Ad Hoc network. Proceedings of the 1st International Joint Conference on Information and Communication Technology, (ICT’ 10), IPM., pp: 105-111.
Lin, S., J. Zhang, G. Zhou, L. Gu and J.A. Stankovic et al., 2006. ATPC: Adaptive transmission power control for wireless sensor networks. Proceedings of the 4th International Conference on Embedded Networked Sensor Systems,Nov. 01-03,ACM New York, pp: 223-236. DOI: 10.1145/1182807.1182830 Qian, H. and T. Zhenzhou, 2010. An adaptive transmit
power scheme for wireless sensor networks. Proceedings of the 3rd IEEE International Conference on Ubi-Media Computing, Jul. 5-6, IEEE Xplore Press, Jinhua, pp: 12-16. DOI: 10.1109/UMEDIA.2010.5543939
Shirinivas, S.G., S. Vetrivel and N.M. Elango, 2010. Applications of graph theory in computer science-an overview. Int. J. Eng. Sci. Tech., 2: 4610-4621. Sorooshyari, S. and Z. Gajic, 2008. Autonomous
dynamic power control for wireless networks: User-centric and network-User-centric consideration. IEEE Trans. Wireless Commun., 7: 1004-1015. DOI: 10.1109/TWC.2008.060731
Sudarmani, R. and K.R.S. Kumar, 2013. Particle swarm optimization-based routing protocol for clustered heterogeneous sensor networks with mobile sink. Am. J. Applied Sci., 10: 259-269. DOI: 10.3844/ajassp.2013.259.269
Tahir, M., N. Javaid, Z.A. Khan, U. Qasim and M. Ishfaq, 2013. EAST: Energy-efficient adaptive scheme for transmission in wireless sensor networks. Proceedings of the 26th IEEE Canadian Conference on Electrical and Computer Engineering, May 5-8, IEEE Xplore Press, Regina, SK., pp: DOI: 10.1109/CCECE.2013.6567755 Wang, J., M. Tinghuai, Q. Liu, S. Ji and S. Lee, 2012. A