SRef-ID: 1684-9981/nhess/2005-5-593 European Geosciences Union
© 2005 Author(s). This work is licensed under a Creative Commons License.
Natural Hazards
and Earth
System Sciences
High resolution forecast of heavy precipitation with Lokal Modell:
analysis of two case studies in the Alpine area
M. Elementi, C. Marsigli, and T. Paccagnella
ARPA-SIM (Servizio Idro-Meteorologico della Regione Emilia-Romagna) Bologna, Viale Silvani 6, 40122 Bologna, Italy Received: 4 April 2005 – Revised: 18 May 2005 – Accepted: 2 June 2005 – Published: 2 August 2005
Part of Special Issue “HYDROPTIMET”
Abstract. Northern Italy is frequently affected by severe pre-cipitation conditions often inducing flood events with associ-ated loss of properties, damages and casualties. The capa-bility of correctly forecast these events, strongly required for an efficient support to civil protection actions, is still nowa-days a challenge. This difficulty is also related with the com-plex structure of the precipitation field in the Alpine area and, more generally, over the Italian territory. Recently a new generation of non–hydrostatic meteorological models, suitable to be used at very high spatial resolution, has been developed.
In this paper the performance of the non–hydrostatic Lokal Modell developed by the COSMO Consortium, is analysed with regard to a couple of intense precipitation events oc-curred in the Piemonte region in Northern Italy. These events were selected among the reference cases of the Hydropti-met/INTERREG IIIB project.
LM run at the operational resolution of 7 km provides a good forecast of the general rain structure, with an unsatis-factory representation of the precipitation distribution across the mountain ranges. It is shown that the inclusion of the new prognostic equations for cloud ice, rain and snow pro-duces a remarkable improvement, reducing the precipitation in the upwind side and extending the intense rainfall area to the downwind side. The unrealistic maxima are decreased to-wards observed values. The use of very high horizontal res-olution (2.8 km) improves the general shape of the precipita-tion field in the flat area of the Piemonte region but, keeping active the moist convection scheme, sparse and more intense rainfall peaks are produced. When convective precipitation is not parametrised but explicitly represented by the model, this negative effect is removed.
Correspondence to: M. Elementi
1 Introduction
The aim of this paper is the numerical investigation of two meteorological cases which can be considered representative of the intense precipitation events frequently affecting North-ern Italy during the autumn season. The synoptic description of these case studies is presented in the paper by Milelli et al. (2005)1.
The new generation of non-hydrostatic high resolution models permits a better description of mesoscale processes and associated precipitation events. In presence of complex topography, as in the Alpine area, these models should also improve the representation of the interaction between meteo-rological structures and orography. Orographic forcing plays in fact a major role in the localisation and intensification of precipitation in this region, where moist Mediterranean flows undergo to sudden uplift.
The capability of numerical models to forecast correctly local and intense precipitation is still nowadays limited. This is true even at short time-range, up to 48 h, due to the loss of atmospheric predictability going down to small spatial and temporal scales. With regard to high-resolution modelling (1 to 10 km), it is not completely satisfactory just to reproduce precipitating structures, but a correct localisation in space and time is required together with realistic peak values. This is even more crucial when hydrological models need to be coupled in a full hydro-meteorological chain.
A representative review of the state-of-the-art in the field of high resolution modelling of intense precipitation in the Alpine area can be found in the Special Issue of the Quarterly Journal of the Royal Meteorological Society devoted to the MAP (Mesoscale Alpine Programme) results (Bougeault et al., 2003).
1Milelli, M., Llasat, C., and Ducrouq, V.: The cases of June
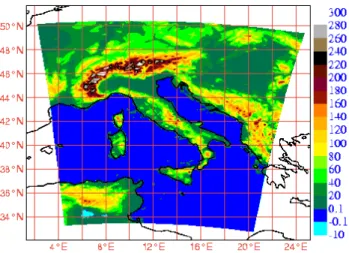
Fig. 1. Integration domain and orography field (in decameters) of LM used operationally by ARPA–SIM (LAMI).
The meteorological model employed for the numerical simulations presented in this work is Lokal Modell (LM), operationally managed by ARPA–SIM (the regional Hy-droMeteorological Service of Emilia-Romagna) since 2001. LM is developed by the COSMO Consortium (COnsortium for Small-scale MOdelling), which coordinates the cooper-ation of Germany, Italy, Switzerland, Greece and Poland (http://cosmo-model.cscs.ch/).
LM is a fully-compressible (non-hydrostatic) primitive equation model without any scale approximation. Due to the unfiltered set of equations, the vertical momentum equa-tion is not approximate, allowing a better descripequa-tion of non-hydrostatic phenomena such as moist convection, breeze cir-culations and some kind of mountain-induced waves.
The Italian implementation of LM (LAMI), managed by ARPA–SIM in the framework of an agreement among UGM (Ufficio Generale di Meteorologia), ARPA–SIM and ARPA–Piemonte, consists of two runs a day (at 00:00 and 12:00 UTC) for 72 h with a spatial horizontal resolution of 7 km and 35 levels in the vertical on the domain repre-sented in Fig. 1. Hourly boundary conditions are provided by the DWD (Deutscher Wetterdienst) global model GME (“one-way nesting”). Initial conditions are obtained through a mesoscale data assimilation system based on the nudging technique (Schraff and Hess, 2003). LM contains a full set of physical parametrisations, described in Cosmo Newsletter number 4 (2004).
One of the major problems of Limited-Area Models, in forecasting intense precipitation in presence of a mountain range, is the tendency to overestimate the rainfall in the up-wind areas, with a related drying effect in the downup-wind re-gions. This error heavily reduced the usefulness of Quanti-tative Precipitation Forecast (QPF) as input to hydrological forecasting models.
In order to improve the forecast distribution of the precip-itation, some recent improvements of LM have been tested. The operational set-up of the model at the time of the ex-periments included only two micro-physical species:
wa-40°N 44°N 48°N
4°E 8°E 12°E 16°E 20°E
ªªªªª ªªªªª ªªªªª ªªªªª ªªªªª ªªªªª ªªªªª ªªªªª ªªªªª ªªªªª ªªªªª ªªªªª ªªªªª ªªªªª ªªªªª ªªªªª ªªªªª ªªªªª ªªªªª ªªªªª ªªªªª ªªªªª ªªªªª ªªªªª ªªªªª ªªªªª ªªªª ªªªªª ªªªªª ªªªª ªªªªª ªªªª ªªªªª ªªªª ªªªªª ªªªª ªªªª ªªªª ªªªªª ªªªª ªªªª ªªªª ªªªªªªªªªª ªªªªªªªªªª ªªªªªªªªªª ªªªªªªªªªª ªªªªª ªªªªªªªªªª ªªªªªªªªªª ªªªªªªªªªª ªªªªªªªªªª ªªªªªªªªªª ªªªªª ªªªªªªªªªª ªªªªª ªªªªªªªªªª ªªªªªªªªªª ªªªªªªªªªª ªªªªªªªªªª ªªªªªªªªªª ªªªªªªªªªª ªªªªªªªªªª ªªªªªªªªªª ªªªªª ªªªªªªªªªªªªªªªªªªªªªªªªªªªªªªªªªªªªªªªªªªªªªªªªªªªªªªªªªªªªªªªªªªªªªªªªªªªªªªªªªªªªªªªªªªªªªªªªªªªªªªªªªªªªªªªªªªªªªªªªªªªªªªªªªªªªªªªªªªªªªªªªªªªªªªªªªªªªªªªªªªªªªªªªªªªªªªªªªªªªªªªªªªªªªªªªªªªªªªªªªªªªªªªªªªªªªªªªªªªªªªªªª ªªªªªªªªª ªªªªªªªªªªªªªªªªªªªªªªªªªªªªªªªªªªªªªªªªªªªªªªªªªªªªªªªªªªªªªªªªªªªªªªªªªªªªªªªªªªªªªªªªªªªªªªªªªªªªªªªªªªªªªªªªªªªªªªªªªªªªªªªªªªªªªªªªªªªªªªªªªªªªªªªªªªªªªªªªªªªªªªªªªªªªªªªªªªªªªªªªªªªªªªªªªªªªªªªªªªªªªªªªªªªªªªªªªª ªªªªªªªªªªªªªªªª 40°N 44°N 48°N
4°E 8°E 12°E 16°E
ªªªªªªªª ªªªªªªªª ªªªªªªªª ªªªªªªªª ªªªªªªªª ªªªªªªªª ªªªªªªªª ªªªªªªªª ªªªªªªªª ªªªªªªªª ªªªªªªªª ªªªªªªªª ªªªªªªªª ªªªªªªªª ªªªªªªªª ªªªªªªªª ªªªªªªªª ªªªªªªªª ªªªªªªªª ªªªªªªªª ªªªªªªªª ªªªªªªªª ªªªªªªªª ªªªªªªªª ªªªªªªªª ªªªªªªªª ªªªªªªªª ªªªªªªªª ªªªªªªªª ªªªªªªªª ªªªªªªªª ªªªªªªªª ªªªªªªªª ªªªªªªªª ªªªªªªªª ªªªªªªªª ªªªªªªªªªªªªªªªªªªªªªªªª ªªªªªªªªªªªªªªªªªªªªªªªª ªªªªªªªªªªªªªªªªªªªªªªªª ªªªªªªªªªªªªªªªªªªªªªªªª ªªªªªªªª ªªªªªªªª ªªªªªªªªªªªªªªªª ªªªªªªªª ªªªªªªªªªªªªªªªª ªªªªªªªªªªªªªªªªªªªªªªªª ªªªªªªªªªªªªªªªªªªªªªªªª ªªªªªªªªªªªªªªªªªªªªªªªª ªªªªªªªª ªªªªªªªªªªªªªªªªªªªªªªªª ªªªªªªªªªªªªªªªª
ªªªªªªªªªªªªªªªªªªªªªªªªªªªªªªªªªªªªªªªªªªªªªªªªªªªªªªªªªªªªªªªªªªªªªªªªªªªªªªªªªªªªªªªªªªªªªªªªªªªªªªªªªªªªªªªªªªªªªªªªªªªªªªªªªªªªªªªªªªªªªªªªªªªªªªªªªªªªªªªªªªªªªªªªªªªªªªªªªªªªªªªªªªªªªªªªªªªªªªªªªªªªªªªªªªªªªªªªªªªªªªªªªªªªªªªªªªªªªªªªªªªªªªªªªªªªªªªªªªªªªªªªªªªªªªªªªªªªªªªªªªªªªªªªªªªªªªªªªªªªªªªªª ªªªªªªªªªªªªªªªªªªªªªªªªªªªªªªªªªªªªªªªªªªªªªªªªªªªªªªªªªªªªªªªªªªªªªªªªªªªªªªªªªªªªªªªªªªªªªªªªªªªªªªªªªªªªªªªªªªªªªªªªªªªªªªªªªªªªªªªªªªªªªªªªªªªªªªªªªªªªªªªªªªªªªªªªªªªªªªªªªªªªªªªªªªªªªªªªªªªªªªªªªªªªªªªªªªªªªªªªªªªªªªªªªªªªªªªªªªªªªªªªªªªªªªªªªªªªªªªªªªªªªªªªªªªªªªªªªªªªªªªªªªªªªªªªªªªªªªªªªªªªªªªªª
Fig. 2. Integration domain used for the simulations at 7 km of hori-zontal resolution (top panel) and at 2.8 km of horihori-zontal resolution (bottom panel).
ter vapour and liquid water. The addition of a prognostic treatment of rain and snow (Gassmann, 2002; Baldauf and Schulz, 2004) has been tested, together with the recently de-veloped cloud ice scheme (Doms, 2002).
To test the impact on precipitation forecast of higher hori-zontal resolution, simulations of these case studies have been performed also at 2.8 km. The boundary conditions for these runs have been provided every hour by the 7-km model runs through a one-way nesting procedure.
The paper is organised as follows: in Sect. 2 a short de-scription of the case studies is given, together with the model configuration used. In Sect. 3 the results of the simula-tions are presented, comparing the precipitation forecasts ob-tained with different model set-up. Conclusions are drawn in Sect. 4.
2 Case studies and model configuration
44°N 44°N 45°N 45°N
46°N 46°N
47°N 47°N
7°E 7°E 8°E
8°E 9°E 9°E 10°E
10°E 11°E 11°E 12°E
12°E 13°E 13°E
PRECIPITAZIONE CUMULATA SU 24 ORE +06 +30 2002111500 RIS. 7 KM
0.2 10 20 50 75 100 150 200 500
44°N 44°N
45°N 45°N
46°N 46°N
47°N 47°N
7°E 7°E 8°E
8°E 9°E 9°E 10°E
10°E 11°E 11°E 12°E
12°E 13°E 13°E
0 - 0.2 0.2 - 10 10 - 20 20 - 50 50 - 75 75 - 100 100 - 150 150 - 200 200 - 500
44°N 44°N
45°N 45°N
46°N 46°N
47°N 47°N
7°E 7°E 8°E
8°E 9°E 9°E 10°E
10°E 11°E 11°E 12°E
12°E 13°E 13°E
PREC CUM 24 ORE 2002111500 +06 +30 RIS. 2.8 KM
0.2 10 20 50 75 100 150 200 500
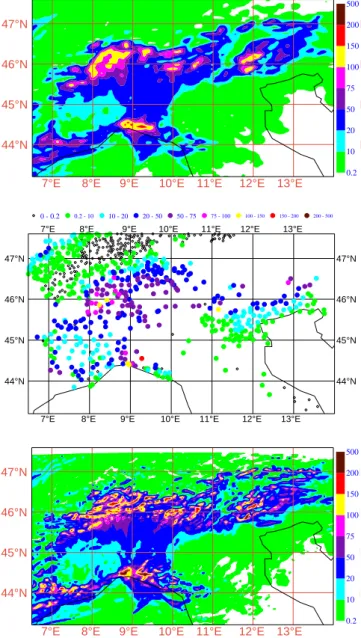
Fig. 3. Cumulated rain field (mm) between 06:00 UTC of 15
Nov. 2002 and 06:00 UTC of 16 Nov. 2002 (first event) for the sim-ulations OPE 7KM (top panel) and OPE 2p8KM (bottom panel). Observational data are shown in the medium panel, the colour scale is the same of the other two figures; the empty diamonds represent stations where no precipitation is observed.
range forecast of the hydro-meteorological events leading to natural hazards, in order to provide guidance during Civil Protection alert conditions.
The two cases are characterised by severe precipitation events affecting Northern Italy and mainly the Piemonte re-gion:
– the first event occurred between 14 and 16 Novem-ber 2002; observed precipitation cumulated over 24 h starting from 15 November 2002 06:00 UTC is shown in the middle panel of Fig. 3; precipitation exceeding 100 mm/24 h were recorded over most of the Northern
25.0m/s
40°N 42°N 44°N 46°N
4°E 4°E 6°E
6°E 8°E 8°E 10°E
10°E 12°E 12°E 14°E
14°E 16°E 16°E
Fig. 4. Wind at 850 hPa forecast at +18 h by the OPE 7KM run starting at 00:00 UTC of the 15 Nov. 2002 (first event).
Piemonte, where sparse peaks were also above 150 mm, and along the Southern border of Piemonte.
On 12 November the synoptic situation showed a weak ridge over the Central Mediterranean Sea and a trough stretching from North-western Europe to the Atlantic coastline of the Iberian Peninsula. During the day, the axis of the trough gradually moved eastward, and the upper level winds became south-westerly over all Northern Italy. This situation permained during the fol-lowing day, because of the high pressure area present over Eastern Europe, which was blocking the eastward motion of the trough. A minimum of the sea level pressure was moving from Ireland to the Iberian Penin-sula and a secondary minimum formed in the afternoon of the 15th over the Balearic Islands, which gradually moved towards the Ligurian Gulf.
– the second event occurred between 24 and 26 Novem-ber 2002; observed precipitation cumulated over 24 h starting from 25 November 2002 06:00 UTC is shown in the middle panel of Fig. 5; precipitation ex-ceeded 50 mm/24 h over a vast Alpine area, with peaks above 100 mm over Northern Piemonte and also above 150 mm in Liguria region.
The synoptic situation was characterised by a deep low off the Irish coastline, that, from 23 November, began to expand southward, reaching the North-African coastline and directing moist air towards Northern Italy. Due to the long duration of the southerly flow, the height of the freezing level was constantly increasing and the relative humidity recorded was always very high, close to 100% up to 5000 m.
A more complete meteorological description of these case studies is given in the paper by Milelli et al. (2005)1.
44°N 44°N 45°N 45°N
46°N 46°N
47°N 47°N
7°E 7°E 8°E
8°E 9°E 9°E 10°E
10°E 11°E 11°E 12°E
12°E 13°E 13°E
PREC CUM 24 ORE 2002112400 +06 +30 RIS. 7 KM
0.2 10 20 50 75 100 150 200 500
44°N 44°N
45°N 45°N
46°N 46°N
47°N 47°N
7°E 7°E 8°E
8°E 9°E 9°E 10°E
10°E 11°E 11°E 12°E
12°E 13°E 13°E
0 - 0.2 0.2 - 10 10 - 20 20 - 50 50 - 75 75 - 100 100 - 150 150 - 200 200 - 500
44°N 44°N
45°N 45°N
46°N 46°N
47°N 47°N
7°E 7°E 8°E
8°E 9°E 9°E 10°E
10°E 11°E 11°E 12°E
12°E 13°E 13°E
PREC CUM 24 ORE 2002112400 +06 +30 RIS. 2.8 KM
0.2 10 20 50 75 100 150 200 500
Fig. 5. Cumulated rain field (mm) between 06:00 UTC of 24
Nov. 2002 and 06:00 UTC of 25 Nov. 2002 (second event) for the simulations OPE 7KM (top panel) and OPE 2p8KM (bottom panel). Observational data are shown in the medium panel, the colour scale is the same of the other two figures; the empty dia-monds represent stations where no precipitation is observed.
over the Mediterranean Sea directed towards the Western Alps. The heavy precipitation is mostly due to the uplift of the moist air by the steep orography, while a convective enhancement of the precipitation, due to local effects, is em-bedded in the large scale systems. An improvement of the QPF for these cases can be expected from a more accurate modelling of the physical processes which determine the dis-tribution of the precipitation.
The LM simulations at 7 km of horizontal resolution pre-sented in this paper are carried out in a configuration some-how different from the operational one. The initial condition and the 3-hourly boundary conditions are supplied by the
Table 1. Analysed simulations for the first event.
– 7 km resolution
Initial time and date Type Label
00:00 UTC of 15 Nov. 2002 OPE OPE 7KM
00:00 UTC of 15 Nov. 2002 QI QI 7KM
00:00 UTC of 15 Nov. 2002 PROGN PROGN 7KM
– 2.8 km resolution
Initial time and date Type Label
00:00 UTC of 15 Nov. 2002 OPE OPE 2p8KM
00:00 UTC of 15 Nov. 2002 QI QI 2p8KM
00:00 UTC of 15 Nov. 2002 PROGN PROGN 2p8KM
00:00 UTC of 15 Nov. 2002 PRO EXP PRO EXP 2p8KM
Table 2. Analysed simulation for the second event.
– 7 km resolution
Initial time and date Type Label
00:00 UTC of 24 Nov. 2002 OPE OPE 7KM
– 2.8 km resolution
Initial time and date Type Label
00:00 UTC of 24 Nov. 2002 OPE OPE 2p8KM
operational ECMWF (European Centre for Medium-range Weather Forecasts) global model. The mesoscale assimila-tion cycle (nudging) is not applied.
The model version operational in 2004 (3.5), released by COSMO in September 2003, is used. The 7-km runs domain is shown in the top panel of Fig. 2. The 2.8-km simulations, whose domain is shown in the bottom panel of Fig. 2, are nested on the 7-km simulations having the same features.
The features of the simulations are in Table 1 for the first case study and in Table 2 for the second one. The terms used in these tables are explained here:
# Initial time and date: represents the starting point of the simulation;
# Type:
– OPE: operational setting with prognostic cloud wa-ter, no cloud ice, diagnostic rain and snow; – QI: cloud ice added as prognostic variable,
44°N 44°N 45°N 45°N
46°N 46°N
47°N 47°N
7°E 7°E 8°E
8°E 9°E 9°E 10°E
10°E 11°E 11°E 12°E
12°E 13°E 13°E
0.2 10 20 50 75 100 150 200 500
44°N 44°N
45°N 45°N
46°N 46°N
47°N 47°N
7°E 7°E 8°E
8°E 9°E 9°E 10°E
10°E 11°E 11°E 12°E
12°E 13°E 13°E
0.2 10 20 50 75 100 150 200 500
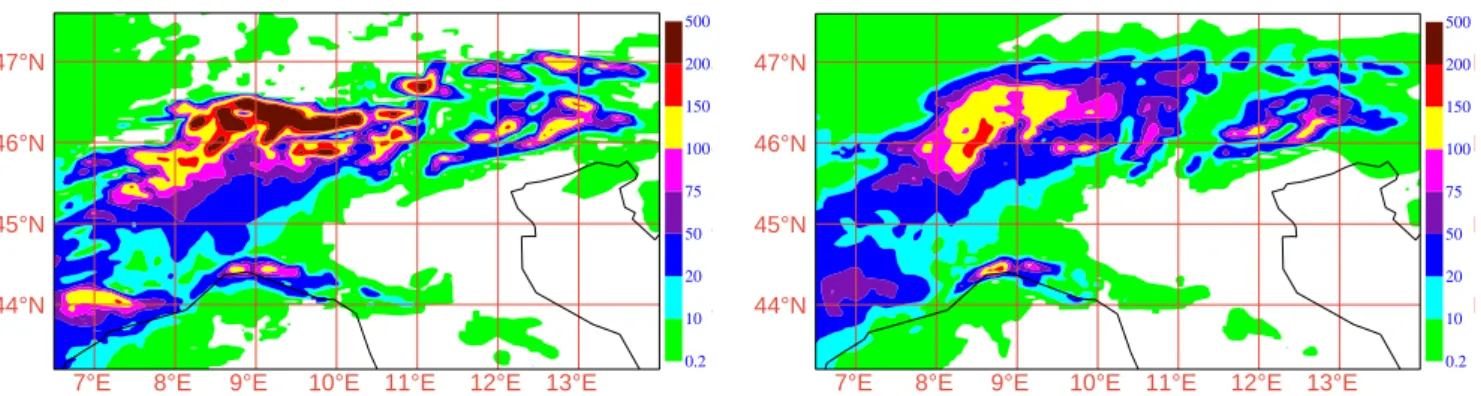
Fig. 6. Cumulated rain field (mm) between 06:00 UTC of 15 Nov. 2002 and 06:00 UTC of 16 Nov. 2002 for the QI 7KM run (left panel) and the PROGN 7KM one (right panel).
– PROGN: cloud ice added as prognostic variable, rain and snow also treated as prognostic variables; – PRO EXP: Tiedtke scheme of precipitating
convec-tion not used; cloud ice added as prognostic able, rain and snow also treated as prognostic vari-ables.
# Label: name used in the text to refer to the simulation; The parametrisation of precipitating convection, based on the Tiedtke scheme (Tiedtke, 1989), is actived in all the 7-km simulations presented here. Moving to 2.8-7-km resolu-tion, where an explicit representation of cumulus convection should be allowed, the Tiedtke scheme has been switched off in one of the first case runs (PRO EXP 2p8KM run, nested on the PROGN 7KM run).
Every simulation, both at 7 km both at 2.8 km resolution, lasts for 36 h.
3 Results
3.1 Impact of resolution
Referring to the first case, in Fig. 3 the forecast rain field is shown for the OPE 7KM (top panel) and for the OPE 2p8KM (bottom panel) runs; precipitation is cumulated over 24 h, from 06:00 UTC to 06:00 UTC. The observed pre-cipitation for the same period is also shown in the medium panel. This accumulation period allows to compare the fore-cast against observations over the whole area where heavy precipitations were recorded, since Swiss observations are available only cumulated over this 24-h period.
The 7-km simulation produces a good forecast as regards the structure of the rain field and its localisation, but precipi-tation is overestimated over the Western Alps, between 9 and 10 degrees East. This is linked to the above mentioned dif-ficulty of models to provide adequate values of the rain field across mountain ridges. Another difference with the obser-vations is the underestimation of the precipitation over the flat part of the Piemonte region in the Western Po Valley.
Considering that the middle-lower tropospheric flow is mainly from the south (see the horizontal wind at 850 hPa
forecast by OPE 7KM simulation at +18 h, Fig. 4), it is ev-ident the overestimation of precipitation is in the upwind side of the Alps (Northern Piemonte and Lombardia regions), while in the downwind side (mainly in Switzerland) there is an underestimation.
When the resolution is increased up to 2.8 km, it is re-markable the breaking-up of the rain field with respect to the correspondent 7-km simulation (comparing the bottom panel with the top one in Fig. 3). At this resolution an appreciable overestimation is also detectable over Liguria. It is natural to link this breaking-up of the precipitation field to the finer resolution representation of the orography, even if the asso-ciated improvement of the forecast, if any, is difficult to be evaluated. This difficulty is due to the inadequacy of the ob-servational network. The availability of a good estimate of the precipitation field from meteorological radars will help, in the future, to face this problem. This breaking-up effect can also be partially produced by the convective precipita-tion scheme, not anymore suitable at this resoluprecipita-tion.
With regard to the second case, the results relative to the OPE 7KM run and OPE 2p8KM run are shown in Fig. 5; the precipitation is cumulated over 24 h, from 06:00 UTC to 06:00 UTC. In the top panel the 7-km forecast is shown, while the 2.8-km one is shown in the bottom panel. The ob-servations for the same period are reported in the medium panel.
The areas interested by intense precipitation are correctly forecast by Lokal Modell at 7 km, but precipitation is still overestimated in some regions, particularly over the Western Alps between 8 and 9 degrees East. The same breaking-up of the precipitation structure when going to 2.8 km is observed (Fig. 5, bottom panel).
44°N 44°N 45°N 45°N
46°N 46°N
47°N 47°N
7°E 7°E 8°E
8°E 9°E 9°E 10°E
10°E 11°E 11°E 12°E
12°E 13°E 13°E
0.2 10 20 50 75 100 150 200 500 700
44°N 44°N
45°N 45°N
46°N 46°N
47°N 47°N
7°E 7°E 8°E
8°E 9°E 9°E 10°E
10°E 11°E 11°E 12°E
12°E 13°E 13°E
0.2 10 20 50 75 100 150 200 500 700
44°N 44°N
45°N 45°N
46°N 46°N
47°N 47°N
7°E 7°E 8°E
8°E 9°E 9°E 10°E
10°E 11°E 11°E 12°E
12°E 13°E 13°E
0.2 10 20 50 75 100 150 200 500 700
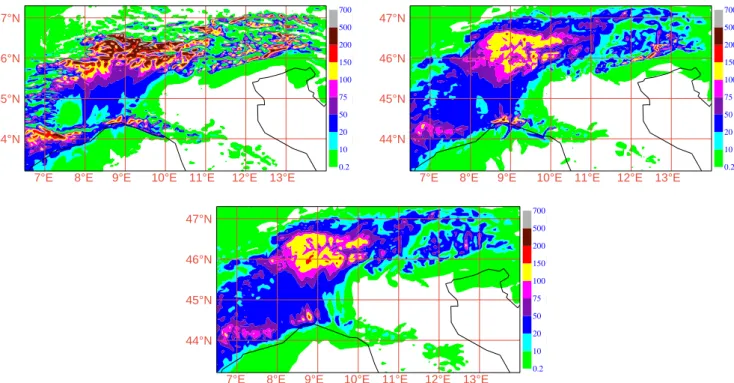
Fig. 7. Cumulated rain field (mm) between 06:00 UTC of 15 Nov. 2002 and 06:00 UTC of 16 Nov. 2002 for QI 2p8KM run (top panel), for the PROGN 2p8KM one (bottom left panel) and for the PRO EXP 2p8KM one (bottom right panel).
44°N 46°N 48°N 6°E 8°E 10°E 12°E
ªªª ªªª ªªª ªªª ªªª ªªª ªªª ªªª ªªª ªªª ªªª ªªª ªªª ªªª ªªª ªªª ªªª ªªª ªªª ªªª ªªª ªªª ªªª ªªª ªªª ªªª ªªª ªªª ªªª ª
0.2 40 80 120 160 200 240 280 319.0
Fig. 8. The red line represents the longitudinal cross-section (the shadowing is the orography field and the colour scale is in decame-ter).
3.2 The use of new prognostic variables
As already mentioned, LM has been recently improved by in-cluding new prognostic equations to better describe the evo-lution of precipitation, either rain or snow. A cloud ice prog-nostic equation has been also included into the model. These new equations should allow for a more physical description of all the processes related to QPF. The important aspect is that precipitation is allowed to be advected in the surround-ing boxes, while previously it was forced to fall out in the same column where it was produced. These model changes are so in the direction to improve the forecast distribution of the precipitation over mountain ranges. This new features have been tested only for the first case study.
In the left panel of Fig. 6 the precipitation forecast by the QI 7KM simulation (where the cloud ice is added as prog-nostic variable, as defined in Sect. 2) is shown. LM simu-lation is starting at 00:00 UTC of 15 November 2002 and precipitation is cumulated over 24 h from +6 up to +30 h. A comparison with the correspondent precipitation from the OPE 7KM run (top panel of Fig. 3) shows a general increase of the precipitation, leading to a further increase of unreal-istic high values. The same is true also for the correspon-dent 2.8 km simulations (top panel of Fig. 7). On the other hand, in the PROGN 7KM simulation (where rain and snow are also treated as prognostic variables) a remarkable reduc-tion of the precipitareduc-tion on the Western Alps and on South-ern France (Fig. 6, right panel) is observed. In particular, the overestimation of the precipitation on the upwind side of the Alps is greatly reduced, with a correspondent reduc-tion of the drying effect in the downwind area. Furthermore, the structure of the forecast rain field is smoother, going in the direction of reducing local and unrealistic precipitation maxima (grid point storms). Similar considerations can be extended also to the PROGN 2p8KM run (bottom left panel of Fig. 7), where a significant improvement is also evident as regards the increase of precipitation in the Western Po Valley. In the bottom right panel of Fig. 7 the PROGN EXP 2p8KM run with explicit precipitating convection (i.e. without the Tiedtke scheme) is shown. The impact of this change is not dramatic. The precipitation field is generally smoother and localised precipitation maxima are reduced or removed.
43O N 44O
N 45O N 46O
N 47O N Latitude 1 2 Orography (km) 0 50 100 150 200 250 300 350 400 450 Precipitation (mm) 43O N 44O
N 45O N 46O
N 47O N Latitude 1 2 Orography (km) 0 50 100 150 200 250 300 350 400 450 Precipitation (mm) 43O N 44O
N 45O N 46O
N 47O N Latitude 1 2 3 Orography (km) 0 50 100 150 200 250 300 350 400 450 Precipitation (mm) 43O N 44O
N 45O N 46O
N 47O N Latitude 1 2 3 Orography (km) 0 50 100 150 200 250 300 350 400 450 Precipitation (mm) 43O N 44O
N 45O N 46O
N 47O N Latitude 1 2 3 Orography (km) 0 50 100 150 200 250 300 350 400 450 Precipitation (mm) 43O N 44O
N 45O N 46O
N 47O N Latitude 0 50 100 150 200 250 300 350 400 450 Precipitation (mm) 43O N 44O
N 45O N 46O
N 47O N Latitude 1 2 3 Orography (km)
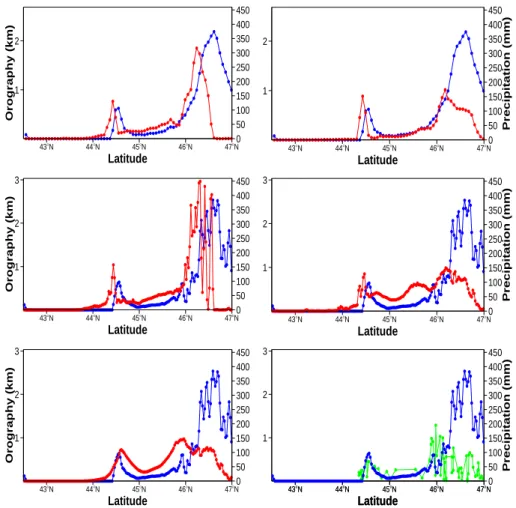
Fig. 9. Longitudinal cross-sections of the orography in km (blue curve) and of the precipitation in mm (red curve), cumulated between 06:00 UTC of 15 Nov. 2002 and 06:00 UTC of 16 Nov. 2002, for the QI 7KM run (top left panel), PROGN 7KM run (top right panel), QI 2p8KM run (medium left panel), PROGN 2p8KM run (medium right panel), PRO EXP 2p8KM run (bottom panel) and for the observa-tions (green curve) interpolated on the 2.8 km longitudinal cross-section. The latitude is in abscissa.
the model orography and the forecast rainfall along the line shown in Fig. 8. The cross-sections relative to the different simulations are shown in Fig. 9, where orography is plotted in blue and precipitation in red. In the bottom right panel of Fig. 9 the observed precipitations, plotted in green, interpo-lated over the same cross-section, are shown as a reference. With regard to the QI 7KM simulation (top left panel), it is evident how the highest and unrealistic precipitation values are forecast in the upwind regions south of the two moun-tain peaks, while almost no precipitation is forecast down-wind. Considering the PROGN 7KM simulation (top right panel), the forecast precipitation is more spread out across the mountain range, with a realistic decrease of maxima and a compensating increase of precipitation minima.
This is even more true for the 2.8-km resolution runs (Fig. 9, medium left panel for the QI 2p8KM run run and medium right panel for the PROGN 2p8KM run). The un-realistic precipitation maxima to the south of the moun-tain peaks, which reach even higher values due to the in-creased resolution, are drastically reduced to more realistic values by adding the prognostic precipitation in the model. In the PRO EXP 2p8KM (bottom left panel of Fig. 9) it is
confirmed the smoother distribution of precipitation and it is worth noting the correct distribution of the precipitation across the Apennines ridge (the southern mountain peak in the cross section).
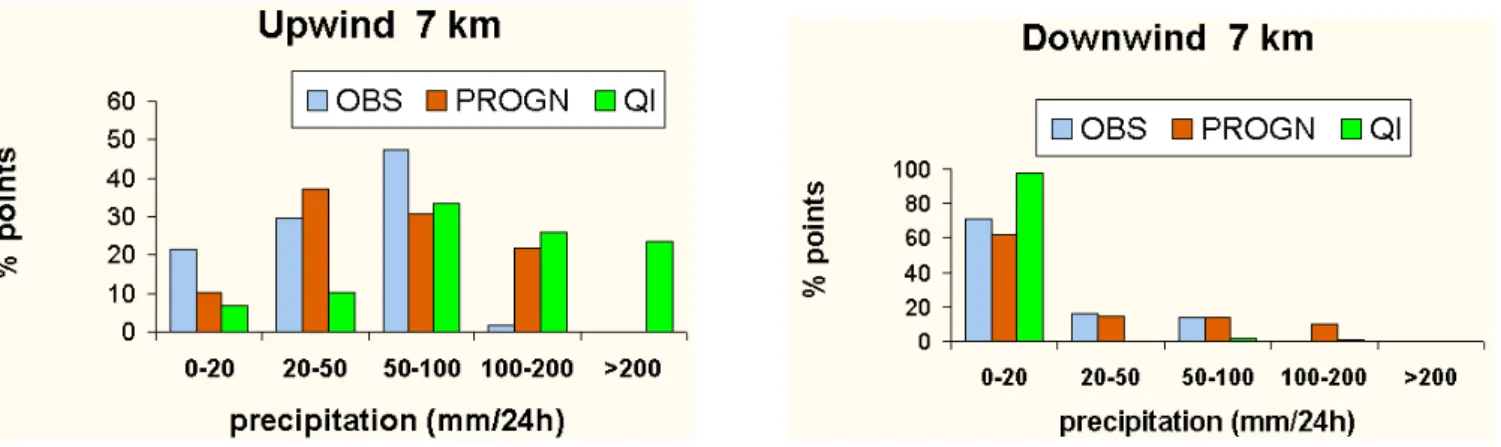
In order to further highlight the positive impact of the prognostic treatment of precipitation and also to allow a com-parison with observations, the distribution of the precipita-tion over two boxes of 1 degree per 1 degree is considered. The boxes are respectively upwind (Fig. 10, the blue one) and downwind (the red one) of the Alpine ridge in the region where the observed precipitation was the most intense.
In Fig. 11 the distributions of the precipitation in the up-wind (left panel) and in the downup-wind (right panel) boxes are shown. The observations (blue histogram) are compared with the forecast values obtained by the QI 7KM run (green histogram) and by the PROGN 7KM run (red histogram).
Fig. 10. Location of the two considered boxes of 1 degree×1 degree, one in the downwind area (red) and the other in the upwind area
(blue), over the orography field in decameters.
In the downwind box (Fig. 11, right panel), the PROGN forecast precipitation distribution fits well the observed one. In particular, while the QI 7KM run forecasts precipitation values are mainly concentrated in the first bin (0–20 mm), in the PROGN 7KM run there is a significant number of points where the forecast values are bigger than 20 mm.
Considering the 2.8 km resolution runs (Fig. 12), the oc-currence of precipitation belonging to the first two ranges (0–20 and 20–50 mm) in the upwind area (left panel) is un-derestimated by both PROGN 2p8KM run and QI 2p8KM run. The very high values (over 200 mm) forecast by the QI run and not observed, are completely removed by the PROGN 2p8KM run. Even if the PROGN 2p8KM run still overestimates the precipitation in the 100–200 mm range, there is a general improvement of the whole distribution.
In the downwind box (right panel), the behaviour is very similar to that of the 7-km runs, the distribution of the pre-cipitation forecast by the PROGN 2p8KM run being rather similar to the observed one. Since the explicit convection in the PRO EXP 2p8KM did not produce a dramatic impact with respect to the PROGN 2p8KM run in the Alpine area, the correspondent histogram is not shown.
4 Conclusions
The performance of the non-hydrostatic limited-area model Lokal Modell in forecasting heavy precipitation over com-plex terrain has been evaluated on some case studies in the framework of the Hydroptimet/INTERREG IIIB project.
Re-sults obtained for the two heavy rainfall events that affected Northern Italy in November 2002 have been presented.
A number of LM runs has been performed on the two cases at two horizontal resolutions, 7 and 2.8 km. Ini-tial and boundary conditions are provided by interpolating the operational ECMWF IFS model. The 7-km simulation with the same setting operational in 2004, but without the mesoscale assimilation cycle, is considered the “reference” run (OPE 7KM). The reference runs for the two cases pro-vide a good forecast of the overall rain structure, but the spatial distribution of the precipitation is badly reproduced across the mountain ranges. Precipitation maxima are in-creased to unrealistic values and displaced to the upwind side of the Alps, while an artificial drying effect is produced on the lee side.
The increase of the horizontal resolution up to 2.8 km maintains the general shape of the precipitation fields, but induces a crumbling of the high precipitation regions with associated sparse and more intense peaks. The problems re-lated to the incorrect distribution of precipitation across the mountain ranges are worsened by the higher resolution.
Fig. 11. Percentage distribution of the precipitations in the upwind (left panel) and in downwind (right panel) areas for the QI 7KM run (green histogram), for the PROGN 7KM run (red histogram) and for the observed precipitation (blue histogram).
Fig. 12. Percentage distribution of the precipitations in the upwind (left panel) and downwind (right panel) areas for the QI 2p8KM run (green histogram), for the PROGN 2p8KM run (red histogram) and for the observed precipitation (blue histogram).
and snow are treated as prognostic variables, there is a re-markable improvement of QPF, with a reduction of the pre-cipitation in the upwind side of the mountain range and an extention of the intense rainfall area to the downwind side. The unrealistic maxima are decreased towards observed val-ues. This positive effect permains also when the Tiedtke convection scheme is switched off in the 2.8 km run. The explicit representation of the convective processes helps in reducing sparse and localised precipitation maxima, leading to a smoother field.
These positive results are highlighted by considering a longitudinal cross-section of the forecast rainfall crossing the Western Po Valley basin and the surrounding mountain ridges. The positive impact of the prognostic treatment of precipitation is clearly visible in the reduction of the upwind maxima, especially at both 2.8 km resolution.
The new model features, and the explicit representation of precipitating convective processes when moving to 2.8 km resolution, give a substantial help in improving the distribu-tion of the forecast precipitadistribu-tion over the mountain ranges.
These heavy precipitation events are still under investiga-tion to evaluate the impact of other model changes on the QPF produced by LM. The improvement of the precipita-tion forecast when increasing the horizontal resoluprecipita-tion up to
cloud resolving scales is still a challenging task. Several op-tions are under testing, focussing on the optimal use of LM as regards intense precipitation events in the Alpine region. The use of QPF as an input to an integrated hydro-meteorological modelling chain is also under evaluation and results will be presented in a forthcoming paper.
Acknowledgements. The work presented here was partially funded
by the INTERREG IIIB/MEDOCC Hydroptimet Project. The
authors thank MeteoSwiss and the other Italian Regions for the observed precipitation data provided.
Edited by: R. Romero
References
Baldauf, M. and Schulz, J. P.: Prognostic precipitation in the Lokal-Modell (LM) of DWD, COSMO Newsletter, No. 4, 177–180, 2004.
Bougeault, P., Houze, R. A., Rotunno, R., and Volkert, H. (Guest Eds.): MAP (Mesoscale Alpine Programme), Quart. J. Royal Meteorol. Soc., 588, Vol. 129, Part B (MAP), 341–899, 2003. COSMO Newsletter No. 4, p. 10, available at http://cosmo-model.
cscs.ch/, 2004.
Doms, G.: The LM cloud ice scheme. COSMO Newsletter, No. 2, p. 128–136, available at http://www.cosmo-model.org, 2002.
Gassmann, A.: 3D-transport of precipitation. COSMO Newsletter, No. 2, p. 113–117, available at http://www.cosmo-model.org, 2002.
Schraff, C. and Hess, R.: A description of the nonhydrostatic re-gional model LM. Part III: Data Assimilation, available at http: //www.cosmo-model.org, 2003.