IJER@2015 Page 216
Numerical Analysis and Experimental Verification of an Industrial Cleaner
Jayapragasan C N , Dr. K Janardhan Reddy
VIT University, Chennai, India.
[email protected], [email protected]
Abstract: Cleaner blowers play an important role in the proper functioning of fluffs collection system for industries. In this paper an industrial blower with three different volute geometries is investigated by using Computational Fluid Dynamics (CFD). And then two new volute geometries are modeled and analyzed based on the air flow through the blower. The numerical investigation revealed that the blowers with modified volute geometries have better outlet velocities. For this work, volute is modeled using Solid Works and meshed in ICEM CFD. The post processing is carried out using CFD POST. The results obtained were then validated and compared the experimental values of the different models of the blowers.
Keywords- Centrifugal fan, Volute geometries, Computational Fluid Dynamics (CFD), Experimental methods
I. Introduction
Cleaner main aim is to deliver the air with an appreciable rise in pressure to overcome resistance in the flow and they can achieve high pressures. The industrial cleaners are used to keep the inside the plant and overall machines clean by travelling over the machinery. These Cleaner blowers suck the air from the inlet and discharge them through the outlets in order to clean the machines and maintain the quality of the product. Parts like fan, volute geometry, vane angle and vane type have an effect on performance of the cleaner. Volute is a passage located around the fan which collects the flow from the fan and delivers at the exit attachment. Volute geometry is one of the main performance parameter of a cleaner and it is varies based on the need of discharge. In volute, tongue geometry and radial distance between impeller and volute are general performance parameters. In this paper, the cleaner construction was analysed to by modifying the volute design of the cleaner blower and aimed to compare the analytical and Experimental results to conclude the performance of an industrial cleaner.
Fig. 1 Cleaner without volute
(a) (b)
Fig. 2 (a) Cleaner with Partition plate (b) Cleaner with Volute After modeling blower with three different volutes, the parts are simplified using ICEM for sake of meshing. Two fluid domains are modeled one around the impeller and other one in the casing. Impeller is defined as a solid domain. The 3D CAD models are imported into ICEM CFD software for meshing.
Notation Nomenclature used
CFD Computational Fluid Dynamics rpm Rotations per minute
mm millimeters m meters
MRF Moving Reference Frame mmwc Millimeters of water column Q Discharge
D Outer diameter of impeller N Fan speed
PTF Total pressure developed by fan m/s Meter per second
cfm Cubic feet per meter Ps Suction Pressure
Table. 1 Geometrical dimensions of the designed blowers
S.no Parameter Dimension
1 Impeller diameter 380mm
2 Inlet diameter 180mm
3 Outlet dimensions 250X78mm (Dia 122
mm Outlet) 4 Impeller rotational speed 383.27 rad/sec
5 Blower casing 550X550X106mm
6 Partition plate dimension 313X106mm
7 Volute diameter 440mm
II.LITERATURE SURVEY
IJER@2015 Page 217 performance experimental and theoretical approach. Volute
geometry is one of the main parameter influence the efficiency of a blower. The volute geometry collects the flow from the impeller and delivers it to the exit duct. Poor volute design leads to the redistribution of low energy fluid at impeller exit which influence the velocity and pressure by blockage [I]. Impeller will be affected seriously due to the poor design of volute, as it leads to non-symmetrical pressure distribution. Volute design not only affects the flow at impeller outlet, but also leads to substantial changes in flow patterns inside the impeller passages [II]. Impeller and tongue interaction is also having an impact on centrifugal blower. Volute tongue creates unsteady forces on the impeller blades and also responsible for flow obstruction and noise generation. Centrifugal blower with different tongue geometries are analyzed numerically, and stated that increasing the distance between the impeller and the volute tongue causes a more favorable aerodynamic force distribution on the impeller which results less noise generation [IV].
Centrifugal blowers generate noise and this noise can be divided in two ways as aerodynamically induced noise and vibration-induced noise. Several research works were done on different types of impeller vane types focusing on problems like noise, vibration and air flow. By numerical and experimental approach it was found that blower with backward impeller have more outlet velocities and flow rates compared with forward and radial impellers [VII]. Lot of research was also done on radial gap between impeller and volute and found that reduction of radial gap will raise the pressure over the volute and causes more noise [VIII].
Prior to mesh the fan is modeled in SLIDOWOKS. The fan needs to be modeled correctly and geometry cleanup required to be done in ICEM CFD for deleting unwanted surfaces. The selection of meshing technique plays a vital role in the analysis. The different mesh parameters are varied to get the best meshing possible [V]. The flow is then simulated by using the popular RANS (Reynolds Averaged Navier Stokes) equation with a proper turbulence model [IV].
Table. 2 Boundary Condition
Materials Air and aluminum
Turbulent model k-omega Shear Stress Transport Navier strokes equation SIMPLE algorithm
Moving reference frame Impeller Inlet conditions Velocity inlet Outlet condition Pressure outlet
Flow Steady state flow
Solver Pressure based solver
III.METHODOLOGY
In this study following methodology was tagged with: - Literature survey
- Analytical results and discussion
- Experimental Study of the volute, partition plate and modified volute
A. Analytical Results and discussion
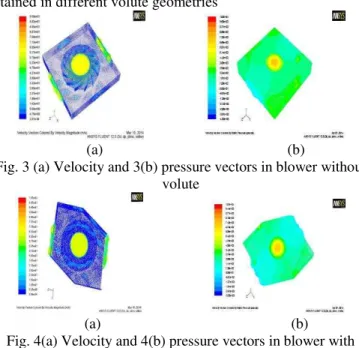
Various values like total pressure, Mass flow rate, velocity are obtained. Fig. 3-5 shows the velocity and pressure vectors obtained in different volute geometries
(a) (b)
Fig. 3 (a) Velocity and 3(b) pressure vectors in blower without volute
(a) (b) Fig. 4(a) Velocity and 4(b) pressure vectors in blower with
partition plate
(a) (b)
Fig. 5(a) Velocity and 5(b) pressure vectors in blower with volute
(a) (b)
Fig. 6(a) Velocity and 6(b) pressure vectors in in changed tongue geometry
Table. 3 Analytical results of Inlet and outlet velocities of 2.2 and 1.5 kw
Blower type
Inlet Power
(kw)
Inlet velocity
(m/s)
Outlet1 (m/s)
Outlet2 (m/s)
Blower without volute
2.2 77.94 65.8 64.05
1.5 67 54.48 56.19
Blower with partition plate
2.2 77.94 60.89 63.67
1.5 67 52.5 54.7
Blower with volute
2.2 77.94 63.8 63.7
IJER@2015 Page 218
(a) (b)
Fig. 7(a) Velocity and 7(b) pressure contours in volute geometry with increased radial gap
Table. 4 Analytical results of Velocities in new volute designs for 2.2 kw
Blower type Inlet Power (kw)
Inlet velocity (m/s)
Outlet1 Outlet 2
Volute with change in
tongue
geometry 2.2
77.94 65.5 67.8
Volute with increase in radial distance
77.94 73.5 76.7
B. Post Processing
Once the convergence was reached in FLUENT, the post processing is done in CFD-POST to obtain the values like static pressure, various velocity contours and total mass flow rate.
C. Experimental Setup
As per the Standard Procedure the Experimental set up was developed and determining the air delivery and pressure of the blower. The fan inlets shall be attached with a parallel duct having the same cross section as the fan outlet and length equal to twice its diameter.
The four side tappings at plane shall be equally spaced at 90 deg. on the cylindrical duct. The four side tappings shall be connected to the manometer, each connection being of the same length, bore and arrangement of tubing to minimize the effect of flow due to difference of pressure at the tappings. The other limb of the manometer shall be opened to the ambient atmosphere and the manometer reading shall be taken as equal to the average static pressure in the airway. A resistance comprising a screen having evenly spaced aperture of uniform size, not exceeding D/20 should be filled at a distance D from the commencement of the cylindrical portion of the inlet. The screen may be composed of one or more layers of even wire or fabric supported by a wire guard.
Fig. 8 Experimental Setup
Fig. 9(a) with volute 9(b) without volute
D.Mathematical Expression
Density of air at conical inlet is taken as a density of air at ambient condition.
R = universal gas constant
The flow rate through the blower was obtained from the discharge head characteristics of the orifice,
Average velocity of air through the duct
Velocity Pressure at the test section
Static Pressure readings at the beginning of the two discharge pipes are just outside the chamber.
Static pressure of the blower Exit = Mean of the static pressure at the two delivery.
Blower output power = 9.81 x q x ∆h
With the help of the above mathematical formulae the flow rate at test conditions, motor input power, flow velocity in the blower outlet duct at test conditions, average velocity of air through the duct are calculated and were used for further calculations. Later on the analytical and experimental values were compared to find out the optimum result giving blower volute parameters.
E. Experimental Data
Table. 5 Experimental Data of Blower without volute 2.2kw
Sl.No Test speed (rpm)
Blower Head hs (static)ΔP (mm
of wc)
Flow rate (m3/hr)
ht (mmwc)
Motor Output power (w)
Blower efficien cy (%)
IJER@2015 Page 219 1 3695 224 217.8 486 224 1042 33.5
2 3672 192.4 188.9 799 200 1170 43.7
3 3660 176.4 171.3 1118 188 1255 53.7
4 3674 153.4 149.2 1305 170 1330 52.2
5 3661 132.8 128.4 1521 160 1375 56.7
6 3648 104 98.7 1657 143 1421 53.5
7 3679 76.8 72.1 1780 128 1449 50.3
8 3678 44.5 39.4 2032 103 1550 43.3
9 3682 38.4 33.5 2201 83 1589 36.7
10 3699 21.5 17.4 2361 72 1704 31.9
Graph. 1 Performance of without volute 2.2kw
Table. 6 Experimental Data of Blower with partition plate 2.2kw
Sl.No Test speed (rpm)
Blower Head hs (static)ΔP (mm
of wc)
Flow rate (m3/hr)
ht (mmwc)
Motor Output power (w)
Blower efficien cy (%)
Duct1 Duct 2
1 3687 208 201 424 208 1065 26.5
2 3669 196 191 621 201 1151 34.7
3 3667 184 178 823 192 1212 41.7
4 3672 164.5 157.8 1269 173 1291 54.6
5 3664 142.7 134.6 1424 163 1334 55.7
6 3641 132 128 1543 166 1403 58.5
7 3687 98.7 91.4 1742 137 1446 52.8
8 3682 65.5 59.4 2030 117 1508 50.6
9 3689 51 44.8 2197 93 1565 41.8
10 3699 34.7 29.5 2397 84 1681 38.3
Graph. 2 Performance of with partition plate 2.2kw
Table. 7 Experimental Data of Blower with change in tongue 2.2kw
Sl.No Test speed (rpm)
Blower Head hs (static)ΔP (mm of wc)
Flow rate (m3/hr)
ht (mmwc)
Motor Output power (w)
Blower efficiency (%)
Duct1 Duct 2
1 3695 220 215 448 220 1042 30.3
2 3672 190.1 187 769 196 1130 42.8
3 3662 175.6 169 1091 185 1254 51.5
4 3674 150.5 148.5 1281 163 1310 51.1
5 3664 130.5 127.6 1489 154 1374 53.3
6 3645 101 97.5 1643 137 1422 50.8
7 3679 75.5 72 1759 120 1469 45.9
8 3675 42.5 38.5 2016 100 1551 41.5
9 3680 36 32 2252 76 1589 34.5
10 3695 19.5 18 2440 65 1683 30.1
Graph. 3 Performance of change in Tongue 2.2kw
0 500 1000 1500 2000 2500 3000
0 200 400 600 800 1000 1200 1400 1600 1800
Perfor a ce Characteristics with partitio plate – 2.2 kw
Mass flow rate (cum/hr)
T ot al P ressure (mmwc) Air P ower (W)
Blower Efficiency (%)
0 500 1000 1500 2000 2500
0 200 400 600 800 1000 1200 1400 1600
1800Performance characteristics of change in tongue 2.2 kw
Mass flow rate (cum/hr)
T ot al P ressure (mmwc) Air P ower (W )
Blower Efficiency (%) 0 500 1000 1500 2000 2500
0 200 400 600 800 1000 1200 1400 1600 1800
Performance characteristics of without volute 2.2 KW
Mass flow rate (cum/hr.)
T ot al P ressure (mmwc) Air P ower (W )
IJER@2015 Page 220 Graph. 4 Performance of increase in radial clearance 2.2kw
Table. 8 Experimental Data of Blower with increase in radial clearance 2.2kw
Sl.No Test speed (rpm)
Blower Head hs (static)ΔP (mm
of wc)
Flow rate (m3/hr)
ht (mmwc)
Motor Output power (w)
Blower efficienc y (%)
Duct1 Duct 2
1 3695 231 228 927 232 1039 66.1
2 3672 207.5 198 1054 210 1130 62.9 3 3662 197.6 184.5 1287 203 1256 66.9
4 3674 174.5 167.5 1509 184 1314 68
5 3664 156.7 142 1727 174 1379 70
6 3645 132.1 128.6 1888 169 1422 71.8
7 3679 84.3 79 2308 127 1467 64.1
8 3675 51.2 46.8 2495 108 1549 55.7
9 3680 43.5 39.1 2605 83 1586 43.6
10 3695 24.2 21.2 2819 69 1680 36.9
Table. 9 Comparison of Analytical and Experimental results
Blower type
Analytical Experimental
Mass flow rate cum/hr
Total Pressure in mmwc
Mass flow rate cum/hr
Total Pressure in mmwc
Without volute 2780 240 2361 224 With partition
plate 2600 240 2394 208
Change in
tongue 2783 240 2440 220
Increase in
radial clearance 3136 240 2819 232
Table. 10 Comparison of Experimental results
Blower type
Input power in
kw
Motor output in watts
(Max)
Efficiency % (Max)
Without volute
2.2 1704 56.4
1.5 1462 45.5
With partition plate 2.2 1681 58.5
1.5 1444 37.7
Change in tongue 2.2 1683 53.3
Increase in radial
clearance 2.2 1680 71.8
IV.RESULTS AND DISCUSSION
Various parameters like static pressure, total pressure, air power, velocity were calculated with available experimental data and the analytical data available with us. Table 5 to Table 10 gives us the details of those calculations.
Following graphs show the air delivery characteristics of the air of various models based on the experimental data. The graphs are plotted with total pressure, power and efficiency verses mass flow rate. It has been observed from the graphs that as the mass flow rate at the outlet increases the total pressure and efficiency decreases accordingly. It has been also observed that there is a change in velocity.
V.CONCLUSION
This paper deals with the approach of comparing the analytical and experimental results for various models of blowers developed by us. The CFD approach helps to improve the results in the present system. Result validation helps us to substantiate our physical model by exploiting the analytical software ICEM-CFD, CFD-FLUENT and CFD-POST. The obtained results are satisfactory in the increase in radial clearance model of the blower as the range of increased mass flow rate is 19.3% and efficiency is 5.1% without increasing the power. Also from the available results, both analytical and experimental, it can be concluded that the increased in radial distance model gives the optimum results and can be used in the industry for better functionality in real working conditions due to high pressure and mass flow rate requirement.
VI.FUTURE SCOPE
This area of research has a vast scope for further studies and implementation. The design optimization of the model can be done by conducting many trials with available models, better results can be obtained and validation for the same can be done. For different parameters and levels of the models available with us good results can be obtained. The blower performance can be checked continuously after varying the parameters and experimental values can be compared with the obtained analytical values. With the help of satisfactory results the design variation can be implemented in the current model.
REFERENCES
500 1000 1500 2000 2500 3000
0 200 400 600 800 1000 1200 1400 1600 1800
rformance characteristics of increasing in radial clearance- 2.2 k
Mass flow rate (cum/hr)
T ot al P ressure (mmwc) Air P ower (W )
IJER@2015 Page 221
i. Beena D. Baloni and Salim A. Channiwala(2013). Numerical investigation of the flow pattern within the impeller of a centrifugal blower. 3rd International Conference on Mechanical, Automotive and Materials Engineering, pp. 92-96, Singapor.
ii. Chehhat Abdelmadijid, Si-Ameur Mohamed and Boumeddane Boussad(2013). CFD analysis of the volute geometry effect on the turbulent air flow through the turbocharger compressor. Terra green conference, pp. 746-755.
iii. Fluent 14.0. User’s guide. Fluent Inc; 2013. iv. Honggeng Zhu, Rentian Zhang, Guoqiang Luo and Bin Zhang(2012). Investigation of Hydraulic Characteristics of a Volute-type Discharge Passage based on CFD. International Conference on Modern Hydraulic Engineering, Vol. 28, pp. 27-32.
v. Jayapragasan C.N., Sumedh J. Suryawanshi, Janardhan Reddy K., (2014). Design Optimization of Centrifugal Fan of Travelling Cleaner, International Conference on trends in Product Lifecycle, Modeling, Simulation and Synthesis, PLMSS-2014, Jan6-8, VIT, Vellore.
vi. Krishna.V, Naresh kumar.K and Prasanth kumar.M(2013). Numerical analysis of centrifugal blower using CFD. International journal of engineering and technology, Vol. 2, pp. 1461-1463.
vii. Kui Jiao, Harold Sun, Xianguo Li, Hao Wu, Eric Krivitzky, Tim Schram, and Louis M.Larosiliere(2009). Numerical simulation of air flow through turbocharger compressors with dual volute design. Applied Energy, Vol. 86, pp. 2494-2506.
viii. Li Chunxi, Wang Song Ling and Jia Yakui(2011). The performance of a centrifugal fan with enlarged impeller. Energy Conversion and Management, Vol. 52, pp. 2902-2910.
ix. Mona Golbabaei Asl, Rouhollah Torabi , Ahmad Nourbakhsh.S (2009). Experimental and FEM failure analysis and optimization of a centrifugal-pump volute casing, Engineering Failure Analysis, Vol. 16, pp.1996-2003.