ISSN 0104-6632 Printed in Brazil
Brazilian Journal
of Chemical
Engineering
Vol. 20, No. 04, pp. 455 - 463, October - December 2003
FRICTION LOSSES IN VALVES AND FITTINGS
FOR POWER-LAW FLUIDS
M.A.Polizelli
1, F.C.Menegalli
2, V.R.N.Telis
1and J.Telis-Romero
1*1
Departamento de Engenharia e Tecnologia de Alimentos, Universidade Estadual Paulista, Phone (55) (17) 221-2251, Fax (55) (17) 221-2299, 15054-000,
São José do Rio Preto - São Paulo, Brazil. E-mail: [email protected] 2
Departamento de Engenharia de Alimentos, Universidade Estadual de Campinas, 13083-970, Campinas - São Paulo, Brazil
(Received: October 5, 2002 ; Accepted: July 11, 2003)
Abstract - Data on pressure drop were obtained in stainless steel, sanitary fittings and valves during laminar and turbulent flow of aqueous solutions of sucrose and xanthan gum, which were selected as model fluids. The rheological properties of these solutions were determined and the power-law model provided the best fit for experimental data. Friction losses were measured in fully and partially open butterfly and plug valves, bends and unions. Values of loss coefficients (kf) were calculated and correlated as a function of the generalized Reynolds
number by the two-k method. The model adjustment was satisfactory and was better in the laminar flow range (0.976 ≤ r2≤ 0.999) than in the turbulent flow range (0.774 ≤ r2≤ 0.989). In order to test the adequacy of the results for predicting loss coefficients during flow of real fluids, experiments were conducted with coffee extract. Comparison between experimental and predicted loss coefficients showed very good agreement.
Keywords: pressure drop; non-Newtonian fluids, friction factors, loss coefficients.
INTRODUCTION of piping systems often find it difficult to obtain the
necessary resistance coefficient values, since the amount of available data in the literature is quite limited. The Crane Company (1982) published an extensive tabulation of loss coefficients for turbulent flow of Newtonian fluids. For this same class of fluids, flowing under laminar conditions, the classic reference is the Chemical Engineer’s Handbook (Perry and Chilton, 1986), while Kittredge and Rowley (1957) have also published some data. Other research has been conducted on non-Newtonian fluids, mainly for pseudoplastic fluids in laminar flow (Martínez-Padilla and Linares-García, 2001; Telis-Romero et al., 2000; Banerjee et al., 1994; Das et al., 1991; Edwards et al., 1985; Steffe et al., 1984). Turian et al. (1998) provided loss coefficients for turbulent flows of concentrated non-Newtonian slurries, whereas Griskey and Green The design of piping and pumping systems for
chemical, pharmaceutical and food processing industries requires knowledge of the pressure drop due to flow in straight pipe segments and through valves and fittings. Friction losses caused by the presence of valves and fittings usually results from disturbances of the flow, which is forced to change direction abruptly to overcome path obstructions and to adapt itself to sudden or gradual changes in the cross section or shape of the duct.
Evaluation of the friction loss in valves and fittings involves determination of the appropriate loss or resistance coefficient, k, which is calculated from experimental measurement of the pressure drop in the fitting.
The Fanning friction factor is defined as (Garcia and Steffe, 1987)
(1971) presented data for dilatant fluids.
Except for the work of Martínez-Padilla and Linares-García (2001) and Steffe et al. (1984), experimental data on resistance coefficients have been collected using carbon steel valves and fittings. Nevertheless, in the food, the pharmaceutical and some chemical industries, fluids should be handled by means of sanitary piping components, which are made of stainless steel and often have distinct design patterns in order to assure hygienic cleanliness and bacteriological safety.
2
PD f
2 v L
∆ =
ρ (4)
where ∆P is the pressure drop observed in a length L of straight tube.
In the case of laminar flow, the friction factor can be obtained from a simple function of the generalized Reynolds number, which is identical to the dimensionless form of the Hagen-Poiseuille equation (Darby, 2001)
Considering the lack of published data and the practical importance of their knowledge, the purpose of this work was to obtain loss coefficients in the laminar and turbulent flows of power-law fluids through stainless steel, sanitary valves and fittings.
g
16 f
Re
= (5)
Friction Loss in Valves and Fittings
in which In the flow of an incompressible fluid through a
horizontal section of uniform pipe with no work input/output, the mechanical energy balance can be written as (Darby, 2001)
( ) ( )
n 2 n
n
g n 1
D v 4n
Re 1 3n 8 K − − ρ = +
(6)
Equations (5) and (6) can be used for both Newtonian and power-law fluids, since for Newtonian fluids the behavior index, n, equals 1, and the consistency index, K, equals the dynamic viscosity, η, for Newtonian fluids. In this case the generalized Reynolds number (Equation 6) reduces to Re=Dvρ η.
1 2
P - P
F
=
ρ
∑
(1)where P is the flow pressure and ρ is the fluid density, while the subscripts indicate points 1 and 2, respectively. The term accounts for the friction
losses, which include losses in the straight pipe section and from expansions, contractions, valves and fittings in the system. These can be formulated as
F
∑
Friction factors for Newtonian fluids in turbulent flow can be calculated by the Nikuradse correlation, an empirical modification of the von Karman equation given by
2 2 f k v 2fv L F D 2 = +
∑ ∑
∑
(2) 1(
)
4.0log Re f - 0.4
f = (7)
The friction losses in straight portions of the piping system are based on the Fanning friction factor, f, and are represented by the first term at the right of Equation (2), where v is the average flow velocity, D is the inside diameter of the tube and L the tube length. Pressure drops in valves and fittings are calculated with the loss coefficient, kf, as in the last term of the same equation.
According to Darby (2001), Equation (7) is also known as the von Karman-Nikuradse equation and agrees well with experimental data for friction loss over the range 5x10³ < Re < 5x10⁶.
An empirical equation that gives results similar to those of Equation (7) was proposed by Drew et al. (apud Govier and Aziz, 1972) and has the advantage of being simpler, as is explicit in f:
Equations (1) and (2) can be combined to permit the experimental determination of kf in the following
way: f =0.00140+0.125 Re−0.32 (8)
2 1 2 f 2 P P 2 2f k D v − = − ρ Lv
( )
(
1 n 2)
g
0.75 1.2
1 4 0.
log Re .f
f n n
−
= − 4 (9)
The above equations are applicable to smooth pipes, which include sanitary piping systems for food and pharmaceutical products (Steffe, 1996).
Under conditions of laminar flow, the pressure drop coefficients for fittings and valves also change as a function of the Reynolds number, with increasing values of kf for a decreasing Reynolds number (Kittredge and Rowley, 1957; Steffe et al., 1984; Telis-Romero et al., 2000). Some equations are traditionally used to correlate this dependence, such as the potential equation for Newtonian fluids, suggested for the first time by Kittredge and Rowley (1957):
( )
Bf
k =A Re − (10)
A less traditional approach is the two-k method developed by Hooper (1981), which correlates the pressure drop coefficient with the Reynolds number and the fitting diameter through the following equation:
(
f 1
k =k Re+k∞ 1 1 D+
)
(11)MATERIALS AND METHODS
Model Fluids
Solutions of xanthan gum (Star & Art, Brazil) and sucrose (commercial grade) were prepared at three different concentrations of xanthan gum (0.05, 0.15 and 0.25% w/w) and sucrose (10, 20, and 30% w/w). The solutes were dissolved in distilled water with the help of a mechanical agitator (Marconi, model MA59, Brazil). The mixing time was set at 20 minutes. In order to guarantee the complete hydration of the polymer, samples were kept at rest in a refrigerated chamber (10° C) during 24 hours. Densities of the model solutions were obtained by picnometry.
Rheological Properties
Rheological measurements were taken using a Rheotest 2.1 viscometer (MLW, Germany) of the Searle type, equipped with a coaxial cylinder sensor (radii ratio, Rext/Rint = 1.04). A thermostatic bath was used to keep the working temperature at 32° C. The instrument was operated at 44 different speeds (from 0.028 to 243 rpm), which were changed stepwise with a selector switch. Shear stress values (σ) were obtained by multiplying torque readings by the
viscometer constant, while shear rate values were obtained according to Krieger and Elrod (1953).
The performance of the viscometer was checked using two fluids with well-known rheological properties: ethylene glycol and chlorobenzene, which have Newtonian behavior. Twenty-three repetitions were accomplished to determine the rheological properties of each fluid at each of the working temperatures (-5, 10 and 70° C for ethylene glycol and –22, 0 and 20° C for chlorobenzene).
Pressure Drop Experiments
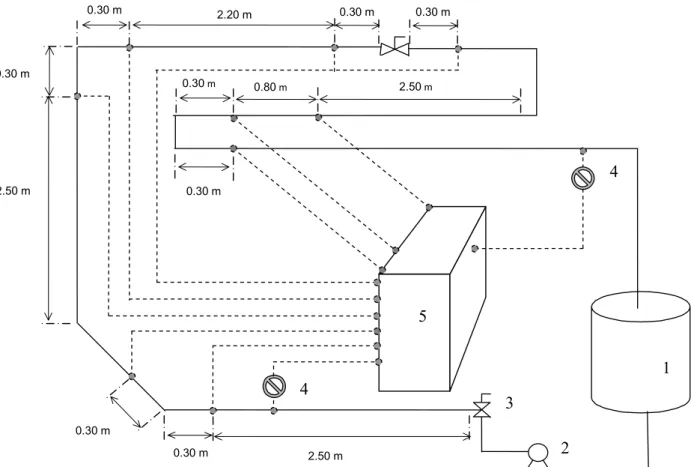
The apparatus shown schematically in Figure 1 was used for measuring pressure drop in the following stainless steel, sanitary fittings: 180°, 90° and 45° bends; union; fully open and partially open (10°, 20°, 40° and 60° opening angles) butterfly valve; and fully open and half-open plug valve.
The equipment consists of a stainless steel piping system connected to a stainless steel cylindrical tank with a capacity of 100 liters (1). Circular tubes with three different external diameters (25.4 mm, 38.1 mm and 50.8 mm) and a wall thickness of 2.87 mm were used, and a positive displacement pump (KSB, model Triglav) (2) pumped the solutions. A butterfly valve was used to regulate the flow (3) and flow rate was measured by weighing fluid samples collected at determined time intervals. Temperature transmitters (SMAR, model TT302) were used to measure temperature (4). Differential pressure transmitters (SMAR, model LD302) connected to pipes with silicon tubes were installed throughout the equipment to measure static pressure. Flow pressure varied from 0.209 kPa to 4.352 kPa. A HP data logger model 75.000-B, an interface HP-IB and an HP-PC running a data acquisition and control program written in IBASIC monitored temperatures and pressures (5).
Performance of the apparatus was checked using ethylene glycol, which was pumped through the equipment at 31 different flow rates in the laminar range and 25 flow rates in the turbulent domain. At each flow rate, pressure drop in a straight pipe section of 0.80 m was measured with ten repetitions made at five-minute intervals.
1
2 3
2.50 m
0.30 m
0.30 m 2.20 m
2.50 m 0.30 m
0.30 m 0.30 m 0.30 m
2.50 m 0.30 m
0.30 m
0.80 m
4
4
5
Figure 1: Schematic diagram of the experimental setup. Distances are in meters.
Table 1: Rheological properties of the standard fluids.
Temperature
(°C)
µexp
(mPa.s)
Standard Deviation (mPa.s)
Standard Error (mPa.s)
µpred*
(mPa.s)
Ethylene glycol
CH2OHCH2OH
- 5
10 70
57.70
34.22 4.511
1.36
1.38 0.08
0.28
0.29 0.02
58.2
34.0 4.51
Chlorobenzene
C6H5Cl
-22 0
20
1.632 1.291
0.922
0.003 0.007
0.013
0.001 0.002
0.003
1.63 1.29
0.91 * Data from Perry and Chilton (1986).
RESULTS AND DISCUSSION
Rheological Properties
The accuracy of the viscometer used for the rheological measurements can be observed in Table 1, which compares the experimental viscosity of ethylene glycol and chlorobenzene with data published by Perry and Chilton (1986). Based on the
experimental viscosities and their respective standard deviations and standard errors (also included in Table 1 and calculated as shown by Telis-Romero et al., 2002), it is possible to say that the values obtained were very close to the data in the literature.
power-law, Bingham and Herschel-Bulkley models (Equations 12, 13 and 14, respectively) were tested in order to obtain the best fit to the rheological curves. In Equations 12 to 14, σ is the shear stress, the shear rate, σ
γ
0 the yield stress, K the fluid consistency index and n the flow behavior index (Steffe, 1996). The adequacy of the models was evaluated by the magnitude of the root mean square, RMS (Gabas et al., 2002), and the correlation coefficient (r2).
n
K
σ = γ (12)
0 K
σ = σ + γ (13)
n
0 K
σ = σ + γ (14)
Use of the Herschel-Bulkley model produced a slightly better adjustment (0.37 ≤ RMS ≤ 1.75, r2 ≥ 0.998) of the rheological curves than use of the power-law model (0.43 ≤ RMS ≤ 1.73, r2 ≥ 0.998). This was already expected since the former is a three-parameter model, while the latter is a two-parameter one. The Bingham model did not produce a satisfactory adjustment, with RMS values in the range of 7.23 to 11.31 and correlation coefficients between 0.911 and 0.954.
Even though the Herschel-Bulkley model provided better statistical results, the yield stress values obtained were small (0.14 ≤ σ0 ≤ 2.80), including some negative values, which is meaningless from a physical standpoint. Thus, the
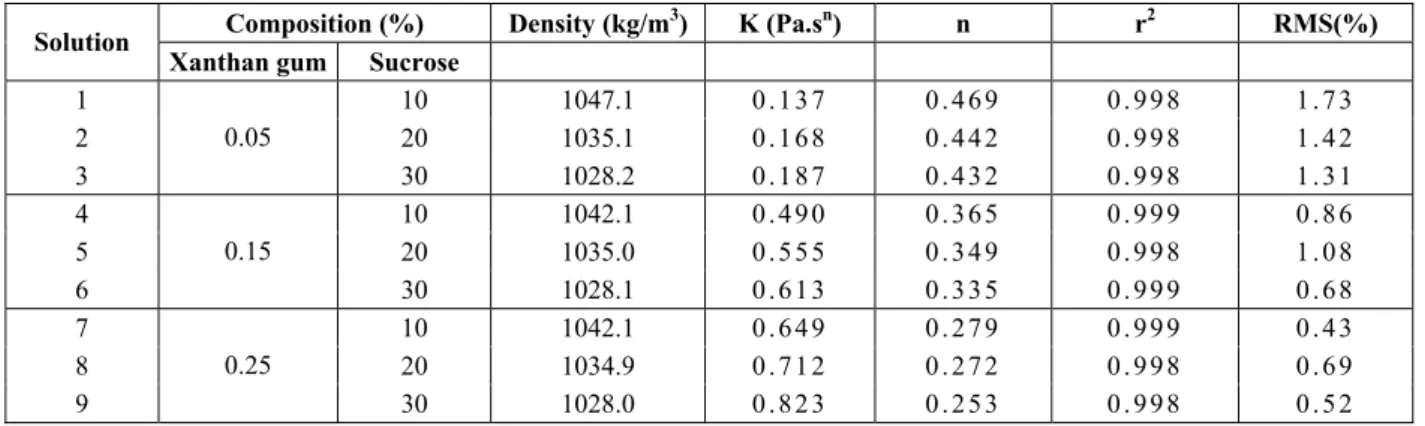
power-law, also called the Ostwald de-Waele model, was selected to describe the rheological behavior of the model solutions. Table 2 contains the rheological parameters, K and n, as well as the RMS and r2 values for Equation (12).
Using the power-law model, statistical analysis of K and n dependence on solution composition showed that the consistency index (K) is significantly affected (p < 0.05) by the xanthan gum and sucrose weight fractions. K increased with the square of the xanthan gum concentration, while increasing sucrose concentration led K to increase linearly. The flow behavior index was also significantly affected (p < 0.05) by both solutes. This parameter decreased linearly with increasing xanthan gum and sucrose concentration.
Pressure Drop
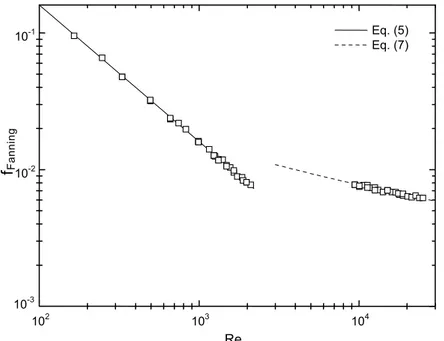
In order to evaluate the measurement of pressure drop in the system, experimental data obtained during flow of ethylene glycol were used. Pipe dimensions, experimental density and measured pressure drop were substituted into Equation (4) to give the friction factor, f. This was then correlated with the Reynolds number calculated by Equation (6) using the experimental rheological parameters, in this case n=1 and K=η. These results are shown in Figure 2, which also includes predictions of Equation (5) for the laminar region and of Equation (7) for turbulent conditions. The agreement between experimental and predicted values is very satisfactory, indicating the adequacy of the equipment and methodology used.
102 103 104
10-3 10-2
10-1 Eq. (5)
Eq. (7)
fFanning
Re
Experimental friction factors for ethylene glycol were also submitted to nonlinear regression analysis, resulting in Equations (15) and (16) for laminar and turbulent flow, respectively.
0.997
15.56 f
Re
= (15)
0.28
0.089 f 0.00113
Re
= + (16)
Equation (15) was adjusted in the range of 165 < Re < 2,105 with a correlation coefficient, r2, of 0.999, and the parameters obtained were very similar to the theoretical values in Equation (5). Taking into account the turbulent region (Reynolds varying from 9,428 to 25,141), Equation (16), which resulted in an r2 value of 0.905, could be compared with the correlation proposed by Drew et al. (Equation 8). In this case, the parameters obtained in the present work were a little different from those in Equation (8), but of a similar order of magnitude. These results also confirm the suitability of the experimental apparatus.
When measuring pressure drop in fittings and valves, inclusion of an additional loss in the experimental value due to a straight piping section is unavoidable. This contribution should then be subtracted from the total in such a way that the remaining value expresses only the fitting friction loss. Friction factors corresponding to straight piping sections during flow of xanthan gum/sucrose solutions were determined with Equation (4), substituting pipe dimensions, densities from Table 2 and experimental values of pressure drop. The results, shown in Figure 3, were correlated with the generalized Reynolds number (Equation 6), also calculated with physical properties from Table 2 and experimental values of flow velocity. In addition to the experimental friction factors, Figure 3 includes the predictions of Equation (5) for the laminar range and of the Dodge and Metzner correlation (Equation 9) for the turbulent region.
The loss coefficients, kf, for fittings and valves were obtained with Equation (3), using the experimental values of flow velocity, pressure loss, friction factors in the pipe and densities from Table 2. The two-k method proposed by Hooper (Equation 11) was adjusted to the results obtained by nonlinear regression, using the root mean square and regression coefficient to evaluate adjustment quality.
The resultant parameters of Equation (11), k1 and k∞, are shown in Tables 3 and 4, respectively for the
laminar and turbulent flow regimes. In these tables, the RMS and r2 values were also included. Based on the values of RMS and regression coefficients, it can be observed that agreement between the experimental data and the adjusted model is better for the laminar than for the turbulent flow, which had already been verified for the experiments conducted with ethylene glycol. It was also observed that fittings that cause a larger pressure drop and therefore greater flow turbulence led to the poorest adjustment of Equation (11), indicating once again that the experimental procedure was more reliable in the absence of turbulence.
With the purpose of testing the validity of the parameters obtained, k1 and k∞, pressure drop in the
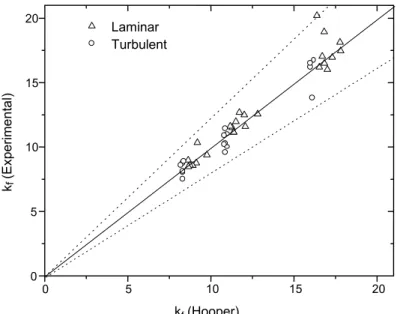
same fittings and valves was measured during flow of coffee extract. Telis-Romero et al. (2001) presented the rheological properties for coffee extract as functions of temperature and concentration, and in the present work, three concentrations of the extract (36, 42 and 51°Brix) were selected in order to guarantee pseudoplastic behavior at the experimental temperature (32° C). Figure 4 illustrates the comparison between experimental resistance coefficients values, calculated using Equation (3), and those predicted by the two-k method (Equation 11) with parameters from Table 3 and 4, respectively for the laminar and the turbulent flow ranges for a 90° bend. The observed agreement was very satisfactory, with only a few data points having deviations as large as ±20%.
Table 2: Composition, density and rheological parameters of the model solutions.
Composition (%) Density (kg/m3) K (Pa.sn) n r2 RMS(%) Solution
Xanthan gum Sucrose
1 10 1047.1 0 . 1 3 7 0 . 4 6 9 0 . 9 9 8 1 . 7 3
2 20 1035.1 0 . 1 6 8 0 . 4 4 2 0 . 9 9 8 1 . 4 2
3
0.05
30 1028.2 0 . 1 8 7 0 . 4 3 2 0 . 9 9 8 1 . 3 1
4 10 1042.1 0 . 4 9 0 0 . 3 6 5 0 . 9 9 9 0 . 8 6
5 20 1035.0 0 . 5 5 5 0 . 3 4 9 0 . 9 9 8 1 . 0 8
6
0.15
30 1028.1 0 . 6 1 3 0 . 3 3 5 0 . 9 9 9 0 . 6 8
7 10 1042.1 0 . 6 4 9 0 . 2 7 9 0 . 9 9 9 0 . 4 3
8 20 1034.9 0 . 7 1 2 0 . 2 7 2 0 . 9 9 8 0 . 6 9
9
0.25
102 103 104 105 10-2
10-1
n = 0.6 Eq. (5)
Eq. (9)
n = 0.5 n = 0.9 n = 0.7
n = 0.4 n = 0.3
fFanning
Reg
Figure 3: Experimental and predicted friction factors for xanthan gum/sucrose solutions.
Table 3: Parameters for calculation of loss coefficients by the two-k method (Equation 11) in laminar flow.
Fitting k1 k∞ RMS r2
Fully open butterfly valve 9.084 0.0240 1.54 0.998
10o open butterfly valve 14.83 0.0399 2.07 0.995
20o open butterfly valve 298.0 0.8018 2.07 0.995
40o open butterfly valve 1184.6 3.244 3.27 0.988
60o open butterfly valve 22579 59.63 4.72 0.976
Fully open plug valve 1022.9 0.2400 4.68 0.994
Half-open plug valve 1768.0 0.3964 7.77 0.984
45o bend 503.7 0.2486 1.56 0.999
90o bend 812.2 0.3955 3.11 0.997
180o bend 1001.5 0.7066 2.06 0.998
Union 24.86 0.0127 1.51 0.999
Table 4: Parameters for calculation of loss coefficients by the two-k method (Equation 11) in turbulent flow.
Fitting k1 k∞ RMS r2
Fully open butterfly valve 118.7 0.1587 1.89 0.974
10o open butterfly valve 131.2 0.3862 4.67 0.859
20o open butterfly valve 250.5 1.136 7.40 0.796
40o open butterfly valve 1747.7 7.112 7.41 0.795
60o open butterfly valve 69778 88.37 8.53 0.636
Fully open plug valve 995.5 0.2402 5.27 0.783
Half-open plug valve 1937.7 0.4110 4.31 0.854
45o bend 465.1 0.2495 0.97 0.989
90o bend 798.9 0.3939 2.09 0.966
180o bend 1089.6 0.6622 7.30 0.774
0 5 10 15 20 0
5 10 15 20
Laminar Turbulent
kf
(E
x
p
e
rime
n
ta
l)
kf (Hooper)
Figure 4: Comparison of 90° bend loss coefficients using the two-k parameters obtained in this work and experimental values obtained during flow of coffee extract. Dotted lines indicate ± 20% deviations.
CONCLUSIONS D Inside diameter of tube, m
f Fanning friction factor K Fluid consistency index, Pa.sn The rheological behavior of the model solutions
could be described well by the power-law model, with K and n being significantly affected (p < 0.05) by the xanthan gum and sucrose fractions. The experimental apparatus used for measuring friction losses during fluid flow through valves and fittings was shown to be satisfactory, and loss coefficients, kf, were calculated for fully and partially open butterfly and plug valves, bends and union. The two-k method proposed by Hooper could be adjusted to the data obtained, resulting in good agreement between predicted and experimental values. Measurement of pressure drops in the same fittings and valves carried out during flow of coffee extract showed that the adjusted parameters were also adequate to predict loss coefficients of real fluids.
k∞, k1 Constants in Equation (11) kf Loss or resistance coefficient L Tube length, m
n Flow behavior index N Number of experiments P Pressure, Pa
r2 Correlation coefficient Re Reynolds number
Reg Generalized Reynolds number RMS Root mean square
ACKNOWLEDGMENTS
The authors wish to express their thanks to FAPESP for its financial support (Proc. 01/02038-8).
NOMENCLATURE
REFERENCES
v
Average flow velocity, m.s-1γ
Shear rate, s-1 Baneerje, T.K., Das, M. and Das, S.K., Non-Newtonian Liquid Flow Through Globe and Gate Valves. Canadian Journal of Chemical Engineering, 72, No. 4, 207 (1994).F
∑
Total friction loss, J.kg-1ρ Density, Kg.m-3
σ Shear stress, Pa Crane Co., Flow of Fluids Through Valves, Fittings and Pipe. Technical Paper No. 410M, 21st printing. Crane Co., 300 Park Ave., New York (1982).
η Viscosity, Pa.s
σ0 Yield stress, Pa
Darby, R., Chemical Engineering Fluid Mechanics, 2nd ed. Marcel Dekker Inc., New York (2001). Das, S.K., Biswas, M.N. and Mitra, A.K.,
Non-Newtonian Liquid Flow in Bends. Chemical Engineering Journal, 45, 165 (1991)
Dodge, D.W. and Metzner, A.B., Turbulent Flow of Non-Newtonian Systems. AIChE Journal, 5, 189 (1959). Edwards, M.F., Jadallah, M.S.M. and Smith, R.,
Head Losses in Pipe Fittings at Low Reynolds Numbers. Chemical Engineering Research & Design, 63, No. 1, 44 (1985).
Gabas, A.L., Menegalli, F.C., Ferrari, F. and Telis-Romero, J., Influence of Drying Conditions on the Rheological Properties of Prunes. Drying Technology, 20, 1485 (2002).
Garcia, E.J. and Steffe, J.F., Comparison of Friction Factor Equations for Non-Newtonian Fluids in Pipe Flow. Journal of Food Process Engineering, 9, 93 (1987).
Govier, G.W. and Aziz, K., The Flow of Complex Mixtures in Pipes. Van Nostrand Reinhold. New York (1972).
Griskey, R.G. and Green, R.G., Flow of Dilatant (Shear-Thickening) Fluids. AIChE Journal, 17, 725 (1971). Hooper, W.B., The Two-K Method Predicts.
Chemical Engineering, 24, 96 (1981).
Kittredge, C.P. and Rowley, D.S., Resistance Coefficients for Laminar and Turbulent Flow Through One-half-inch Valves and Fittings. Transactions of the American Society of Mechanical Engineers, 79, 1759 (1957).
Krieger, I.M. and Elrod, H., Direct Determination of the Flow Curves of Non-Newtonian Fluids. B. Shearing Rate in the Concentric Cylinder Viscometer. Journal of Applied Physics, 24, 134 (1953).
Martínez-Padilla, L.P. and Linares-García, J.A., Resistance Coefficients of Fittings for Power-law Fluids in Laminar Flow. Journal of Food Process Engineering, 24, 135 (2001).
Perry, R.H. and Chilton, C.H., Manual de Engenharia Química. 5a ed., Guanabara Dois, Rio de Janeiro (1986).
Steffe, J.F., Rheological Methods in Food Process Engineering. Freeman Press. East Lansing (1996).
Steffe, J.F., Mohamed, I.O. and Ford, E.W., Pressure Drop Across Valves and Fittings for Pseudoplastic Fluids in Laminar Flow. Transactions of the American Society of Agriculture Engineers, 27, 616 (1984).
Telis-Romero, J., Cabral, R.A.F., Kronka, G.Z. and Telis, V.R.N., Elevation of Boiling Point of Coffee Extract. Brazilian Journal of Chemical Engineering, 19, 119 (2002).
Telis-Romero, J., Cabral, R.A.F., Gabas, A.L. and Telis, V.R.N., Rheological Properties and Fluid Dynamics of Coffee Extract. Journal of Food Process Engineering, 24, 217 (2001).
Telis-Romero, J., Gratão, A.C., Garcia-Cruz, C.H. and Telis, V.R.N., Determinação de Coeficientes de Perda de Carga Através de Válvulas e Acessórios no Escoamento Laminar de Fluidos Não-Newtonianos. Ciência & Engenharia, 9, No. 1, 78 (2000).