ACPD
14, 1113–1158, 2014Dust aerosols and tropospheric
chemistry
R. Kumar et al.
Title Page
Abstract Introduction
Conclusions References
Tables Figures
◭ ◮
◭ ◮
Back Close
Full Screen / Esc
Printer-friendly Version Interactive Discussion
Discussion
P
a
per
|
D
iscussion
P
a
per
|
Discussion
P
a
per
|
Discuss
ion
P
a
per
|
Atmos. Chem. Phys. Discuss., 14, 1113–1158, 2014 www.atmos-chem-phys-discuss.net/14/1113/2014/ doi:10.5194/acpd-14-1113-2014
© Author(s) 2014. CC Attribution 3.0 License.
Atmospheric Chemistry and Physics
Open Access
Discussions
This discussion paper is/has been under review for the journal Atmospheric Chemistry and Physics (ACP). Please refer to the corresponding final paper in ACP if available.
E
ff
ects of dust aerosols on tropospheric
chemistry during a typical pre-monsoon
season dust storm in northern India
R. Kumar1,2, M. C. Barth2, S. Madronich2, M. Naja3, G. R. Carmichael4, G. G. Pfister2, C. Knote2, G. P. Brasseur1,5, N. Ojha3, and T. Sarangi3
1
Advanced Study Program, National Center for Atmospheric Research, Boulder, CO, USA
2
Atmospheric Chemistry Division, National Center for Atmospheric Research, Boulder, CO, USA
3
Aryabhatta Research Institute of Observational Sciences, Nainital, India
4
Center for Global and Regional Environmental Research, University of Iowa, Iowa City, IA, USA
5
Climate Service Center, Helmholtz Zentrum Geesthacht, Hamburg, Germany
Received: 25 October 2013 – Accepted: 24 December 2013 – Published: 14 January 2014
Correspondence to: R. Kumar (rkumar@ucar.edu)
ACPD
14, 1113–1158, 2014Dust aerosols and tropospheric
chemistry
R. Kumar et al.
Title Page
Abstract Introduction
Conclusions References
Tables Figures
◭ ◮
◭ ◮
Back Close
Full Screen / Esc
Printer-friendly Version Interactive Discussion
Discussion
P
a
per
|
D
iscussion
P
a
per
|
Discussion
P
a
per
|
Discuss
ion
P
a
per
|
Abstract
This study examines the effect of a typical pre-monsoon season dust storm on tro-pospheric chemistry through a case study in northern India. Dust can alter photolysis rates by scattering and absorbing solar radiation, and provide surface area for hetero-geneous reactions. We use the Weather Research and Forecasting model coupled with 5
Chemistry (WRF-Chem) to simulate the dust storm that occurred during 17–22 April 2010 and investigate the contribution of different processes on mixing ratios of several key trace gases including ozone, nitrogen oxides, hydrogen oxides, methanol, acetic acid and formaldehyde. We revised the Fast Troposphere Ultraviolet Visible (F-TUV) photolysis scheme to include effects of dust aerosols on photolysis rates in a manner 10
consistent with the calculations of aerosol optical properties for feedback to the me-teorology radiation schemes. In addition, we added twelve heterogeneous reactions on the dust surface, for which six reactions have relative humidity dependent reactive uptake coefficients (γ). The inclusion of these processes in WRF-Chem is found to re-duce difference between observed and modeled ozone from 16±9 to 2±8 ppbv and
15
that in NOy from 2129±1425 to 372±1225 pptv compared to measurements at the
high altitude site Nainital in the central Himalayas, and reduce biases by up to 30 % in tropospheric column NO2compared to OMI retrievals. The simulated dust storm acted as a sink for all the trace gases examined here and significantly perturbed their spatial and vertical distributions. The reductions in these gases are estimated as 5–100 % and 20
ACPD
14, 1113–1158, 2014Dust aerosols and tropospheric
chemistry
R. Kumar et al.
Title Page
Abstract Introduction
Conclusions References
Tables Figures
◭ ◮
◭ ◮
Back Close
Full Screen / Esc
Printer-friendly Version Interactive Discussion
Discussion
P
a
per
|
D
iscussion
P
a
per
|
Discussion
P
a
per
|
Discuss
ion
P
a
per
|
1 Introduction
Dust aerosols have gained considerable attention in the recent years not only because they constitute a major fraction of the particulate matter in the troposphere but also because they have important implications for air quality, visibility, the Earth’s radiation budget (e.g. Haywood and Boucher, 2000; Seinfeld et al., 2004), biogeochemistry (e.g. 5
Jickells et al., 2005), hydrological cycles (e.g. Miller et al., 2004; Zhao et al., 2011), and atmospheric chemistry (e.g. Dentener et al., 1996; Wang et al., 2012). The significance of dust aerosols for atmospheric chemistry has been manifested through several ex-perimental (e.g. Goodman et al., 2000; Underwood et al., 2001; Li et al., 2006; Preszler Prince et al., 2007; Wagner et al., 2008; Cwiertny et al., 2008; Pradhan et al., 2010; 10
Chen et al., 2011; Bedjanian et al., 2013a, b) and modeling studies (e.g. Zhang et al., 1994; Dentener et al., 1996; Zhang and Carmichael, 1999; Tang et al., 2004; Mar-tin et al., 2003; Bauer et al., 2004; Tie et al., 2005; Hodzic et al., 2006; Zhu et al., 2010; Wang et al., 2012) during the past two decades.
Dust aerosols can influence atmospheric chemistry by affecting the photolysis rate 15
coefficients through interaction with incoming solar radiation and by providing surface area for heterogeneous chemistry and deposition of different trace gases. It has been suggested that mineral dust aerosols are responsible for 5–20 % reduction in photol-ysis rate coefficients of ozone and NO2 throughout the Northern Hemisphere (e.g. Martin et al., 2003; Tie et al., 2005; Ying et al., 2011). These changes in photolysis rate 20
coefficients then decrease the annual mean global concentration of OH by 9 %, which in turn leads to increase in the concentrations of several volatile organic compounds (Martin et al., 2003). Heterogeneous reactions on dust surfaces generally reduce the concentration of key atmospheric trace gases such as ozone, nitrogen oxides, sulphur oxides and hydrogen oxides, but the amount of reported reduction in these gases varies 25
ACPD
14, 1113–1158, 2014Dust aerosols and tropospheric
chemistry
R. Kumar et al.
Title Page
Abstract Introduction
Conclusions References
Tables Figures
◭ ◮
◭ ◮
Back Close
Full Screen / Esc
Printer-friendly Version Interactive Discussion
Discussion
P
a
per
|
D
iscussion
P
a
per
|
Discussion
P
a
per
|
Discuss
ion
P
a
per
|
Tang et al., 2004; Bauer et al., 2004; Zhu et al., 2010; Wang et al., 2012). Likewise, the decreases for sulphur dioxide, nitrogen oxides and hydrogen oxides are reported as 10–50 %, 16–100 % and 11–59 % respectively.
Even though this study is focused on the impact of heterogeneous processes on dust surfaces on the tropospheric chemistry in northern India, it is worth mention-5
ing other implications of heterogeneous chemistry here. The heterogeneous uptake of trace gases can potentially affect the physiochemical properties of dust aerosols and enhance their ability to act as cloud condensation nuclei (CCN). Dust particles are generally hydrophobic when they are emitted but become hygroscopic as they travel in the atmosphere and become coated with nitrate, sulfate and organics (e.g. Levin et al., 10
1996; Kelly et al., 2007; Hatch et al., 2009). The coating process will also modify the distributions of dust as well as sulfate and nitrate aerosols, which in turn will increase the scattering of solar radiation by aerosols. The increase in size of dust particles due to coating will increase the probability of their removal from the atmosphere and such coated particles will experience less long range transport.
15
In general, box and regional modeling studies have focused mostly on heteroge-neous chemistry on East Asian and Saharan dust aerosols, whereas there have been no such studies over the northern Indian region where dust storms occur frequently during the pre-monsoon (March, April, May; MAM) season (e.g. Prasad and Singh, 2007; Hegde et al., 2007). Global modeling studies have suggested that heteroge-20
neous chemistry on dust aerosols can reduce surface ozone in northern India by 4– 10 % (e.g. Dentener et al., 1996; Bauer et al., 2004). However, there has been a consid-erable improvement in our understanding of heterogeneous chemistry on dust aerosols since these global modeling studies were conducted. For example, experimental stud-ies (e.g. Chen et al., 2011) have demonstrated that the uptake of gas-phase HNO3 25
ACPD
14, 1113–1158, 2014Dust aerosols and tropospheric
chemistry
R. Kumar et al.
Title Page
Abstract Introduction
Conclusions References
Tables Figures
◭ ◮
◭ ◮
Back Close
Full Screen / Esc
Printer-friendly Version Interactive Discussion
Discussion
P
a
per
|
D
iscussion
P
a
per
|
Discussion
P
a
per
|
Discuss
ion
P
a
per
|
shown in Eq. (1)
HNO3(g)+Dust NO−
3(a),hν
−−−−−−−→NOx(g) (1)
where (g) and (a) represent the species in gas and adsorbed phase respectively. The relative humidity (RH) dependence of the reactive uptake coefficient for several species 5
such as O3 (Cwiertny et al., 2008), HNO3 (Liu et al., 2008), OH (Bedjanian et al., 2013a), HO2 (Bedjanian et al., 2013b), SO2 (Preszler Prince et al., 2007) and H2O2 (Pradhan et al., 2010) has also been demonstrated. Therefore, it is essential to re-assess the importance of dust aerosols for tropospheric chemistry in northern India by taking into account these recent advancements.
10
In light of the above conditions, this manuscript examines the effects of dust aerosols on the distribution of many key trace gases including ozone, nitrogen oxides, hydrogen oxides, methanol, acetic acid and formaldehyde by incorporating the updated informa-tion on heterogeneous reactive uptake of trace gases in MOZCART chemical mech-anism of Weather Research and Forecasting model coupled with Chemistry (WRF-15
Chem). We also revised the Fast Troposphere Ultraviolet Visible (F-TUV) scheme to include effects of dust aerosols on photolysis rates. This extended configuration of WRF-Chem is then used to simulate the impact of a typical pre-monsoon season dust storm on the regional tropospheric chemistry in northern India. This dust storm oc-curred during 17–22 April 2010 in northern India and a detailed analysis including 20
evolution of this dust storm, dust emissions and its effects on local to regional scale aerosol optical properties and radiation budget are presented in a companion paper (Kumar et al., 2013).
The rest of the manuscript is organized as follows. Section 2 provides details of the WRF-Chem configuration used in this study along with the implementation of effect 25
ACPD
14, 1113–1158, 2014Dust aerosols and tropospheric
chemistry
R. Kumar et al.
Title Page
Abstract Introduction
Conclusions References
Tables Figures
◭ ◮
◭ ◮
Back Close
Full Screen / Esc
Printer-friendly Version Interactive Discussion
Discussion
P
a
per
|
D
iscussion
P
a
per
|
Discussion
P
a
per
|
Discuss
ion
P
a
per
|
2 The WRF-Chem Model
The version 3.4.1 of the Weather Research and Forecasting Model (Skamarock et al., 2008) coupled with Chemistry (Grell et al., 2005; Fast et al., 2006) is used here to simulate the distribution of trace species. The simulation domain is composed of 120×90×51 grid points in (x,y,z) direction with a horizontal resolution of 30 km×30 km
5
extending in the vertical up to 10 hPa. Gas-phase chemistry is represented by the Model for Ozone and Related chemical Tracers, version 4 (MOZART-4, Emmons et al., 2010), and aerosol processes by the GOCART bulk aerosol scheme (Chin et al., 2002; Pfister et al., 2011). The dust emission scheme in the model is based on Ginoux et al. (2001) and calculates size resolved dust emissions online in five size bins ranging 10
from 0.73–8.0 µm (effective radius) using the following equation:
Fp=
(
CSspu210 m(u10 m−ut) ifu10 m> ut
0 otherwise (2)
where Fp (kg m−2s−1) represents the emission flux for size bin p, C is an empirical proportionality constant (kg m−5s2),S is the source function representing the fraction
15
of alluvium available for wind erosion,sp is the fraction of each size class of dust in the emission,u10 m(m s−
1
) is the horizontal wind speed at 10 m above the surface and
ut is the threshold velocity (m s− 1
) below which dust emission does not occur and is a function of particle size, air density and surface moisture. The default value of C
was proposed initially as 1×10⁻⁹kg m−5s2 (Ginoux et al., 2001) but we have set it to
20
2.2×10⁻⁸kg m−5s2as the latter led to a good agreement between model and Aerosol
Robotic Network (AERONET) measured aerosol optical depth and Angström exponent at seven sites in the model domain (Kumar et al., 2013). The simulations started on 10 April 2010 at 00:00 GMT and ended on 25 April 2010 at 18:00 GMT. The first three days of the model output are removed from the analysis to allow the model to spin 25
ACPD
14, 1113–1158, 2014Dust aerosols and tropospheric
chemistry
R. Kumar et al.
Title Page
Abstract Introduction
Conclusions References
Tables Figures
◭ ◮
◭ ◮
Back Close
Full Screen / Esc
Printer-friendly Version Interactive Discussion
Discussion
P
a
per
|
D
iscussion
P
a
per
|
Discussion
P
a
per
|
Discuss
ion
P
a
per
|
simulated meteorological fields (Lo et al., 2008). Further details regarding selection of the value for C, the simulation domain, geographical datasets, anthropogenic, bio-genic, and biomass burning emissions, physical parameterizations, initial and lateral boundary conditions for meteorology and chemical fields, nudging coefficients and dif-ferent emission inventories used in the model set-up are described in detail by Kumar 5
et al. (2013).
2.1 Effect of aerosols on photolysis rates in WRF-Chem
In this study, we use the Fast-Troposphere Ultraviolet Visible (F-TUV) scheme to cal-culate photolysis rates for the MOZCART chemical mechanism. The F-TUV scheme is a simplified version of the National Center for Atmospheric Research’s (NCAR) TUV 10
model (Madronich and Weller, 1990) and was designed to reduce the computational costs associated with TUV (Tie et al., 2005). The F-TUV model utilizes the same phys-ical processes as the TUV model except that the number of wavelengths in the TUV spectra (121–750 nm) was reduced from 140 to 17, making it eight times faster than the TUV model. The differences in the calculated photolysis rate coefficients between 15
the TUV and F-TUV model are reported to be less than 5 % (Tie et al., 2005).
To include the effect of aerosols on photolysis rates, the F-TUV photolysis scheme in WRF-Chem calculates optical properties (optical depth, single scattering albedo and asymmetry parameter) for black carbon, organic carbon, sulphate and sea-salt aerosols, and passes them to a two-stream radiative transfer module where they in-20
teract with radiation to affect photolysis rate coefficients. These optical properties are also calculated in the aerosol optical driver of WRF-Chem and are used for feedback of aerosols on meteorology radiation schemes. Here, we make use of the optical driver calculated aerosol optical properties in F-TUV photolysis scheme to be consistent be-tween the effects of aerosols on radiation and photolysis rate coefficients. This coupling 25
ACPD
14, 1113–1158, 2014Dust aerosols and tropospheric
chemistry
R. Kumar et al.
Title Page
Abstract Introduction
Conclusions References
Tables Figures
◭ ◮
◭ ◮
Back Close
Full Screen / Esc
Printer-friendly Version Interactive Discussion
Discussion
P
a
per
|
D
iscussion
P
a
per
|
Discussion
P
a
per
|
Discuss
ion
P
a
per
|
2.2 Heterogeneous chemistry on dust surface in WRF-Chem
This study also extends the ability of the MOZCART chemical mechanism of WRF-Chem to simulate heterogeneous chemistry on the surface of dust particles by includ-ing 12 heterogeneous reactions listed in Table 1. The uptake of these gases on dust particles is assumed to be irreversible (Zhang and Carmichael, 1999). However, recent 5
laboratory experiments have shown that the uptake of HNO3(Chen et al., 2011) is as-sociated with release of gas phase NOx, and those of OH (Bedjanian et al., 2013a) and HO2(Bedjanian et al., 2013b) are associated with the release of gas-phase H2O2. The production of these gas phase species from heterogeneous chemistry is taken into account in this study. The production of NOx from HNO3 uptake is observed only 10
in the presence of broadband irradiation with a yield of about 50 % (Chen et al., 2011), and thus the reaction of HNO3 is set to yield 0.5 NO2 during daytime in this study. The yields for H2O2 from reactions of OH and HO2 with dust particles are reported to be 5 % (Bedjanian et al., 2013a) and 10 % (Bedjanian et al., 2013b) respectively and are set accordingly. These numbers differ from previous studies, which have assumed 15
a 100 % conversion of HO2and 0 % conversion of OH into H2O2(e.g. Zhu et al., 2010; Wang et al., 2012).
The pseudo first order reaction rate coefficient (s−1) for the loss of a gas phase speciesgdue to heterogeneous uptake by dust particles is calculated following Heikes and Thompson (1983) as:
20
kg=
X5
i=1
4πriDgV Ni
1+Kn[χ+4(1−γ)/3γ]
(3)
wherei =1, 5 represents five dust size bins used by the GOCART model, ri and Ni represents the effective radius (cm) and number density (particles cm−3) of particles in size bini,V is the ventilation coefficient and taken as unity,Dgrepresents the gas-25
ACPD
14, 1113–1158, 2014Dust aerosols and tropospheric
chemistry
R. Kumar et al.
Title Page
Abstract Introduction
Conclusions References
Tables Figures
◭ ◮
◭ ◮
Back Close
Full Screen / Esc
Printer-friendly Version Interactive Discussion
Discussion
P
a
per
|
D
iscussion
P
a
per
|
Discussion
P
a
per
|
Discuss
ion
P
a
per
|
following Jacobson (2005) as:
Dg= 5 16ρaAdg2
s
m
a+mg
mg
RT m
a
2π (4)
whereρais atmospheric mass density (g cm− 3
), A is the Avogadro’s number (6.022×
1023molecules mol−1),d
gis the collision diameter (cm) of gas moleculeg,Ris the uni-5
versal gas constant (8.31451×10⁷g cm2s−2mol−1K−1),T is the absolute temperature
(K), ma (g mol− 1
) and mg (g mol− 1
) are the molecular weights of air and gas respec-tively. In Eq. (5),Kn is the dimensionless Knudsen number defined as the ratio of the effective mean free path of a gas molecule in air (λ) to the effective particle radisri.χ
represents a correction factor for anisotropic movement and is calculated as follow: 10
χ= 4
3Kn+0.71
Kn+1
(5)
WRF-Chem model simulates the mass mixing ratio (Mi in g g−1) of dust particles, and the use of Eq. (5) requires the conversion of mass mixing ratios to the number concen-tration. This is performed using the following equation:
15
Ni=
Miρa
4 3πr
3 i
ρp
(6)
whereρp(g cm− 3
) represents mass density of the dust particles and are taken as 2.5 and 2.65 g cm−3to represent clay and silt in GOCART (Ginoux et al., 2001).
The reaction uptake coefficientγis the most important parameter in the calculation of 20
ACPD
14, 1113–1158, 2014Dust aerosols and tropospheric
chemistry
R. Kumar et al.
Title Page
Abstract Introduction
Conclusions References
Tables Figures
◭ ◮
◭ ◮
Back Close
Full Screen / Esc
Printer-friendly Version Interactive Discussion
Discussion
P
a
per
|
D
iscussion
P
a
per
|
Discussion
P
a
per
|
Discuss
ion
P
a
per
|
2000; Underwood et al., 2001; Michel et al., 2002). Such large uncertainties make the choice ofγ very difficul. Since this study is focusing on Thar Desert dust aerosols for which information on heterogeneous chemistry kinetics is not available we use the best guess values reported for East Asian dust aerosols (Zhu et al., 2010) here for theγ val-ues of dry dust particles except for OH and HO2. Theγvalues for OH and H2are taken 5
from Bedjanian et al. (2013a, b). The appliedγ values for dry dust particles are shown in Table 1 and vary from 2.1×10⁻⁶ for NO2to 0.18 for OH. Further information about available measurements ofγfor different species can be found in Zhu et al. (2010).
Many laboratory studies have also demonstrated the dependence of γ on relative humidity (RH), but such a RH dependence has generally been ignored in previous 10
modeling studies (e.g. Dentener et al., 1996; Zhu et al., 2010; Wang et al., 2012). In this study, we include the RH dependence of γ for ozone (Cwiertny et al., 2008), HNO3(Liu et al., 2008), OH (Bedjanian et al., 2013a), HO2(Bedjanian et al., 2013b), H2O2 (Pradhan et al., 2010), and SO2 (Preszler Prince et al., 2007). The variations ofγ with relative humidity for different trace gases are shown in Fig. 1. The value of 15
γ increases with RH for HNO3, SO2 and H2O2 while it decreases with RH for ozone, OH and HO2. The rate coefficients, i.e.,kg values are estimated to be of the order of 10−3–10−5s−1for OH, HO
2, H2O2, HNO3, NO3, N2O5and CH3COOH, and of the order of 10−7–10−8s−1for ozone, NO2, SO2, CH3OH and CH2O.
The aging of dust particles through heterogeneous uptake of acidic gases and or-20
ganic compounds is another important process that can influence the uptake of trace gases by dust particles. However, the dependence of kg on aging of mineral dust aerosols is complex and not well understood. For example, the reactive uptake of ozone (Usher et al., 2003) on HNO3and SO2processed dust particles is reported to increase or decrease depending on the chemical nature of the particle, coverage of the coat-25
con-ACPD
14, 1113–1158, 2014Dust aerosols and tropospheric
chemistry
R. Kumar et al.
Title Page
Abstract Introduction
Conclusions References
Tables Figures
◭ ◮
◭ ◮
Back Close
Full Screen / Esc
Printer-friendly Version Interactive Discussion
Discussion
P
a
per
|
D
iscussion
P
a
per
|
Discussion
P
a
per
|
Discuss
ion
P
a
per
|
ducted to highlight the importance of this aging process. The treatment of dust aging for those sensitivity simulations is presented below.
2.3 Atmospheric aging/processing of dust particles
Laboratory experiments have shown that reactive uptake of ozone decreases by about 70 % on dust particles processed with HNO3 (leading to nitrate coating) while it in-5
creases by about 33 % on dust particles processed with SO2 as ozone reacts with surface bound sulfites/bisulfites to form sulfate (Usher et al., 2003). We have made an attempt here to simulate these changes in dust reactivity and quantify their impact on surface ozone. The simulation of these changes requires partitioning of fresh and aged dust particles and is done using the following procedure: in addition to total dust, two 10
artificial dust tracers called “fresh_dust” and “aged_dust” are introduced into the model to keep track of fresh and aged dust particles. These tracers are included for all five size bins and thus we have a total of 10 tracers in the model. All these tracers undergo same transport and deposition processes as the original dust tracers.
The emission of fresh dust particles are set equal to the emission of total dust while 15
the emissions of aged dust particles are set to zero. The initial and boundary condi-tions for fresh dust particles are set equal to those for total dust while those for aged dust particles are set to zero because the MOZART-4 output used for providing initial and boundary conditions does not include such a classification. The assumption that all dust particles entering into the model domain are fresh may introduce some uncer-20
tainty in the model results. However, such an uncertainty is anticipated to have a small contribution in the case presented here, as two model runs with and without includ-ing the regional dust emissions showed that most of the dust loadinclud-ing over the model domain came from emissions within the model domain during 17–22 April 2010.
The number concentration (particles cm−3) of aged (Na,i,i =1, 5 represent five size 25
bins) and fresh (Nf,i) dust particles is updated every time step as follows for each gas
sur-ACPD
14, 1113–1158, 2014Dust aerosols and tropospheric
chemistry
R. Kumar et al.
Title Page
Abstract Introduction
Conclusions References
Tables Figures
◭ ◮
◭ ◮
Back Close
Full Screen / Esc
Printer-friendly Version Interactive Discussion
Discussion
P
a
per
|
D
iscussion
P
a
per
|
Discussion
P
a
per
|
Discuss
ion
P
a
per
|
face area of the dust particle to the surface area occupied by a gas molecule. Second, the total number of gas molecules of g that can potentially adsorb to dust particles (npot, g,i) is calculated by multiplyingkg (s−
1
) estimated in Eq. (5) with gas concentra-tion (molecules cm−3) and time step (180 s in this case). The rationpot, g,i/nml, g,i then provides the number concentration increment ∆a, g,i of dust particles that could have 5
aged (i. e. been completely coated with a monolayer of g) during this time step (180 s here). The sum of the increments∆a, g,idue to all gases considered in coating gives the total increment in aged particles∆a,i.∆a,i is then subtracted from the number concen-tration of fresh dust particlesNf,i and added accordingly to the number concentration of aged particlesNa,i.
10
The reactions of HNO3, NO2, NO3and N2O5with dust particles are assumed to coat dust particles with nitrate and that of SO2 is assumed to coat them with sulfate. All gases are given equal probability to react with dust particles, and in case the number concentration of fresh dust particles is limiting, then ∆a,i > Nf,i, which would lead to negative number concentrations ofNf,i. To overcome this problem,Na,iandNf,iare set 15
toNf,iand zero respectively. This approach leads to mass conservation of tracers, and the sum of fresh and aged dust particle concentrations is always equal to the total dust number concentration. Both fresh and coated dust particle then react separately with trace gases.
2.4 Simulations conducted
20
A total of nine simulations were conducted (Table 2) to examine the impact of the dust storm on tropospheric chemistry. No_Dust serves as a base simulation in which het-erogeneous chemistry on dust surface and effect of dust on photolysis rates are not included. Dust_J simulation includes the effect of dust aerosols on photolysis rates, while Dust_JH simulation is same as Dust_J but with addition of heterogeneous chem-25
in-ACPD
14, 1113–1158, 2014Dust aerosols and tropospheric
chemistry
R. Kumar et al.
Title Page
Abstract Introduction
Conclusions References
Tables Figures
◭ ◮
◭ ◮
Back Close
Full Screen / Esc
Printer-friendly Version Interactive Discussion
Discussion
P
a
per
|
D
iscussion
P
a
per
|
Discussion
P
a
per
|
Discuss
ion
P
a
per
|
clude RH dependence of γ. In Dust_JH_NoReNOx, the release of gas-phase NO2 associated with uptake of HNO3is not considered to assess the importance of renoxifi-cation process. Dust_JH_NO3and Dust_JH_SO4simulations are designed to examine the influences of dust coated with nitrate and sulfate separately on uptake of ozone. In these simulations, the uptake coefficientγ for aged dust particles is reduced by 70 5
Dust_JH_NO3 and is increased by 33 % in Dust_JH_SO4 (Usher et al., 2003). Dust particles are coated with both sulfate and nitrate in Dust_JH_NO3_SO4to examine the combined effect of nitrate and sulfate coating on ozone uptake. Dust_JH_Sat is a hypo-thetical simulation where we assume that the presence of nitrate or sulfate monolayer on dust particle would saturate the dust particles and deactivate them for further cat-10
alytic uptake of O3, OH, HO2, H2O2, CH3COOH, CH3OH and HCHO, but the coating is assumed to have no effect on the uptake of HNO3, NO2, NO3, N2O5 and SO2. This comparison of Dust_JH_Sat with Dust_JH and Dust_J would provide bounds of the heterogeneous chemistry induced changes in tropospheric chemistry.
3 Observation datasets
15
3.1 Surface observations
This study uses surface ozone and NOy (sum of nitrogen oxides) observations made at the high altitude site Nainital (79.45◦E, 29.36◦N, 1958 m a.m.s.l.) located in the cen-tral Himalayas. The observation site is bounded by high altitude (2–5 km) mountains in the north and east directions and opens to the Indo-Gangetic Plain region in the 20
south and west directions. There are no major anthropogenic sources near Nainital and thus the observations at this site are envisaged to be representative of north-ern India (Kumar et al., 2010). Further details regarding the orography, vegetation cover, meteorological and chemical characteristics of Nainital can be found elsewhere (e.g. Sagar et al., 2004; Pant et al., 2006; Kumar et al., 2010; Sarangi et al., 2014). 25
instru-ACPD
14, 1113–1158, 2014Dust aerosols and tropospheric
chemistry
R. Kumar et al.
Title Page
Abstract Introduction
Conclusions References
Tables Figures
◭ ◮
◭ ◮
Back Close
Full Screen / Esc
Printer-friendly Version Interactive Discussion
Discussion
P
a
per
|
D
iscussion
P
a
per
|
Discussion
P
a
per
|
Discuss
ion
P
a
per
|
ment, and NOymeasurements are made with a chemiluminescence-based instrument. More details about the measurement set-up, operating principle, accuracy, detection limits and calibration procedure are discussed elsewhere (e.g. Kumar et al., 2010; Sarangi et al., 2014). The model results are also compared with Aerosol Robotic Net-work (AERONET) measurements at seven sites in the model domain. Further details 5
of AERONET and these observations sites can be found in Kumar et al. (2013).
3.2 Ozone Monitoring Instrument (OMI)
The Ozone Monitoring Instrument (OMI), aboard NASA’s Earth Observing System (EOS) Aura satellite, measures the radiation backscattered by the Earth’s atmosphere and surface over the 0.27–0.5 µm wavelength range with a spatial resolution of about 10
13 km×24 km at nadir in normal operational mode. These measured radiances are
used for daily global retrievals of several trace species, such as ozone, NO2, BrO, SO2, formaldehyde and aerosols. Here, we use Level-2 tropospheric column NO2datasets made available by KNMI (Royal Netherlands Meteorological Institute) as they provide access to the averaging kernel and a priori profiles, which are needed to make a proper 15
comparison between model profiles and satellite retrievals (e.g. Emmons et al., 2004). More details on the algorithm used to retrieve the tropospheric column NO2 abun-dances at KNMI are described by Bucsela et al. (2006). These OMI NO2retrievals were found to correlate well with aircraft measurements made during the INTEX-B campaign (Boersma et al., 2008) and MAX-DOAS ground-based measurements (Kramer et al., 20
2008) but are also suggested to be biased positively by about 0–30 %, irrespective of season (e.g. Boersma et al., 2009a; Zhou et al., 2009).
To compare WRF-Chem results with OMI, the best quality OMI retrievals are used by reducing influence of clouds on OMI retrievals through selection of pixels with cloud fraction less than 0.3 and removing unreliable retrievals associated with a tropospheric 25
trans-ACPD
14, 1113–1158, 2014Dust aerosols and tropospheric
chemistry
R. Kumar et al.
Title Page
Abstract Introduction
Conclusions References
Tables Figures
◭ ◮
◭ ◮
Back Close
Full Screen / Esc
Printer-friendly Version Interactive Discussion
Discussion
P
a
per
|
D
iscussion
P
a
per
|
Discussion
P
a
per
|
Discuss
ion
P
a
per
|
formed using the averaging kernel and a priori profiles used in the satellite retrievals to obtain a model profile that OMI would measure for the modeled state of the atmo-sphere in the absence of other errors. More details about the method of model-OMI data co-location and convolution of model profiles with averaging kernel and a priori files can be found in Kumar et al. (2012).
5
4 Results and discussion
4.1 Model Evaluation
Kumar et al. (2013) present a detailed evaluation of simulated aerosol optical proper-ties and here, we present a summary. The simulated aerosol optical depth (AOD), Angström exponent and single scattering albedo are compared against Aerosol 10
Robotic Network (AERONET) measurements at seven sites in the model domain. It is found that the model generally underestimates the AOD over the model domain but is able to capture the temporal variations (r=0.5–0.88) seen in AERONET measure-ments. The good agreement between modeled and AERONET observed Angström exponent indicates that the model is able to capture dust storm-induced variations in 15
aerosol size. The comparison of model results with Moderate Resolution Imaging Spec-troradiometer (MODIS) AOD retrievals shows that the model is also able to capture the spatial pattern of dust storm induced changes in the MODIS AOD as well as the spatial pattern of the dust plume. The average MODIS and WRF-Chem AOD (550 nm) values in high dust laden region are estimated as 0.80±0.30 and 0.68±0.28 respectively.
20
The variations in observed and WRF-Chem simulated (No_Dust, Dust_J, Dust_JH_NoRH and DUST_JH) daily average ozone and NOyat Nainital during 13–24 April 2010 are shown in Fig. 2. The modeled time series of relative humidity and dust mass concentration for particles of 0.73, 1.4 and 8.0 µm effective radii at Nainital are also shown. Note that the WRF-Chem model at the resolution (30 km×30 km) used
25
alti-ACPD
14, 1113–1158, 2014Dust aerosols and tropospheric
chemistry
R. Kumar et al.
Title Page
Abstract Introduction
Conclusions References
Tables Figures
◭ ◮
◭ ◮
Back Close
Full Screen / Esc
Printer-friendly Version Interactive Discussion
Discussion
P
a
per
|
D
iscussion
P
a
per
|
Discussion
P
a
per
|
Discuss
ion
P
a
per
|
tude of the site in the model is offby about 900 m. To minimize the comparison errors induced by this spatial mismatch, we first obtain the altitude profile of model results at Nainital by bi-linearly interpolating model output at each model level to the location of Nainital (79.45◦E, 29.36◦N) and then linearly interpolate the resulting altitude pro-file to the height of Nainital (1958 m). Dust mass concentrations started increasing at 5
Nainital on 17 April 2010, reached maximum during 20–22 April and decreased there-after. The mass concentrations of 8.0 µm particles remain close to zero even during the dust storm because these particles cannot go far from the source regions due to their shorter life-times.
The observed ozone show a decrease during the dust storm period (17–22 10
April 2010) while observed NOy show an increase during 17–18 April 2010 and a de-crease thereafter. However, the WRF-Chem model without incorporating the effects of dust aerosols (No_Dust) does not capture this observed decrease in ozone and NOy levels at Nainital. Including effects of dust on photolysis rates (Dust_J) induces a slight decrease (about 2 ppbv) in modeled ozone levels, but modeled values are still 15
significantly higher than the observations. The introduction of heterogeneous chem-istry without including RH dependence ofγ(Dust_JH_NoRH) in the model leads to the observed decreases in ozone and NOy, but compared to measurements we find too strong of decreases in ozone levels and slightly higher NOy levels than the observa-tions at Nainital during the peak of dust storm, i.e. 20–22 April 2010. The inclusion of 20
heterogeneous chemistry with RH dependence ofγ(Dust_JH) leads to the best agree-ment between WRF-Chem simulated and observed ozone and NOyvalues at Nainital. The WRF-Chem simulated average ozone values at Nainital in Dust_JH and No_Dust configurations during 17–22 April 2010 are estimated to be 58±5 ppbv and 73±6 ppbv
respectively as compared to the average observed value of 56±10 ppbv. The
corre-25
sponding WRF-Chem NOyaverage values at Nainital are estimated as 1189±751 pptv
and 2945±876 pptv, respectively, as compared to the average observed value of
ACPD
14, 1113–1158, 2014Dust aerosols and tropospheric
chemistry
R. Kumar et al.
Title Page
Abstract Introduction
Conclusions References
Tables Figures
◭ ◮
◭ ◮
Back Close
Full Screen / Esc
Printer-friendly Version Interactive Discussion
Discussion
P
a
per
|
D
iscussion
P
a
per
|
Discussion
P
a
per
|
Discuss
ion
P
a
per
|
the difference between average modeled and observed ozone from 16±9 to 2±8 ppbv
and that in NOyfrom 2102±1425 to 346±1225 pptv respectively.
The spatial distributions of average OMI retrieved and WRF-Chem (Dust_JH and No_Dust) simulated tropospheric column NO2 during 13–16 April 2010 and 17–22 April 2010 are shown in Fig. 3. WRF-Chem profiles are convolved with OMI averag-5
ing kernels before comparison. The periods of 13–16 April 2010 and 17–22 April 2010 represent the periods of low and high dust emissions respectively over the model domain. The percentage differences in tropospheric column NO2 between high and low dust emission periods are also shown for both OMI and WRF-Chem. Both the model and satellite data show similar spatial distributions with highest values along 10
the Indo-Gangetic Plain region during both low and high dust emission periods, but WRF-Chem generally overestimates the OMI retrievals which is consistent with pre-vious studies over the Indian region (Kumar et al., 2012; Ghude et al., 2013). How-ever, the comparison between Dust_JH and No_Dust configurations of WRF-Chem shows that the inclusion of effects of dust aerosols improves the model performance 15
and reduces the model bias with respect to OMI retrievals by up to 30 % especially in the Indo-Gangetic Plain region. The remaining bias in the model could be due to uncertainties in NOxemission estimates in this region. The percentage difference plots show that WRF-Chem model is able to capture several features of changes in OMI retrieved spatial distribution of tropospheric column NO2 between high and low dust 20
emission periods. The domain averaged OMI and WRF-Chem (Dust_JH) tropospheric column NO2 values over the geographical region (70–80◦E, 25–30◦E) of maximum dust storm impact during low dust emission period are estimated as (2.35±1.43)×1015
and (3.95±2.43)×1015molecules cm−2respectively, and during high dust emission
pe-riod are estimated as (2.01±1.37)×1015 and (3.41±2.80)×1015molecules cm−2
re-25
ACPD
14, 1113–1158, 2014Dust aerosols and tropospheric
chemistry
R. Kumar et al.
Title Page
Abstract Introduction
Conclusions References
Tables Figures
◭ ◮
◭ ◮
Back Close
Full Screen / Esc
Printer-friendly Version Interactive Discussion
Discussion
P
a
per
|
D
iscussion
P
a
per
|
Discussion
P
a
per
|
Discuss
ion
P
a
per
|
4.2 Impact of dust storm on photolysis rate coefficients
The impact of the dust storm on photolysis rates is examined by comparing the day-time (07:30–17:30 IST or 02:00–12:00 UTC) NO2photolysis rate coefficients calculated by the WRF-Chem model with Dust_J and No_Dust configurations (Fig. 4). The per-centage difference between Dust_J and No_Dust configurations are also shown. NO2 5
photolysis rates at the surface show a strong relationship with aerosol loading and are lowest over the Indo-Gangetic Plain region, which is where the anthropogenic emis-sions are stronger than those over other parts of the model domain. The inclusion of dust aerosols enhances the spatial heterogeneity of NO2photolysis rate and decreases it by 5–25 % over the Thar Desert and western Indo-Gangetic Plain region. The pho-10
tolysis rate coefficients of other trace gases such as ozone, HNO3, H2O2, CH2O and N2O5 at the surface exhibit similar features (not shown) with decreases of the same order of magnitude. The magnitude of change in photolysis rates decreases with al-titude and changes sign from negative to positive near 4 km because of the increase in actinic flux due to scattering of incoming solar radiation by dust aerosol layers un-15
derneath. The spatial structure of changes in photolysis rates at 100 hPa is similar to that at the surface with largest increases (1–5 %) over the Thar Desert and western Indo-Gangetic Plain region.
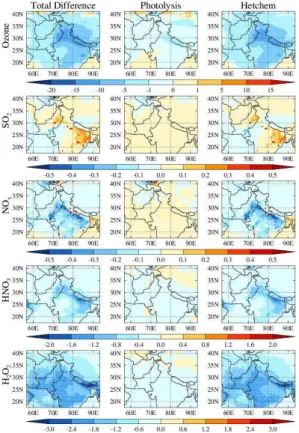
4.3 Impact of dust storm on trace gases at the surface
The spatial distributions of average surface ozone, SO2, NOx, HNO3and H2O2 simu-20
lated by WRF-Chem in Dust_JH and No_Dust during 17–22 April 2010 are compared in Fig. 5. Also shown are absolute total differences (Dust_JH - No_Dust) calculated using the Dust_JH simulation because this run led to the best agreement between model and observations at Nainital. Surface ozone shows a similar spatial distribution in both runs with lowest values over the Arabian Sea and highest values over the east-25
Indo-ACPD
14, 1113–1158, 2014Dust aerosols and tropospheric
chemistry
R. Kumar et al.
Title Page
Abstract Introduction
Conclusions References
Tables Figures
◭ ◮
◭ ◮
Back Close
Full Screen / Esc
Printer-friendly Version Interactive Discussion
Discussion
P
a
per
|
D
iscussion
P
a
per
|
Discussion
P
a
per
|
Discuss
ion
P
a
per
|
Gangetic Plain region. The spatial distribution of reductions in ozone mixing ratios is consistent with the distribution of dust over the model domain and the amount of reduc-tion is comparable to those reported by previous studies in dust source regions (e.g. Dentener et al., 1996; Tang et al., 2004; Pozzoli et al., 2008; Wang et al., 2012).
SO2 and NOx mixing ratios are highest along the Indo-Gangetic Plain region due 5
to higher emissions in this region. Changes in SO2 mixing ratios show a mixed re-sponse to heterogeneous chemistry with a decrease of 0.1–0.2 ppbv (8–10 %) over the Thar Desert region and an increase of 0.2–0.5 ppbv (2–6 %) over the eastern Indo-Gangetic Plain region. This is because the heterogeneous chemistry reduces SO2 through reaction with dust particles while increases it through reduction of OH mixing 10
ratios (SO2+OH→Sulfate). The sign of the changes in SO2 is thus determined by competition between these two reactions. In general, NOxmixing ratios show a reduc-tion of up to 0.5 ppbv (<10 %) along the Indo-Gangetic Plain region and 0.2–0.3 ppbv (10–20 %) over the Thar Desert due to uptake of NO2by dust particles. The changes in NO2are also determined by the competition between the reactions of NO2with dust 15
and OH where the former tends to decrease NO2 while the latter tends to increase NO2 due to reduced OH. The reduction in NOx is in contrast with the results of Wang et al. (2012) who reported an increase in NOx in the dust source region and attributed the increase to the renoxification process. Our study differs because Wang et al. (2012) assumed that renoxification process is active all the time, whereas this process is ac-20
tive only during daytime in our simulations. To quantify the contribution of renoxifica-tion process in NOxbudget, we compared the NOxdistributions simulated by Dust_JH and Dust_JH_NoReNOx configurations. The comparison (not shown) showed that the renoxification process does increase NOx mixing ratios, but the magnitude of this in-crease (0.1–0.2 ppbv) is less likely than the reduction due to heterogeneous chemistry. 25
The spatial distributions of HNO3 and H2O2 are largely modified by the dust storm with reduction of up to 2 ppbv (∼99 %). This is because these species are highly
in-ACPD
14, 1113–1158, 2014Dust aerosols and tropospheric
chemistry
R. Kumar et al.
Title Page
Abstract Introduction
Conclusions References
Tables Figures
◭ ◮
◭ ◮
Back Close
Full Screen / Esc
Printer-friendly Version Interactive Discussion
Discussion
P
a
per
|
D
iscussion
P
a
per
|
Discussion
P
a
per
|
Discuss
ion
P
a
per
|
crease in H2O2. Wang et al. (2012) assumed a 100 % yield for the conversion of HO2 into H2O2 through heterogeneous uptake, while we assume a yield of 10 % following recent work by Bedjanian et al. (2013b). NO3, N2O5 and CH3COOH also show large reductions by Dust_JH with the highest decrease reaching up to 0.1 ppbv (∼98 %),
0.46 ppbv (∼99 %) and 0.45 ppbv (∼96 %) respectively. The uptake of HO2 by dust 5
particles leads to a maximum reduction of about 3.5 pptv (∼40 %) over the Thar Desert
region, which is much less than those reported previously (e.g. Bian and Zender, 2003; Wang et al., 2012) and is attributed to use of a lowerγ value in our study (<0.064 vs. 0.1). The maximum reduction in OH, CH2O and CH3OH is estimated to be about 40 %, 21 % and 5 %, respectively.
10
The above discussion focuses only on the role of heterogeneous chemistry in chang-ing the distribution of trace gases; however, these changes also include contributions from perturbations in photolysis rate coefficients. The individual contributions of het-erogeneous chemistry and perturbation in photolysis rate coefficients to the total dif-ference in distributions of trace gases at the surface are shown in Fig. 6. More than 15
80 % of the changes in distribution of these trace gases are explained by the hetero-geneous chemistry. The changes in surface ozone induced by changed photolysis rate coefficients are within ±1–3 ppbv and are driven by the complex response of ozone
to decreases in photolysis rate coefficients. A decrease in the photolysis rate coeffi -cients leads to slower photochemical processing in general and thus decreased ozone 20
production.
SO2 and NOx mixing ratios at the surface show an increase of up to 0.1 ppbv due to reduction in photolysis rate coefficients. The increase in NOx and SO2is associated with a decrease in OH mixing ratios as reaction with OH is the main loss process for both NOx and SO2. The decrease in ozone photolysis rate coefficient leads to a de-25
ACPD
14, 1113–1158, 2014Dust aerosols and tropospheric
chemistry
R. Kumar et al.
Title Page
Abstract Introduction
Conclusions References
Tables Figures
◭ ◮
◭ ◮
Back Close
Full Screen / Esc
Printer-friendly Version Interactive Discussion
Discussion
P
a
per
|
D
iscussion
P
a
per
|
Discussion
P
a
per
|
Discuss
ion
P
a
per
|
but the rate of change of HNO3 is dominated by changes in OH as the reduction in OH (up to 30 %) is larger than that in NO2 (up to 5 %). The reduction in H2O2 is also associated with reduction in OH and HO2mixing ratios. Since OH is the major oxidizing agent in the troposphere, a decrease in OH also leads to a decrease in the oxidizing capacity of the atmosphere and a consequent increase of up to 5–10 % in several trace 5
gases such as CO, alkanes and alkenes at the surface.
4.4 Impact of dust storm on vertical distribution of trace gases
The vertical profiles of percentage total differences (Dust_JH – No_Dust) in average ozone, NOx, HNO3, OH and BIGALK over the geographical region (70–80◦E, 25–30◦N) of maximum dust influence are shown in Fig. 7, including the differences only due to 10
heterogeneous chemistry (Dust_JH – Dust_J) and dust influence on photolysis rates (Dust_J – No_Dust). BIGALK represents alkanes with four or more carbon atoms in the MOZCART chemical mechanism and is shown to illustrate the dust storm induced changes in volatile organic compounds. The vertical distributions of average mass con-centration for dust particles of 1.4 µm effective radius and relative humidity are also 15
shown to help the interpretation.
The changes in all the trace gases due to heterogeneous chemistry are much larger than those due to perturbations in photolysis rate coefficients, and are significant be-low 8 km, which is consistent with the vertical distribution of dust particles. All gases except BIGALK show a net reduction because of the larger changes induced by the 20
heterogeneous chemistry. The reduction in OH due to decrease in ozone photolysis rate coefficient leads to a small increase of 1–4 % in NOx. The reaction with OH is the only loss process for BIGALK and therefore BIGALK shows an increase due to both heterogeneous chemistry and perturbation in photolysis rates as both of these pro-cesses leads to a decrease in OH. The highest net decrease in ozone, NOx, HNO3 25
and OH are estimated as∼16 %, ∼26 %, ∼91 % and ∼30 % respectively while the
ACPD
14, 1113–1158, 2014Dust aerosols and tropospheric
chemistry
R. Kumar et al.
Title Page
Abstract Introduction
Conclusions References
Tables Figures
◭ ◮
◭ ◮
Back Close
Full Screen / Esc
Printer-friendly Version Interactive Discussion
Discussion
P
a
per
|
D
iscussion
P
a
per
|
Discussion
P
a
per
|
Discuss
ion
P
a
per
|
changes in NO3, N2O5, H2O2and CH3COOH are similar to those in HNO3and highest net reduction reaches 80–90 %.
4.5 Importance of RH dependence of reactive uptake coefficients (γ)
The uptake of trace gases by dust aerosols also depends upon the relative humidity as reactive uptake coefficients have a large variation with RH. The effect of relative humid-5
ity on the rate constantskO3 and kHNO3 at the surface over the model domain during 17–22 April 2010 is illustrated in Fig. 8, where model runs with and without RH depen-dence ofγ are compared. The spatial distributions of average mass concentration for dust particles of 1.4 µm effective radius and relative humidity are also shown to help the interpretation. RH is less than 20 % over most of the Indian region and is 40–60 % over 10
the oceanic regions. As expected, the spatial distributions of bothkO3andkHNO3in both configurations are nearly identical to the distribution of dust mass concentrations with highest values in the dust source regions. The rate constant decreases for ozone while increases for HNO3by one-two orders of magnitude after inclusion of RH dependence ofγ. The rate coefficients for other gases show a similar spatial distribution.
15
The effect of RH induced changes in the rate constants on heterogeneous uptake of ozone, SO2, HNO3, H2O2, OH and HO2 is illustrated by showing the relative percent-age differences in the distribution of these gases in the lowest model layer between the model runs with and without RH dependence ofγ (Fig. 9). Surface ozone and HO2 show an increase when RH effects onγ are included becauseγ for these gases de-20
crease with RH. In contrast, HNO3 and H2O2 uptake coefficients increase when RH effects are accounted for, resulting in a decrease in HNO3and H2O2mixing ratios. The changes in ozone, HO2and H2O2reach up to 20 %, 25 % and 50 %, respectively, over the Thar Desert and the western Indo-Gangetic Plain region. The percentage changes in HNO3 reach up to 100 over the oceanic regions (RH>45 order of magnitude in-25
de-ACPD
14, 1113–1158, 2014Dust aerosols and tropospheric
chemistry
R. Kumar et al.
Title Page
Abstract Introduction
Conclusions References
Tables Figures
◭ ◮
◭ ◮
Back Close
Full Screen / Esc
Printer-friendly Version Interactive Discussion
Discussion
P
a
per
|
D
iscussion
P
a
per
|
Discussion
P
a
per
|
Discuss
ion
P
a
per
|
termined by competition between the reactions of SO2 with dust particles and OH. The reaction of SO2 tries to reduce SO2 due to increase inγ with RH while that with OH would decrease (increase) SO2 if OH increases (decreases). The magnitudes of these RH induced changes in trace gases are comparable to those induced by het-erogeneous chemistry (reported in Sect. 4.3). This suggests that consideration of RH 5
dependentγ values in heterogeneous chemistry calculation is as important as is the accurate simulation of dust mass concentrations.
5 Impact of dust aging
The aging of dust particles through heterogeneous uptake of gases can modify the dust reactivity towards trace gases. We have made an attempt to simulate changes in 10
the dust reactivity and uptake of trace gases due to nitrate and sulfate coating and the results are presented in this section. The spatial distributions of WRF-Chem simulated average mass concentration of fresh and aged dust particles of 1.4 µm effective radius at the surface in Dust_JH_N3, Dust_JH_SO4 and Dust_JH_NO3_SO4 configurations during 17–22 April 2010 are shown in Fig. 10. The absolute changes in average sur-15
face ozone in these configurations relative to Dust_JH configuration are also shown. In general, fresh dust particles are seen mostly in and near the source regions because all dust particles are emitted as fresh and have much smaller concentration than the aged dust particles particularly outside the dust source regions. Among all the gases providing nitrate coating on dust particles, the HNO3uptake makes the highest contri-20
bution to the concentration of aged particles due to its higher mixing ratios and strong increase in its reactivity towards the dust surface with relative humidity. For example, if there are 10 fresh dust particles cm−3
of effective radius 0.73 µm, then the uptake of HNO3, NO2, NO3 and N2O5 leads to about 2.5 aged dust particles cm−
3
in one time step (180 s) at RH=0, and HNO3 and NO3 each provide about 1 dust particle. 25
up-ACPD
14, 1113–1158, 2014Dust aerosols and tropospheric
chemistry
R. Kumar et al.
Title Page
Abstract Introduction
Conclusions References
Tables Figures
◭ ◮
◭ ◮
Back Close
Full Screen / Esc
Printer-friendly Version Interactive Discussion
Discussion
P
a
per
|
D
iscussion
P
a
per
|
Discussion
P
a
per
|
Discuss
ion
P
a
per
|
take of SO2 also increases with increase in relative humidity, but the SO2 contribution to the aged particles is much less than that of HNO3 due to lower SO2 γ value. The decrease in ozoneγ values for nitrate coated dust particles leads to an enhancement of 1–2 ppbv in surface ozone over the Thar Desert and western Indo-Gangetic Plain region relative to uncoated dust particles while increase in ozoneγ values for sulfate 5
coated dust particles leads to a reduction of 0.5–1 ppbv over these regions. Since ni-trate coating leads to larger fraction of aged particles than the sulfate coating, surface ozone mixing ratios show an overall enhancement of up to 1 ppbv over the regions of high dust loadings when both sulfate and nitrate coated dust particles are allowed to react with ozone in the model.
10
The spatial distributions of lower and upper bounds for heterogeneous chemistry reaction rates induced changes in surface ozone, H2O2, HCHO and CH3COOH are shown in Fig. 11. Absolute mixing ratios of these gases in Dust_J configuration, in which dust aerosols affected photolysis rates only, are also shown to provide an idea of the modification in base levels of these gases due to heterogeneous chemistry. Lower 15
and upper bounds for each gas are calculated by subtracting their average values in Dust_J configuration from those in Dust_JH and Dust_JH_Sat configurations respec-tively. As expected, the saturation of dust particles decreases the magnitude of reduc-tion caused by heterogeneous chemistry for all the gases by 5–50 %. The amount of maximum reduction in surface ozone changed from 20–25 % to 15–20 % when satura-20
tion effects are accounted for. The saturation of dust particles has a larger impact on the distribution of H2O2and CH3COOH as maximum reduction in both of these gases decreased to 20–40 % (as compared to 70–90 % for unsaturated dust particles) over the Thar Desert and dust source regions. Both of these gases show a small increase of 0.1–0.2 ppbv (less than 10 %) outside the source regions for the case of saturated 25
ACPD
14, 1113–1158, 2014Dust aerosols and tropospheric
chemistry
R. Kumar et al.
Title Page
Abstract Introduction
Conclusions References
Tables Figures
◭ ◮
◭ ◮
Back Close
Full Screen / Esc
Printer-friendly Version Interactive Discussion
Discussion
P
a
per
|
D
iscussion
P
a
per
|
Discussion
P
a
per
|
Discuss
ion
P
a
per
|
6 Summary
The effects of a typical pre-monsoon season dust storm on tropospheric chemistry are analyzed for a case study in northern India. To examine the effects of dust storm, the Weather Research and Forecasting model coupled with Chemistry (WRF-Chem) is fur-ther developed to enhance its ability to simulate tropospheric chemistry in the presence 5
of dust particles and it is used to investigate the contribution of different processes on mixing ratios of several key trace gases including ozone, nitrogen oxides, hydrogen oxides, methanol, acetic acid and formaldehyde. The changes made to the model are specific to the MOZCART setup. Two major updates are included in this study: firstly, the F-TUV photolysis scheme of the model is updated to include the effect of dust 10
aerosols on photolysis rates and to achieve consistency between the methods through which aerosols affect the meteorology and photolysis rates in the model. Secondly, a new scheme consisting of twelve heterogeneous reactions is included to simulate heterogeneous chemistry on the surface of dust particles. The RH dependence ofγ, which was generally ignored in previous studies, is used for six of the heterogeneous 15
reactions.
The extended configuration of WRF-Chem is applied to a typical pre-monsoon sea-son dust storm that occurred in northern India during 17–22 April 2010. The model re-produced the spatial and temporal distribution of dust plumes and aerosol optical prop-erties (Kumar et al., 2013). The simulations are evaluated against surface ozone and 20
NOy observations at a high altitude (1958 m) measurement station in the Himalayan region (Nainital), and the model is found to capture the observed decrease in ozone and NOy during the dust storm only after the inclusion of the effects of dust on photol-ysis rates and heterogeneous chemistry. Average observed and modeled ozone val-ues at Nainital during 17–22 April 2010 are estimated to be 56±10 and 58±5 ppbv
25
respectively, and the corresponding NOy values are estimated to be 843±887 and
1189±751 pptv respectively. The extended configuration of the model also reduced
cap-ACPD
14, 1113–1158, 2014Dust aerosols and tropospheric
chemistry
R. Kumar et al.
Title Page
Abstract Introduction
Conclusions References
Tables Figures
◭ ◮
◭ ◮
Back Close
Full Screen / Esc
Printer-friendly Version Interactive Discussion
Discussion
P
a
per
|
D
iscussion
P
a
per
|
Discussion
P
a
per
|
Discuss
ion
P
a
per
|
tured the general features of the dust storm induced changes in spatial distribution of OMI retrieved tropospheric column NO2.
The dust storm leads to a decrease of 5–25 % in photolysis rate coefficients of ozone, NO2 and other trace gases at the surface and an increase of 1–5 % above 4 km. It is found to have a significant impact on the regional tropospheric chemistry: a decrease 5
of 5–99 % is estimated in the mixing ratios of a variety of trace gases including ozone, nitrogen oxides, hydrogen oxides, sulphur dioxide, methanol, acetic acid and formalde-hyde at the surface. Analysis of the vertical distributions of these trace gases shows that dust storm induced changes are significant up to an altitude 8 km and are esti-mated as 80–90 % (5–10 times) for highly reactive gases such as HNO3, NO3, N2O5, 10
H2O2and CH3COOH. It is found that majority of these changes are induced by the het-erogeneous chemistry, and the contribution of perturbation in photolysis rates generally remained less than 10 %. An increase of up to 30 % in volatile organic compounds is estimated due to decrease in OH concentrations.
The RH dependence of γ is found to play a large potential role in heterogeneous 15
chemistr. Sensitivity studies showed that the exclusion of the RH dependence can in-troduce a difference of one-two orders of magnitude in heterogeneous reactions rate constants, 20–25 % changes in ozone and HO2, and up to 50 % and 100 % changes in H2O2 and HNO3, respectively. These effects are comparable to heterogeneous chem-istry induced changes in these gases. We also tested the importance of atmospheric 20
aging of dust particles in the context of heterogeneous chemistry. Model experiments based on laboratory studies of changes in dust reactivity due to atmospheric process-ing showed that coatprocess-ing of dust with nitrate and sulfate may lead to changes of up to 1 ppbv in surface ozone simulations. A hypothetical simulation is also conducted by saturating the nitrate and sulfate coated dust particles for uptake of O3, HO2, OH, 25
ACPD
14, 1113–1158, 2014Dust aerosols and tropospheric
chemistry
R. Kumar et al.
Title Page
Abstract Introduction
Conclusions References
Tables Figures
◭ ◮
◭ ◮
Back Close
Full Screen / Esc
Printer-friendly Version Interactive Discussion
Discussion
P
a
per
|
D
iscussion
P
a
per
|
Discussion
P
a
per
|
Discuss
ion
P
a
per
|
This study clearly shows that the pre-monsoon season dust storm can potentially af-fect the regional tropospheric chemistry in northern India. However, the implications of the heterogeneous uptake of trace gases on aerosol size distributions and their feed-backs on radiation budget and cloudiness are not examined here. Dust particles coated with nitrate/sulfate may interact differently with radiation as compared to uncoated dust 5
particles and can increase or decrease cloudiness depending upon their size distribu-tion. Both of these processes will have important implications for the direct aerosol ra-diative forcing and the Elevated Heat Pump (EHP) hypothesis (Lau et al., 2006), which proposed that the absorption of solar radiation by dust and black carbon aerosols along the southern slopes of Himalayas modulates the meridional temperature gradient and 10
leads to an early onset of Indian summer monsoon. The heterogeneous chemistry scheme implemented in the MOZCART chemical mechanism here can be easily ex-tended to a more detailed aerosol module (e.g. MOSAIC) of WRF-Chem and these implications of heterogeneous chemistry for aerosols and their interaction with radia-tion and monsoon can be examined in a future study.
15
Nevertheless, this study demonstrates that the effects of dust aerosols through het-erogeneous chemistry and perturbation in photolysis rates should be included in at-mospheric chemistry transport models, especially for simulating air quality in northern India. At the same time, it is also imperative to improve the accuracy and precision of the reactive uptake coefficients, their dependence on relative humidity and atmospheric 20
processing of dust particles. The impact of changes in the reactivity of aged dust for all the gases must be included in the models as they become available. In addition, co-located and extensive measurements of ozone and related gases, along with physi-cal and chemiphysi-cal properties of dust aerosols in northern India are essential, especially during the dust storm season, for both model evaluation and to gain further insights 25
into the effects of dust aerosols on tropospheric chemistry.
Supplementary material related to this article is available online at http://www.atmos-chem-phys-discuss.net/14/1113/2014/