ACPD
13, 21837–21881, 2013WRF-Chem simulations of a pre-monsoon dust
storm
R. Kumar et al.
Title Page
Abstract Introduction
Conclusions References
Tables Figures
◭ ◮
◭ ◮
Back Close
Full Screen / Esc
Printer-friendly Version Interactive Discussion
Discussion
P
a
per
|
D
iscussion
P
a
per
|
Discussion
P
a
per
|
Discuss
ion
P
a
per
|
Atmos. Chem. Phys. Discuss., 13, 21837–21881, 2013 www.atmos-chem-phys-discuss.net/13/21837/2013/ doi:10.5194/acpd-13-21837-2013
© Author(s) 2013. CC Attribution 3.0 License.
Atmospheric Chemistry and Physics
Open Access
Discussions
Geoscientiic Geoscientiic
Geoscientiic Geoscientiic
This discussion paper is/has been under review for the journal Atmospheric Chemistry and Physics (ACP). Please refer to the corresponding final paper in ACP if available.
WRF-Chem simulations of a typical
pre-monsoon dust storm in northern
India: influences on aerosol optical
properties and radiation budget
R. Kumar1,2, M. C. Barth2, G. G. Pfister2, M. Naja3, and G. P. Brasseur1,4
1
Advanced Study Program, National Center for Atmospheric Research, Boulder, USA 2
Atmospheric Chemistry Division, National Center for Atmospheric Research, Boulder, USA 3
Aryabhatta Research Institute of Observational Sciences, Nainital, India 4
Climate Service Center, Helmholtz Zentrum Geesthacht, Hamburg, Germany
Received: 12 June 2013 – Accepted: 12 August 2013 – Published: 23 August 2013
Correspondence to: R. Kumar ([email protected])
ACPD
13, 21837–21881, 2013WRF-Chem simulations of a pre-monsoon dust
storm
R. Kumar et al.
Title Page
Abstract Introduction
Conclusions References
Tables Figures
◭ ◮
◭ ◮
Back Close
Full Screen / Esc
Printer-friendly Version Interactive Discussion
Discussion
P
a
per
|
D
iscussion
P
a
per
|
Discussion
P
a
per
|
Discuss
ion
P
a
per
|
Abstract
The impact of a typical pmonsoon season (April–June) dust storm event on the re-gional aerosol optical properties and radiation budget in northern India is analyzed. The dust storm event lasted from 17 to 22 April 2010 and the WRF-Chem model esti-mated total dust emissions of 7.5 Tg over the model domain. Both in situ (AERONET) 5
and satellite observations show significant increase (>50 %) in local to regional scale aerosol optical depth (AOD) and decrease (>70 %) in the Angström exponent (α) dur-ing this period. Amongst the AERONET sites in this region, Kanpur was influenced the most where the AOD reached up to 2.1 and theα decreased to−0.09 during the dust storm period. The WRF-Chem model reproduced the spatial and temporal dis-10
tributions of dust plumes and aerosol optical properties but generally underestimated the AOD. The average MODIS and WRF-Chem AOD (550 nm) values in high dust laden region are estimated as 0.80±0.30 and 0.68±0.28, respectively. Model results show that dust particles cool the surface and the top of the atmosphere, and warm the atmosphere. The regionally averaged radiative perturbation due to dust aerosols 15
is estimated as−2.0±3.0 W m−2 at the top of the atmosphere, 2.3±1.8 W m−2 in the atmosphere and−4.4±3.1 W m−2at the surface. The impact of these radiative pertur-bations on the surface energy budget is estimated to be small on a regional scale but significant locally.
1 Introduction 20
Dust storms frequently occur throughout the desert regions of the world especially dur-ing sprdur-ingtime, injectdur-ing large amounts of mineral dust aerosols into the atmosphere. Dust aerosols have a wide range of potential consequences for ambient air quality, global climate, atmospheric chemistry, and biogeochemical processes. Higher levels of particulate matter during dust storms can lead to serious health problems (e.g. Dey 25
bud-ACPD
13, 21837–21881, 2013WRF-Chem simulations of a pre-monsoon dust
storm
R. Kumar et al.
Title Page
Abstract Introduction
Conclusions References
Tables Figures
◭ ◮
◭ ◮
Back Close
Full Screen / Esc
Printer-friendly Version Interactive Discussion
Discussion
P
a
per
|
D
iscussion
P
a
per
|
Discussion
P
a
per
|
Discuss
ion
P
a
per
|
get directly by interacting with both short- and long-wave radiation (e.g., Seinfeld et al., 2004; Ge et al., 2010; Zhao et al., 2011) and indirectly by modifying cloud microphysics and cloud optical properties (Haywood and Boucher, 2000; Satheesh and Moorthy, 2005). They provide large surfaces for heterogeneous chemistry and deposition of dif-ferent trace gases (e.g. Dentener et al., 1996; Wang et al., 2012), and influence oceanic 5
and terrestrial biogeochemistry by transporting nutrients like iron (Jickells et al., 2005; Kalenderski et al., 2013). Dust aerosols are ice nuclei and potentially cloud conden-sation nuclei and can therefore affect cloud properties and precipitation (Miller et al., 2004; Zhao et al., 2011; Teller et al., 2012).
In general, dust aerosols are emitted from the arid and desert areas around the globe 10
with about 90 % of the total emissions occurring in the Northern Hemisphere (mostly in North Africa) (Li et al., 2008). Estimates of global total dust emissions by global models are highly uncertain and range from 500 to 6000 Tg yr−1 as reported by the Aerosol Comparisons between Observations and Models (AeroCom) project (Textor et al., 2006; Prospero et al., 2010; Huneeus et al., 2011). Dust aerosols are removed 15
from the atmosphere by dry and wet deposition with dry deposition removing larger particles near the source regions and wet deposition dominating during long-range transport over the oceanic regions.
Previous observations and simulations show that dust aerosols are not only con-fined to the source region but can be transported as far as 1000 km or more (Tegen 20
and Fung, 1994; Ginoux et al., 2001; Prospero et al., 2002; Prospero and Lamb, 2003; Mahowald et al., 2005; Uno et al., 2006; Li et al., 2008), and thus can potentially af-fect the aerosol optical properties and radiation budget of downwind regions. These impacts of dust aerosols on local to regional scale have been studied in many parts of the world including India (e.g. Dey et al., 2004; Prasad et al., 2007; Zhao et al., 2010, 25
ACPD
13, 21837–21881, 2013WRF-Chem simulations of a pre-monsoon dust
storm
R. Kumar et al.
Title Page
Abstract Introduction
Conclusions References
Tables Figures
◭ ◮
◭ ◮
Back Close
Full Screen / Esc
Printer-friendly Version Interactive Discussion
Discussion
P
a
per
|
D
iscussion
P
a
per
|
Discussion
P
a
per
|
Discuss
ion
P
a
per
|
et al., 2007; Pandithurai et al., 2008; Sharma et al., 2012). Knowledge of the regional scale distribution of dust aerosols and their impact on the regional radiation budget over the Indian region is still very limited.
Dust storms are often observed in the northern part of India where their primary source is the Great Indian Thar Desert located in north-western India (Washington 5
et al., 2003; Gautam et al., 2009). The dust storms over this region show a distinct seasonal cycle with higher frequency and intensity during the pre-monsoon season (April–June) (Sikka, 1997; Dey et al., 2004; Prasad and Singh, 2007). The generation of dust storms over northern India in the pre-monsoon season is supported by hotter and drier weather conditions (Kumar et al., 2012a). The prevailing westerly/south-westerly 10
winds in the lower atmosphere facilitate the transport of dust aerosols from the Thar Desert to the Indo-Gangetic Plain (IGP) region (Sikka, 1997). The IGP region is one of the most densely populated regions in the world accommodating 250–1000 people per km2 (CIESIN, http://sedac.ciesin.columbia.edu/gpw) and is a source region of several other types of anthropogenic aerosols with aerosol loadings 5–8 times higher than 15
those observed at sites outside the IGP region in India (Nair et al., 2007). Elevated dust loadings over the IGP region during the pre-monsoon season have also been seen in satellite data (Prospero et al., 2002; Washington et al., 2003). These dust storms are observed to significantly affect aerosol optical properties over Delhi (Pandithurai et al., 2008), Kanpur (Dey et al., 2004; Prasad and Singh, 2007), and Patiala (Sharma et al., 20
2012) on the IGP, and Nainital in the central Himalayas (Hegde et al., 2007). These studies based on observations at few sites show an increase in aerosol optical depths by more than 50 %, and decrease of 70–90 % in Angström exponent and a reduction of 50–100 Wm−2in solar radiation reaching the surface.
In light of the above conditions, the present study focuses on understanding the re-25
ACPD
13, 21837–21881, 2013WRF-Chem simulations of a pre-monsoon dust
storm
R. Kumar et al.
Title Page
Abstract Introduction
Conclusions References
Tables Figures
◭ ◮
◭ ◮
Back Close
Full Screen / Esc
Printer-friendly Version Interactive Discussion
Discussion
P
a
per
|
D
iscussion
P
a
per
|
Discussion
P
a
per
|
Discuss
ion
P
a
per
|
been used in previous studies over the Indian region and has been shown to capture well the important features of meteorological (Kumar et al., 2012a), chemical (Kumar et al., 2012b; Ghude et al., 2013) and particulate matter distributions (Seethala et al., 2012; Dipu et al., 2013).
The remainder of the manuscript is organized as follows. The WRF-Chem model do-5
main and configuration are described in Sect. 2. Different ground- and satellite-based observations used to understand the influence of the dust storm on aerosol optical properties and to evaluate the model performance are discussed in Sect. 3. The dis-tribution of dust aerosols and their impact on the radiation and surface energy budget are presented in Sect. 4. The findings from this study are summarized in Sect. 5. 10
2 The WRF-Chem model
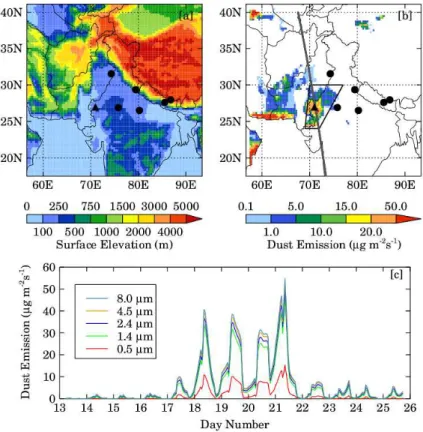
This study uses version 3.4.1 of the Weather Research and Forecasting Model (Ska-marock et al., 2008) coupled with Chemistry (Grell et al., 2005; Fast et al., 2006) to simulate the meteorology and chemistry over the model domain shown in Fig. 1a. The model domain is defined on a Mercator projection and extends from about 56◦E to 15
93◦E (120 grid points) in the east-west direction and from about 17◦N to 41◦N (90 grid points) in the north-south direction at a spatial resolution of 30 x 30 km2. The vertical grid is composed of 51 levels from the surface to 10 hPa (∼30 km) with a reso-lution of about 60 m near the surface, 200–400 m for altitudes around 1–3 km altitudes and 540–600 m for altitudes around 5–13 km. The static geographical fields such as 20
terrain height, soil properties, vegetation fraction, land-use and albedo etc. are inter-polated from 10 min (∼19 km) United States Geological Survey (USGS) data to the model domain by using the WRF preprocessing system (WPS). The model domain encompasses a widely varying landscape with elevated Himalayan terrain, low alti-tude (<500 m) Indo-Gangetic Plain, semi-arid and desert land masses and sea-shores 25
ACPD
13, 21837–21881, 2013WRF-Chem simulations of a pre-monsoon dust
storm
R. Kumar et al.
Title Page
Abstract Introduction
Conclusions References
Tables Figures
◭ ◮
◭ ◮
Back Close
Full Screen / Esc
Printer-friendly Version Interactive Discussion
Discussion
P
a
per
|
D
iscussion
P
a
per
|
Discussion
P
a
per
|
Discuss
ion
P
a
per
|
The initial and lateral boundary conditions for the meteorological fields are obtained from the National Center for Environmental Predictions (NCEP) Final Analysis (FNL) fields available every 6 h at a spatial resolution of 1◦×1◦. The resolved scale cloud physics is represented by the Thompson microphysics scheme (Thompson et al., 2004) and sub-grid scale effects of convective and shallow clouds are parameterized accord-5
ing to the Kain-Fritsch convective scheme (Kain, 2004). The short- and long-wave ra-diative transfer in the atmosphere is represented by the Rapid Rara-diative Transfer Model (RRTM) (Mlawer et al., 1997) which allows for online interaction between aerosols and meteorology in the model. For surface processes, the model setup uses the NOAH Land Surface model (Chen and Dudhia, 2001) and Janjic Eta surface layer scheme 10
(Janjic, 1996). The vertical sub-grid scale fluxes due to eddy transport in the planetary boundary layer and the free troposphere are parameterized according to the Mellor– Yamada–Janjic (MYJ) boundary layer scheme (Janjic, 1996, 2002). Four dimensional data assimilation (FDDA) technique is also applied to limit the model errors in the simulated meteorological fields (Lo et al., 2008). The horizontal winds, moisture and 15
temperature are nudged at all vertical levels with a nudging coefficient of 6×10⁻⁴s−1. The temperature and pressure show a mixed response to FDDA with changes of±2 K and ±1 g kg−1 while wind speed generally decreases over the model domain due to FDDA. The difference in wind speed is especially higher over the Thar Desert region (2–3 m s−1). The change in wind speed has direct consequences for dust emissions 20
which are discussed later in this section. Analysis of other consequences of analysis nudging through changes in dust emissions and their subsequent impacts on aerosol budget, their optical properties, photolysis rates and tropospheric chemistry deserves to be examined in a separate study and are not analyzed here.
The gas-phase chemistry is represented by the Model for Ozone and Related Chem-25
distri-ACPD
13, 21837–21881, 2013WRF-Chem simulations of a pre-monsoon dust
storm
R. Kumar et al.
Title Page
Abstract Introduction
Conclusions References
Tables Figures
◭ ◮
◭ ◮
Back Close
Full Screen / Esc
Printer-friendly Version Interactive Discussion
Discussion
P
a
per
|
D
iscussion
P
a
per
|
Discussion
P
a
per
|
Discuss
ion
P
a
per
|
butions and divided into eight size bins in the model to allow for interaction between GOCART aerosols and radiation. The initial and lateral boundary conditions for the chemical species are provided from six hourly output of MOZART-4 (Emmons et al., 2010). Anthropogenic emissions of CO, NOx, SO2, NH3, OC and BC and non-methane volatile organic compounds (NMVOC) are taken from the MACCity emission inventory 5
(Granier et al., 2011) and emissions for PM2.5and PM10 are taken from the Intercon-tinental Chemical Transport Experiment – Phase B (INTEX-B) inventory (Zhang et al., 2009). Daily varying emissions of trace species from biomass burning are taken from the Fire Inventory from NCAR version 1 (FINN v1) (Wiedinmyer et al., 2011) and dis-tributed vertically in the model following the online plume-rise module (Freitas et al., 10
2007). Note that FINN v1 accounts only for open biomass burning and the residential biomass burning is included in anthropogenic emissions. Biogenic emissions of trace species from terrestrial ecosystems are calculated online using the Model of Emissions of Gases and Aerosols from Nature (MEGAN) version 2.04 (Guenther et al., 2006). The aerosols are allowed to provide feedback to the radiation scheme in the simulations but 15
through direct effects only.
The GOCART scheme (Ginoux et al., 2001) calculates the dust emission flux online in the model by using the following expression:
Fp= (
CSspu210 m(u10 m−ut) ifu10 m>ut
0 otherwise (1)
where Fp (kg m−2s−1) represents the emission flux for size bin p, C is an empirical 20
proportionality constant (kg m−5s2), S is the source function representing the fraction of alluvium available for wind erosion,sp is the fraction of each size class of dust in the emission,u10 m(m s−1) is the horizontal wind speed at 10 m above the surface and ut is the threshold velocity (m s−1) below which dust emission does not occur and is a function of particle size, air density and surface moisture. The value ofC was pro-25
ACPD
13, 21837–21881, 2013WRF-Chem simulations of a pre-monsoon dust
storm
R. Kumar et al.
Title Page
Abstract Introduction
Conclusions References
Tables Figures
◭ ◮
◭ ◮
Back Close
Full Screen / Esc
Printer-friendly Version Interactive Discussion
Discussion
P
a
per
|
D
iscussion
P
a
per
|
Discussion
P
a
per
|
Discuss
ion
P
a
per
|
tuneable. Previous studies over the Sahara Desert (Zhao et al., 2010) and Arabian Peninsula (Kalenderski et al., 2013) found the model AOD greater than observations thus requiring a decrease in dust emissions, which was achieved by reducing C to 0.4−0.65×10⁻⁹kg m−5s2. In contrast, the default C value is found to yield very low dust emissions over the Indian region (Dipu et al., 2013).
5
Here, we used AOD (500 nm) and Angström exponent (α) observations at seven AERONET sites in the model domain to constrain theC value and dust emissions in northern India. Several sensitivity experiments suggest that aCvalue of 2.2×10⁻⁸kg m−5s2 leads to the best agreement between modeled and observed AOD (500 nm) andα at all these sites. It should be noted that this large increase (by a factor of 22) 10
in the C value is partly due to use of FDDA in the present model configuration as FDDA nudges simulated wind fields towards analysis fields and thus leads to lower wind speeds. A sensitivity experiment showed that similar dust emission can be ob-tained with aC value of 9×10⁻⁹kg m−5s2 without the use of FDDA. But we chose to use FDDA as the model configuration with FDDA is found to better reproduce the vari-15
ations in observed aerosol optical properties as compared to one without FDDA (not shown). The time series of dust emission at a location (71◦E, 27◦N) in the Thar Desert (indicated by a black triangle in Fig. 1a and b) is shown in Fig. 1c. The dust outbreak started on 17 April 2010, reached its maximum intensity on 21 April 2010 and ended on 22 April 2010. The total dust emissions over the model domain are estimated to be 20
11.8 Tg during 13–25 April 2010 out of which 7.5 Tg of dust was emitted during 17–22 April 2010 with emissions reaching as high as 2.1 Tg on 20 April 2010.
The model simulation began on 10 April 2010 at 00:00 UTC and ended on 25 April 2010 at 12:00 GMT, with model output every hour. The WRF-Chem model with this configuration has been evaluated in detail and is found to reproduce the meteo-25
ACPD
13, 21837–21881, 2013WRF-Chem simulations of a pre-monsoon dust
storm
R. Kumar et al.
Title Page
Abstract Introduction
Conclusions References
Tables Figures
◭ ◮
◭ ◮
Back Close
Full Screen / Esc
Printer-friendly Version Interactive Discussion
Discussion
P
a
per
|
D
iscussion
P
a
per
|
Discussion
P
a
per
|
Discuss
ion
P
a
per
|
days are discarded as model spin up and those after 13 April 2010 are used for further analysis.
3 Observation techniques and data
3.1 Aerosol Robotic Network (AERONET) data
The Aerosol Robotic Network (AERONET) (Holben et al., 1998) is a ground-based 5
remote sensing aerosol network of more than 1000 sites established by the National Aeronautics and Space Administration (NASA), which uses sun- and sky-scanning ra-diometers to measure aerosol optical properties (Dubovik and King, 2000). This study uses AERONET version 2, level 2 cloud-screened and quality assured aerosol op-tical depth (AOD) at 500 nm, Angström exponent (440–870 nm), and single scattering 10
albedo (SSA) at 675 nm from seven sites in the model domain for studying the impact of the dust storm on aerosol optical properties and for comparison with model results. The geographical locations of these seven sites are shown in Fig. 1a and b. These seven sites are Kanpur (80.23◦E, 26.51◦N, 123 m), Nainital (79.46◦E, 29.36◦N, 1939 m), Jaipur (75.81◦E, 26.91◦N, 450 m), Lahore (74.32◦E, 31.54◦N, 270 m), Kathmandu-15
University (85.54◦E, 27.60◦N, 1510 m), EVK2-CNR (86.813◦E, 27.96◦N, 5050 m) and Pokhara (83.97◦E, 28.15◦N, 807 m) (Fig. 1a and b). These seven sites allow for the model evaluation in different chemical environments with Kanpur, Jaipur, Lahore, Kath-mandu and Pokhara representing urban conditions while Nainital and EVK2-CNR rep-resent cleaner higher altitude environments. The uncertainty of AERONET AOD mea-20
surements is reported to be about±0.01 for AOD at wavelengths greater than 440 nm (Holben et al., 1998).
3.2 Satellite data
This study uses Sea viewing Wide Field of view Sensor (SeaWiFS) Level 3 “Deep Blue” 550 nm AOD retrievals at spatial resolution of 0.5◦
ACPD
13, 21837–21881, 2013WRF-Chem simulations of a pre-monsoon dust
storm
R. Kumar et al.
Title Page
Abstract Introduction
Conclusions References
Tables Figures
◭ ◮
◭ ◮
Back Close
Full Screen / Esc
Printer-friendly Version Interactive Discussion
Discussion
P
a
per
|
D
iscussion
P
a
per
|
Discussion
P
a
per
|
Discuss
ion
P
a
per
|
lution Imaging Spectroradiometer (MODIS) Collection 5.1 “Deep Blue” 550 nm Level 3 AOD retrievals at spatial resolution of 1◦
×1◦, and Level 2 retrievals at 10 km resolution. The Ozone Monitoring Instrument (OMI) retrieved Level 3 ultraviolet aerosol index at a spatial resolution of 0.25◦×0.25◦, and Cloud-Aerosol Lidar and Infrared Pathfinder Satellite Observation (CALIPSO) retrieved Level 2 profiles of extinction coefficient at 5
532 nm are also used. The SeaWiFS and MODIS instruments measure Earth’s spec-tral radiance in 412–865 nm and 400–14 400 nm wavelength ranges, respectively. The standard MODIS aerosol retrieval algorithm does not retrieve aerosol information over bright surfaces such as the Thar Desert due to strong surface spectral contribution in the visible range (Kaufman et al., 1997). For this reason, we use the recently de-10
veloped “Deep Blue” AOD retrievals at 550 nm over land from MODIS (collection 5.1) aboard Aqua (Hsu et al., 2004) which is able to retrieve AOD over such bright sur-faces. The OMI ultraviolet aerosol index is retrieved from the backscattered radiation measured by the OMI in 270–500 nm wavelength range. The ultraviolet aerosol index is not an optical depth but is a useful index for separating the absorbing and scatter-15
ing aerosols with negative and near-zero values associated with scattering aerosols and values greater than 1 associated with absorbing aerosols. CALIPSO integrates an active lidar instrument with passive infrared and visible imager to probe vertical struc-ture of aerosols and clouds. The acquired lidar backscatter profiles are calibrated and range registred to indetify cloud and aerosol layers, and retrieve aerosol extinction co-20
efficients at 532 nm and 1064 nm. Detailed information on CALIPSO retrieved aerosol products can be seen in Winker et al. (2013) and references therein.
3.3 Evaluation methodology
The aerosol optical properties in WRF-Chem are available at 300, 400, 600 and 999 nm respectively while AOD from AERONET and satellite data are available at 500 and 25
ACPD
13, 21837–21881, 2013WRF-Chem simulations of a pre-monsoon dust
storm
R. Kumar et al.
Title Page
Abstract Introduction
Conclusions References
Tables Figures
◭ ◮
◭ ◮
Back Close
Full Screen / Esc
Printer-friendly Version Interactive Discussion
Discussion
P
a
per
|
D
iscussion
P
a
per
|
Discussion
P
a
per
|
Discuss
ion
P
a
per
|
model AOD at 500 and 550 nm, the Angström power law is used:
W(λ)=W(400)× λ
400 −α
(2)
where W(λ) is the WRF-Chem AOD at wavelength λ (500 or 550) nm and α is the Angström exponent calculated from WRF-Chem AOD at 300 and 999 nm using the following relation:
5
α=
lnWW(300)(999)
ln 999300 (3)
The Eqs. (2) and (3) are consistent with the WRF-Chem framework as the model also use these equations to interpolate/extrapolate the AOD (300–999 nm) to RRTM spectra (0.2–12 µm) for aerosol-radiation interaction in the model. The model SSA at 675 nm is derived by linearly interpolating model SSA between 300 and 999 nm. The WRF-Chem 10
AOD and SSA are matched with AERONET/satellite data in space and time using a bi-linear interpolation of the four nearest model grid points. The co-located model and observed data are then used for further analysis.
4 Results and discussion
4.1 General meteorology
15
This section discusses the general meteorological features of the northern Indian re-gion to understand the cause of this dust storm. The average modeled temperature and relative humidity over the Thar Desert and IGP region during 13–25 April are es-timated as 31–35◦C and 10–20 % respectively, and the total rainfall is estimated to be less than 10 mm over both these regions indicating the presence of hot and dry con-20
ACPD
13, 21837–21881, 2013WRF-Chem simulations of a pre-monsoon dust
storm
R. Kumar et al.
Title Page
Abstract Introduction
Conclusions References
Tables Figures
◭ ◮
◭ ◮
Back Close
Full Screen / Esc
Printer-friendly Version Interactive Discussion
Discussion
P
a
per
|
D
iscussion
P
a
per
|
Discussion
P
a
per
|
Discuss
ion
P
a
per
|
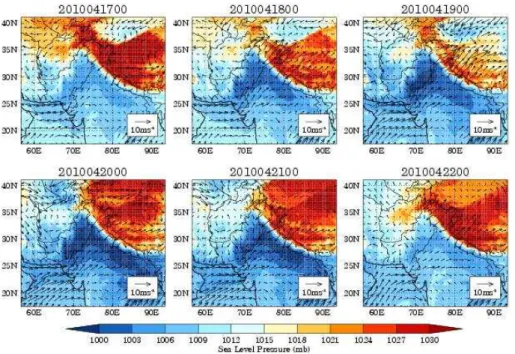
with 10 m wind vectors from 17 to 22 April 2010 at 00:00 GMT are shown in Fig. 2. The winds blowing into the Thar Desert were mostly south-westerly and changed to westerly/north-westerly while moving along the IGP. The sea level pressure shows the presence of a low pressure system over the IGP on 17 April increasing in strength from 17 through 21 April. This low pressure system generated strong winds which in turn led 5
to higher dust emissions during this period (Fig. 1c). The sea level pressure increased on 22 April and consequently the wind speed and dust emissions decreased. How-ever, AOD levels at some AERONET sites were still high on 22 April (Sect. 4.3) despite the decreased dust emission and thus further analysis in this study is restricted to the period of 17–22 April 2010, unless stated otherwise.
10
The spatial distributions of the daytime (09:30–16:30 IST or 04:00–11:00 UTC) aver-age planetary boundary layer (PBL) height and tropopause height a.g.l. over the model domain during 17–22 April 2010 are shown in Fig. 3 to help the interpretation of the PBL and free tropospheric dust load calculations shown in Sect. 4.2. The tropopause altitude is determined using the thermal tropopause definition (Reichler et al., 2003). 15
The daytime average PBL height is 1500–3500 m over the Indian region and shows strong diurnal variability with daytime heights reaching up to 3000–5000 m and night-time values remaining below 500 m. The average PBL height over the oceanic regions shows little diurnal variation and on average is 150–600 m. The average tropopause height is 12–17 km over regions south of 30◦N and decreases to 7–12 km for 30◦– 20
40◦N.
4.2 Spatial and vertical distribution of dust
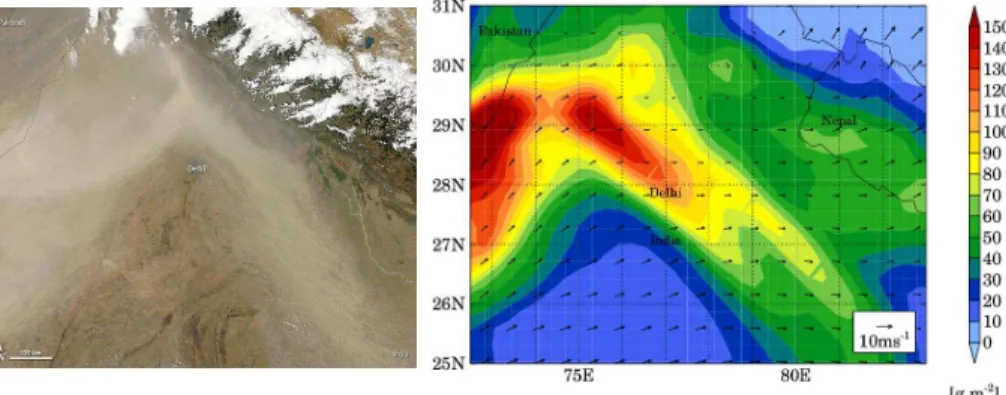
The natural color image captured by MODIS aboard Aqua on 21 April 2010 at 07:45 GMT shows an event of dust blowing through northern India (Fig. 4). This natural color image is used to examine the ability of WRF-Chem in simulating the transport 25
ACPD
13, 21837–21881, 2013WRF-Chem simulations of a pre-monsoon dust
storm
R. Kumar et al.
Title Page
Abstract Introduction
Conclusions References
Tables Figures
◭ ◮
◭ ◮
Back Close
Full Screen / Esc
Printer-friendly Version Interactive Discussion
Discussion
P
a
per
|
D
iscussion
P
a
per
|
Discussion
P
a
per
|
Discuss
ion
P
a
per
|
well. Both MODIS and WRF-Chem show dust blowing along the Indo-Pakistan bor-der and changing direction just west of the Himalayas followed by southward transport along the Indo-Gangetic Plain alongside the southern face of the Himalayas. The role of south-westerly winds in redistributing dust is consistent with previous studies (Sikka, 1997; Dey et al., 2004; Prasad and Singh, 2007).
5
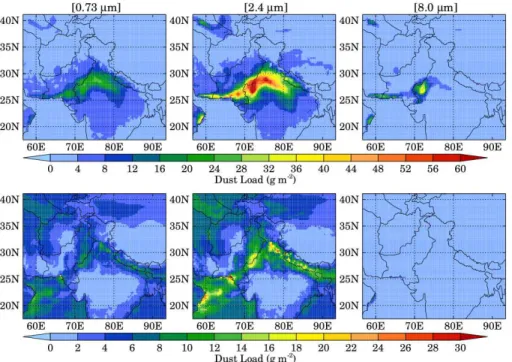
To examine where the dust emitted from the Thar Desert was transported, the spatial distributions of WRF-Chem simulated daytime (09:30 to 16:30 LT) average dust load-ings in the boundary layer and free troposphere over the model domain during 17–22 April 2010 are shown in Fig. 5 for dust particles of 0.73 µm, 2.4 µm 8.0 µm effective raddi representing small, coarse and giant mode dust particles respectively. The dust 10
loadings in the boundary layer and free troposphere are obtained every hour by in-tegrating dust mass concentrations from the surface to the top of the PBL, and from the PBL height to the tropopause height, respectively. Dust loading distributions in the boundary layer are consistent with patterns of dust emissions with highest values over the source region (Thar Desert) and nearby downwind regions (western IGP). The av-15
erage dust loadings for small, coarse and giant mode particles range from 0–32, 0–60 and 0–40 g m−2, respectively. The small and coarse mode dust particles show similar distributions but coarse particles are mostly responsible for the higher dust loadings over the Thar Desert and western IGP region. This is consistent with observations de-tecting a small change in fine mode particles and large increases (∼3 times) in coarse 20
mode aerosols at Kanpur during dust storms (Dey et al., 2004). The giant mode par-ticle distribution shows higher concentrations only in the source regions because they quickly fall back to the surface and are not transported over longer distances. The domain averaged total dust loadings in the daytime boundary layer is estimated as 21±42 g m−2out of which 68 % is attributed to dust emissions for 1.4 and 2.4 µm eff ec-25
tive raddi.
ACPD
13, 21837–21881, 2013WRF-Chem simulations of a pre-monsoon dust
storm
R. Kumar et al.
Title Page
Abstract Introduction
Conclusions References
Tables Figures
◭ ◮
◭ ◮
Back Close
Full Screen / Esc
Printer-friendly Version Interactive Discussion
Discussion
P
a
per
|
D
iscussion
P
a
per
|
Discussion
P
a
per
|
Discuss
ion
P
a
per
|
are less than 2 g m−2. Small and coarse mode dust particles in the free troposphere are distributed over a wider spatial extent relative to the boundary layer, because free tropospheric winds are stronger and more efficient in transporting dust plumes. Addi-tionally, the influence of emissions sources is reduced in the free troposphere and the lifetime of dust particles increases as they become less susceptible to dry deposition. 5
Interestingly, free tropospheric dust loadings over some regions such as the Arabian Sea are higher than in the boundary layer indicating that long-range transport of dust particles may play an important role to aerosol radiative effects in the free troposphere. The domain averaged total dust loading in the daytime free troposphere is estimated to be 19±22 g m−2out of which 71 % comes from the dust emissions for 1.4 and 2.4 µm 10
effective raddi.
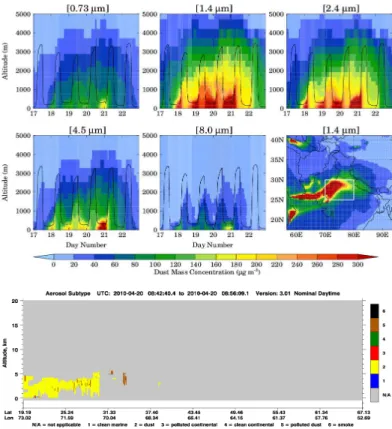
The time series for 17–22 April of the vertical distribution of average mass concentra-tion of dust particles with 0.73, 1.4, 2.4, 4.5 and 8.0 µm effective radii spatially averaged over the area of 70–80◦E and 25–30◦N is shown in Fig. 6 to examine the altitude at-tained by dust plumes. This region is chosen because the dust storm had maximum in-15
fluence in this region. We also include the spatially averaged planetary boundary layer height in the graphs. Average PBL height over this region varies from about 50 m during nighttime to about 3200 m during daytime. The simulated PBL cannot be evalauted due to the lack of observations. Dust mass concentrations in all five size bins show a sharp vertical gradient with values higher in the PBL (60–300 µg m−3) compared to the free 20
troposphere (<200 µg m−3). Above 5000 m the dust mass concentration decreases to less than 20 µg m−3.
Dust mass concentrations near the surface show a strong diurnal cycle with highest values during nighttime (Fig. 6). Even though the dust emissions show peak values around local noon (Fig. 1c), higher nighttime values indicate the dominant role of PBL 25
ACPD
13, 21837–21881, 2013WRF-Chem simulations of a pre-monsoon dust
storm
R. Kumar et al.
Title Page
Abstract Introduction
Conclusions References
Tables Figures
◭ ◮
◭ ◮
Back Close
Full Screen / Esc
Printer-friendly Version Interactive Discussion
Discussion
P
a
per
|
D
iscussion
P
a
per
|
Discussion
P
a
per
|
Discuss
ion
P
a
per
|
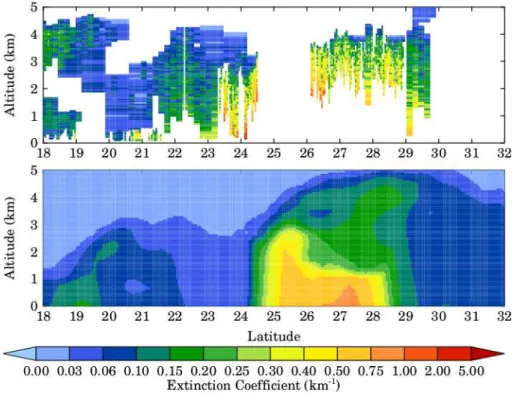
The overpass of CALIPSO over this region on 20 April 2010 at 08:15 UTC (see Fig. 1b) allows us to evaluate the height of the dust plume in the model. The time-altitude image of aerosol subtypes retrieved by CALIPSO shown in bottom panel of Fig. 6 clearly shows the presence of dust aerosols up to an altitude of 5000 m. The WRF-Chem simulated extinction coefficient at 550 nm on 20 April 2010 at 08:00 UTC 5
is extracted along the CALIPSO track and compared with CALIPSO retrived extinction coefficient at 532 nm in Fig. 7. The best quality CALIPSO retrievals are selected for comparison following the guidelines provided by the CALIPSO science team. In gen-eral, WRF-Chem underestimates the extinction coefficient retrived by CALIPSO but captures the spatial and vertical variations along the CALIPSO track. The extinction 10
coefficient increase from 0.03–0.4 km−1in 18–23◦N latitude band to 0.4–1 km−1 over the Thar Desert (24–29◦N) region in both the CALIPSO and WRF-Chem. Like vertical distribution of dust, the WRF-Chem extinction coefficient also show a sharp decrease in extinction coefficient with values of more than 0.5 km−1 near the surface and values lower than 0.3 km−1 above 4 km. Even though the CALIPSO data does not extend to 15
the surface, a sharp decrease in the CALIPSO extinction coefficient is also discerned.
4.3 Impact of dust storm on aerosol optical properties
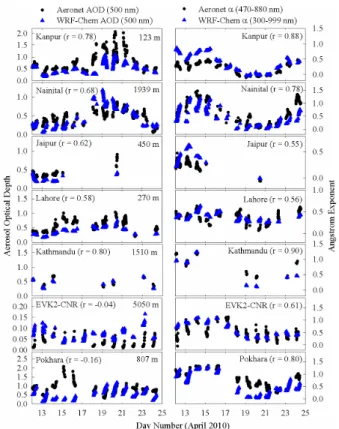
The time series of WRF-Chem simulated aerosol optical depth at 500 nm and Angström exponent (α) at seven sites in the model domain are compared with co-located AERONET observations during 13–25 April 2010 (Fig. 8). AOD represents the inte-20
grated extinction (absorption + scattering) coefficient over a vertical column of unit cross section andα describes the dependency of AOD on wavelength and is inversely related to aerosol size with smaller values for larger particles and vice-versa. Note thatα for AERONET measurements is available for the 470–880 nm wavelength range while that for the model is calculated from AOD at 300 and 999 nm using Eq. (3). Both 25
ACPD
13, 21837–21881, 2013WRF-Chem simulations of a pre-monsoon dust
storm
R. Kumar et al.
Title Page
Abstract Introduction
Conclusions References
Tables Figures
◭ ◮
◭ ◮
Back Close
Full Screen / Esc
Printer-friendly Version Interactive Discussion
Discussion
P
a
per
|
D
iscussion
P
a
per
|
Discussion
P
a
per
|
Discuss
ion
P
a
per
|
Kanpur and Nainital was still somewhat elevated on the following days indicating the lingering impact of dust aerosols in the region.
Observed AOD at Kanpur reaches as high as 2.1 and α reaches as low as−0.09. The simulated AOD does not reach the magnitude of the observed peaks at Kanpur, but captures the temporal evolution and simulates well the low values ofα. The observed 5
and model average 500 nm AOD at Kanpur during 17–22 April 2010 are estimated as 1.07±0.40 and 0.64±0.26 respectively, and the correspondingα values are estimated as 0.06±0.14 and 0.12±0.18 respectively. In contrast to Kanpur, the model overes-timates AOD at Nainital particularly during 18–19 April but is in very good agreement with observations during 20–22 April and captures well the lowestα values. The ob-10
served and model average 500 nm AOD at Nainital are estimated as 0.61±0.17 and 0.73±0.22 respectively, and the correspondingαvalues are 0.26±0.24 and 0.18±0.24 respectively.
These average AOD values are significantly higher and α values are significantly lower than the seasonal (MAM) mean values reported at Kanpur (AOD: 0.54±0.26,α: 15
0.6±0.31; Singh et al., 2004) and Nainital (AOD: 0.29±0.03,α: 0.5–0.9; Sagar et al., 2004) but the values reported here are commonly observed during dust storms events (Dey et al., 2004; Prasad and Singh, 2007; Hegde et al., 2007). This suggests that the dust storm of 17–22 April 2010 was a typical pre-monsoon dust storm. AOD values at other sites do not show a significant increase during the dust storm. A slight decrease 20
inα indicates that these sites are also influenced by the dust storm but likely by thinner dust plumes.
The correlation coefficient between model and observations for AOD at all the sites ranges from 0.58 to 0.80 except at EVK2-CNR (r =−0.04) and Pokhara (r =−0.16). However, the correlation coefficient forαis found to range from 0.55 to 0.88 at all sites 25
ACPD
13, 21837–21881, 2013WRF-Chem simulations of a pre-monsoon dust
storm
R. Kumar et al.
Title Page
Abstract Introduction
Conclusions References
Tables Figures
◭ ◮
◭ ◮
Back Close
Full Screen / Esc
Printer-friendly Version Interactive Discussion
Discussion
P
a
per
|
D
iscussion
P
a
per
|
Discussion
P
a
per
|
Discuss
ion
P
a
per
|
a.m.s.l.) being a low altitude site and the second biggest city of Nepal with a popula-tion of about 200 000 people representing an urban environment whereas EVK2-CNR (∼5050 m a.m.s.l.) and Nainital (∼1939 m a.m.s.l.) being high altitude sites located far from the major anthropogenic activities in the Himalayas representing cleaner environ-ments. This indicates that the uncertainties in aerosol emissions could be a major con-5
tributor to the model bias at Pokhara whereas errors in modeled transport processes could be of more importance for EVK2-CNR. However, a quantitatification of the rela-tive contribution of these factors is not possible here due to lack of suitable aerosol and meteorlogical measurements. The horizontal resolution of the model is another impor-tant factor affecting the simulated trace species in the model domain especially in the 10
Himalayan region. Note that the sites of EVK2-CNR (5050 m), Nainital (1936 m) and Pokhara (807 m) are located in the region of rapidly varying topography (Fig. 1a) and modeled altitude of these sites is estimated to be offby 400–900 m. The errors in model topography will induce errors in modeled meteorology and thus transport of aerosols to these sites. However, the coarse horizontal resolution (50 km) of MACCity emission 15
inventory used here limit the applicability of model at a much finer resolution (<10 km). The lack of a secondary organic aerosol formation scheme in the current model set-up might also have some contribution to the model-observation discrepancies.
The WRF-Chem simulated single scattering albedo (SSA) values are also compared to AERONET observed SSA at 675 nm. There are very few SSA observations avail-20
able at the AERONET sites and more than 10 data points are available only at Kan-pur (N=31), Nainital (N=24), Lahore (N=42) and Pokhara (N=26) during 13–25 April 2010. The column-averaged modeled and observed SSA values during 13–25 April 2010 are estimated to be 0.877±0.006 and 0.900±0.036 (r =0.80) at Kanpur, 0.871±0.002 and 0.929±0.027 (r =0.72) at Nainital, 0.877±0.004 and 0.916±0.018 25
ACPD
13, 21837–21881, 2013WRF-Chem simulations of a pre-monsoon dust
storm
R. Kumar et al.
Title Page
Abstract Introduction
Conclusions References
Tables Figures
◭ ◮
◭ ◮
Back Close
Full Screen / Esc
Printer-friendly Version Interactive Discussion
Discussion
P
a
per
|
D
iscussion
P
a
per
|
Discussion
P
a
per
|
Discuss
ion
P
a
per
|
Satellite observations of AOD and aerosol index are used to examine the dust storm induced changes in aerosol properties on a regional scale. The spatial distributions of aerosol optical depth at 550 nm retrieved by SeaWiFS and MODIS, and the OMI re-trieved ultraviolet aerosol index during 13–16 April and 17–22 April 2010 are shown in Fig. 9. The periods of 13–16 April and 17–22 April 2010 represent periods of low and 5
high dust emissions respectively (Fig. 1c). AOD retrievals from both the satellites show similar spatial structure (r =0.75) during both low and high dust emission periods and an increase of more than 50 % between the period with low (0.2 to 0.4) and the period with high (0.5 to more than 1) dust emissions over the Thar Desert and western IGP re-gion. MODIS and SeaWiFS show similar relative changes, but, AOD from SeaWiFS is 10
only about half of the value retrieved by MODIS indicating the large uncertainty in satel-lite AOD retrievals. The OMI UV aerosol index also shows an increase of more than 50 % between the low and high dust emission period indicating increased abundance of absorbing aerosols. Agricultural crop residue burning might also be an important source of absorbing aerosols during the pre-monsoon season in northern India (Ku-15
mar et al., 2011). However, the analysis of MODIS fire counts suggests low biomass burning activity over this region (http://firms.modaps.eosdis.nasa.gov/firemap/) during 17–22 April 2010 and thus enhancement in aerosol index is likely due to increase in dust aerosols. The presence of biomass burning aerosols is also ruled out by sharp decrease inαvalues during this period.
20
The ability of WRF-Chem in simulating the spatial distribution of AOD during low and high dust emission periods is also examined by comparing the model results with co-located Level 2 MODIS retrieved AOD at 550 nm as shown in Fig. 10. MODIS retrievals of AOD are used for evaluation because previous studies have shown that MODIS AOD compares well with in situ observations over the Indian region (Ramachandran, 2007; 25
ACPD
13, 21837–21881, 2013WRF-Chem simulations of a pre-monsoon dust
storm
R. Kumar et al.
Title Page
Abstract Introduction
Conclusions References
Tables Figures
◭ ◮
◭ ◮
Back Close
Full Screen / Esc
Printer-friendly Version Interactive Discussion
Discussion
P
a
per
|
D
iscussion
P
a
per
|
Discussion
P
a
per
|
Discuss
ion
P
a
per
|
shown that current emission inventories lead to a drastic underestimation of BC aerosol over India (e.g. Nair et al., 2012). However, both the WRF-Chem and MODIS AOD show similar spatial distributions during 17–22 April 2010 with highest values over the Thar Desert and western IGP region but the model still underestimates MODIS AOD retrievals outside these regions. Despite the differences in absolute magnitudes, the 5
spatial distributions of percentage changes in AOD between high and low dust emis-sion periods are similar with both of them showing an increase of more than 100 % over the Thar Desert and western IGP and decrease of less than 50 % over central India.
The MODIS and WRF-Chem AOD (550 nm) values averaged over the region of max-imum dust influence (70–80◦E, 25–30◦N) during the low dust emission period are esti-10
mated as 0.48±0.19 and 0.28±0.06 respectively, and the corresponding average val-ues during the high dust emission period are estimated as 0.80±0.30 and 0.68±0.28, respectively. The correlation coefficients over this region during the low and high dust emission periods are estimated as 0.14 and 0.58 respectively.
4.4 Impact of dust storm on radiation budget 15
The evaluation results presented in the above sections showed that the model under-estimates the observed AOD values but is able to capture the temporal evolution of the dust storm and associated variations in aerosol optical properties, and thus provides confidence for using the model to understand the impact of this dust event on the ra-diation budget. We examine the radiative perturbation of dust aerosols on short-wave 20
(SW), long-wave (LW) and net (SW+LW) radiation fluxes at the top of atmosphere (TOA) and the surface (SFC) by comparing two parallel simulations with and without dust aerosols. It has to be noted that the calculated atmospheric radiative perturbation does not equal a “radiative forcing” because the impact of aerosols on radiation may also affect the distribution of clouds as well as dynamics in the model and thus changes 25
ACPD
13, 21837–21881, 2013WRF-Chem simulations of a pre-monsoon dust
storm
R. Kumar et al.
Title Page
Abstract Introduction
Conclusions References
Tables Figures
◭ ◮
◭ ◮
Back Close
Full Screen / Esc
Printer-friendly Version Interactive Discussion
Discussion
P
a
per
|
D
iscussion
P
a
per
|
Discussion
P
a
per
|
Discuss
ion
P
a
per
|
clouds over the model domain during the simulation period and those clouds that were simulated were located outside the region impacted by the dust storm. Therefore, the radiative changes reported here are expected to be close to the actual radiative forc-ing values. The difference between TOA and SFC radiative perturbations represents a change in radiation budget for the entire atmosphere and is termed as atmospheric 5
radiative perturbation (ATM). The net radiative fluxes (either SW or LW) at the SFC and TOA are calculated as the difference between down-welling and up-welling fluxes.
The spatial distributions of diurnally averaged all-sky SW, LW and net radiative per-turbation induced by dust aerosols during 17–22 April 2010 at the TOA, in the ATM and at the SFC are shown in Fig. 11. The spatial distributions of the dust radiative per-10
turbation (either SW or LW or Net) are consistent with simulated distributions of dust with highest values over the Thar Desert and western IGP region. The dust SW radia-tive perturbation at the TOA is generally negaradia-tive over the model domain except over the regions of higher surface albedo such as the Himalayan glaciers, the Thar Desert, and arid regions of Pakistan and Middle East. The SW radiative perturbation of dust 15
at TOA depends strongly on the SW absorptivity of dust and generally has a cooling effect over the land regions for moderately absorbing dust (imaginary part of refractive index=0.003; Kalenderski et al., 2013) as is the case here.
The domain averaged dust SW radiative perturbation at TOA is −3.6±3.4 W m−2 with a maximum value of−43.0 W m−2. The WRF-Chem simulated diurnally averaged 20
SW aerosol radiative perturbation at the TOA are compared with the radiative forc-ing estimates available for dusty days in the literature (Table 1). The WRF-Chem esti-mates at the TOA are similar to the observation based estiesti-mates at Patiala and Kan-pur but are much lower than those reported for Delhi. The differences at Delhi could be due to the difference in SW aerosol absorptivity as WRF-Chem considers dust 25
ACPD
13, 21837–21881, 2013WRF-Chem simulations of a pre-monsoon dust
storm
R. Kumar et al.
Title Page
Abstract Introduction
Conclusions References
Tables Figures
◭ ◮
◭ ◮
Back Close
Full Screen / Esc
Printer-friendly Version Interactive Discussion
Discussion
P
a
per
|
D
iscussion
P
a
per
|
Discussion
P
a
per
|
Discuss
ion
P
a
per
|
10.6 W m−2. The net (SW
+LW) radiative perturbation of dust is thus controlled mostly by SW radiative effects and has a small cooling effect with domain averaged value of −2.0±3.0 W m−2. Similar values have been reported for the Arabian Peninsula and Red Sea (−2.3 W m−2) (Kalenderski et al., 2013). The analysis of vertical profiles of SW and LW heating rates (not shown) revealed that the dust induced perturbations in radiation 5
fluxes and heating rate are consistent with vertical distribution of dust and decrease as we move from the surface to higher altitudes. The changes in both SW and LW heating rates approaches zero near 6 km.
The dust SW radiative perturbation in the atmosphere is positive throughout the model domain because dust absorbs SW radiation and warms the atmosphere. The do-10
main averaged SW dust radiative perturbation in the atmosphere is 6.6±5.2 W m−2with a maximum value of 41.1 W m−2. The LW radiative perturbation of dust has a cooling effect in the atmosphere with highest values over the Thar Desert (−28.9 W m−2). This is because of the hotter desert surface and strong interaction between LW radiation and coarse particles that remain confined to the source region due to their shorter atmo-15
spheric lifetimes. Overall, the net (SW+LW) radiative perturbation of dust has a small warming effect in the atmosphere with domain averaged value of 2.3±1.8 W m−2and a maximum of 13.7 W m−2.
At the surface, the dust SW radiative perturbation has a cooling effect because dust aerosols attenuate the incoming radiation through absorption and scattering in the at-20
mosphere. The modeled diurnally averaged SW dust radiative perturbation estimated at the surface is less than the observation based estimates available for Patiala and Delhi but are similar for Kanpur (Table 1). The domain averaged dust SW radiative per-turbation at the surface is −10.1±7.1 W m−2 with a maximum value of −49.2 W m−2. This regional mean value of−10.1 W m−2is comparable to the values of SW dust radia-25
ACPD
13, 21837–21881, 2013WRF-Chem simulations of a pre-monsoon dust
storm
R. Kumar et al.
Title Page
Abstract Introduction
Conclusions References
Tables Figures
◭ ◮
◭ ◮
Back Close
Full Screen / Esc
Printer-friendly Version Interactive Discussion
Discussion
P
a
per
|
D
iscussion
P
a
per
|
Discussion
P
a
per
|
Discuss
ion
P
a
per
|
Thar desert (31.8 W m−2). The net (SW
+LW) radiative perturbation of dust has a cool-ing effect at the surface and is−4.4±3.1 W m−2on domain average and−38.8 W m−2 on maximum.
The simulations with and without dust are also used to examine changes in the surface energy budget. Figure 12 shows the spatial distributions of changes in daytime 5
(07:30–18:30 IST), nighttime (18:30–07:30 IST) and 24 h average sensible heat flux, latent heat flux, 2 m temperature and planetary boundary layer (PBL) height. It has to be noted that analysis nudging was applied to temperature, water vapour and winds in the model simulations and thus changes shown here may not present the full response of radiative perturbations due to dust aerosols.
10
The heat fluxes, temperature and PBL height generally show a decrease during day-time and an increase during nightday-time because of the dust loading, except latent heat flux, which shows a mixed response during nighttime. The changes are larger during daytime and smaller during nighttime except for temperature, for which the opposite is true. The larger increase in nighttime temperature over the Thar Desert is likely due to 15
trapping of long-wave radiation by dust particles. Thus, the net effect of the dust storm on heat fluxes and PBL height are dominated by daytime responses and by night-time responses in case of temperature. The dust storm induced radiative perturbation is estimated to cause an overall small decrease of−2.9±2.7 W m−2 in sensible heat flux,−0.42±1.9 W m−2in latent heat flux, 0.1±0.2 K in temperature and−6.9±14.1 m 20
in 24 h domain average PBL height. However, changes can be locally significant and reach up to−69.4 and−34.2 W m−2in sensible and latent heat fluxes, 4.4 K in temper-ature and−215.3 m in PBL height. These changes can have important implications for the stability and circulation of the lower atmosphere.
5 Summary and conclusions
25
ACPD
13, 21837–21881, 2013WRF-Chem simulations of a pre-monsoon dust
storm
R. Kumar et al.
Title Page
Abstract Introduction
Conclusions References
Tables Figures
◭ ◮
◭ ◮
Back Close
Full Screen / Esc
Printer-friendly Version Interactive Discussion
Discussion
P
a
per
|
D
iscussion
P
a
per
|
Discussion
P
a
per
|
Discuss
ion
P
a
per
|
and satellite based observations with WRF-Chem model results. The model predicted a total amount of 7.5 Tg dust emitted during 17–22 April 2010 with values reaching as high as 2.1 Tg on 20 April 2010. The dust storm and its impact on aerosol optical prop-erties are captured by both in situ and satellite observations. Analysis of AERONET observations shows that Kanpur and Nainital are influenced the most by dust plumes 5
where 500 nm AOD increased by more than 50 % and Angström exponent decreased by more than 70 %. The consistency of these changes in aerosol optical properties with general features of dust storm events reported for Kanpur (Dey et al., 2004; Prasad and Singh, 2007) indicate that this was a typical pre-monsoon season dust storm. Satellite observations show a substantial increase in the regional aerosol loading resulting in 10
a 550 nm AOD increase of more than 50 % over the Thar Desert and Indo-Gangetic Plain region due to increase in the abundance of absorbing aerosols.
We use the WRF-Chem model to understand the evolution and impact of this dust storm on the radiation and the surface energy budget. Analysis of modeled meteo-rology shows that this dust storm was generated by the presence of a low pressure 15
area over the Indo-Gangetic Plain region that created high surface winds. WRF-Chem predicted domain-averaged daytime average total dust loadings of 21 and 19 g m−2 in the boundary layer and free troposphere, respectively with 68–71 % of the dust load-ing from coarse mode dust particles of 1.4 and 2.4 µm effective raddi. The model is found to reproduce the observed variations in AOD, Angström exponent and single 20
scattering albedo well at most of the sites (r =0.4 to 0.8). Model results clearly indicate this dust storm significantly influenced the regional radiation budget. The presence of dust aerosols reduced the regional solar radiation reaching the surface by on average −10.1 W m−2 and increased the mean surface long wave radiation by 5.8 W m−2. The influence of dust particles on the top of atmosphere radiation was smaller with regional 25
ACPD
13, 21837–21881, 2013WRF-Chem simulations of a pre-monsoon dust
storm
R. Kumar et al.
Title Page
Abstract Introduction
Conclusions References
Tables Figures
◭ ◮
◭ ◮
Back Close
Full Screen / Esc
Printer-friendly Version Interactive Discussion
Discussion
P
a
per
|
D
iscussion
P
a
per
|
Discussion
P
a
per
|
Discuss
ion
P
a
per
|
The accumulation of dust and black carbon aerosols over the IGP region and Hi-malayan foothills in Northern India during the pre-monsoon season has been sug-gested to have important implications for the onset and advancement of the Indian summer monsoon (e.g. Lau et al., 2006). However, the models generally underesti-mate the AOD in this region and low dust emissions along with uncertainties in anthro-5
pogenic aerosol emissions are suggested to be responsible for this discrepancy (e.g. Cherian et al., 2012; Nair et al., 2012). The AERONET observations based tuning of dust emissions presented in this study could be helpful for future studies focusing on modeling of aerosols in this region. Nevertheless, in situ observations of dust aerosols in the source as well as downwind regions are still highly essential for improving the 10
regional dust emissions further. In addition to aerosol optical properties and radiation budget, dust aerosols can potentially affect tropospheric chemistry and the impact of this dust strom on tropospheric chemistry in Northern India are being analzyed in a fu-ture study.
Acknowledgements. We thank J. F. Lamarque and S. Madronich for their constructive
sugges-15
tions on the manuscript. the principal investigators and their stafffor establishing and maintain-ing 7 AERONET sites used in this study. The datasets of initial and boundary conditions for meteorological fields is downloaded from http://rda.ucar.edu/datasets/ds083.2/. The datasets for initial and boundary conditions for chemical fields, biogenic emissions, biomass burning emissions and programs used to process these datasets are downloaded from the website
20
http://www.acd.ucar.edu/wrf-chem/. We thank the SeaWiFS, MODIS, OMI and CALIPSO sci-ence teams for providing the retrievals. The SeaWiFS, MODIS and OMI satellite products used in this study were acquired using the GES-DISC Interactive Online Visualization and Analysis Infrastructure (Giovanni). The National Center for Atmospheric Research is supported by the National Science Foundation.
ACPD
13, 21837–21881, 2013WRF-Chem simulations of a pre-monsoon dust
storm
R. Kumar et al.
Title Page
Abstract Introduction
Conclusions References
Tables Figures
◭ ◮
◭ ◮
Back Close
Full Screen / Esc
Printer-friendly Version Interactive Discussion
Discussion
P
a
per
|
D
iscussion
P
a
per
|
Discussion
P
a
per
|
Discuss
ion
P
a
per
|
References
Chen, F. and Dudhia, J.: Coupling and advanced land surface hydrology model with the Penn State-NCAR MM5 modeling system, Part I: Model implementation and sensitivity, Mon. Weather Rev., 129, 569–585, 2001.
Cherian, R., Venkataraman, C., Ramachandran, S., Quaas, J., and Kedia, S.: Examination of
5
aerosol distributions and radiative effects over the Bay of Bengal and the Arabian Sea region during ICARB using satellite data and a general circulation model, Atmos. Chem. Phys., 12, 1287–1305, doi:10.5194/acp-12-1287-2012, 2012.
Chin, M., Ginoux, P., Kinne, S., Holben, B. N., Duncan, B. N., Martin, R. V., Logan, J. A., Higurashi, A., and Nakajima, T.: Tropospheric aerosol optical thickness from the GOCART
10
model and comparisons with satellite and sunphotometer measurements, J. Atmos. Sci., 59, 461–483, 2002.
Chinnam, N., Dey, S., Tripathi, S. N., and Sharma, M.: Dust events in Kanpur, northern India: chemical evidence for source and implications to radiative forcing, Geophys. Res. Lett., 33, L08803, doi:10.1029/2005GL025278, 2006.
15
Dentener, F. J., Carmichael, G. R., Zhang, Y., Lelieveld, J., and Crutzen, P. J.: Role of mineral aerosol as a reactive surface in the global troposphere, J. Geophys. Res, 101, 22869–22889, 1996.
Dey, S., Tripathi, S. N., Singh, R. P., and Holben, B. N.: Influence of dust storms on aerosol optical properties over the Indo-Gangetic basin, J. Geophys. Res., 109, D20211,
20
doi:10.1029/2004JD004924, 2004.
Dipu, S., Prabha, T. V., Pandithurai, G., Dudhia, J., Pfister, G., Rajesh, K., and Goswami, B. N.: Impact of elevated dust aerosol layer on the cloud macrophysical properties prior to monsoon onset, Atmos. Environ., 70, 454–467, 2013.
Dubovik, O. and King, M. D.: A flexible inversion algorithm for retrieval of aerosol optical
prop-25
erties from Sun and sky radiance measurements, J. Geophys. Res., 105, 20673–20696, 2000.
El-Askary, H., Gautam, R., Singh, R., and Kafatos, M.: Dust storms detection over the Indo-Gangetic Basin using multi sensor data, Adv. Space Res., 37, 4, 728–733, doi:10.1016/j.asr.2005.03.134, 2006.
30
ACPD
13, 21837–21881, 2013WRF-Chem simulations of a pre-monsoon dust
storm
R. Kumar et al.
Title Page
Abstract Introduction
Conclusions References
Tables Figures
◭ ◮
◭ ◮
Back Close
Full Screen / Esc
Printer-friendly Version Interactive Discussion
Discussion
P
a
per
|
D
iscussion
P
a
per
|
Discussion
P
a
per
|
Discuss
ion
P
a
per
|
Baughcum, S. L., and Kloster, S.: Description and evaluation of the Model for Ozone and Related chemical Tracers, version 4 (MOZART-4), Geosci. Model Dev., 3, 43–67, doi:10.5194/gmd-3-43-2010, 2010.
Fast, J. D, Gustafson Jr., W. I., Easter, R. C., Zaveri, R. A., Barnard, J. C., Chapman, E. G., and Grell, G. A.: Evolution of ozone, particulates, and aerosol direct forcing in an urban area
5
using a new fully-coupled meteorology, chemistry, and aerosol model, J. Geophys. Res., 111, D21305, doi:10.1029/2005JD006721, 2006
Freitas, S. R., Longo, K. M., Chatfield, R., Latham, D., Silva Dias, M. A. F., Andreae, M. O., Prins, E., Santos, J. C., Gielow, R., and Carvalho Jr., J. A.: Including the sub-grid scale plume rise of vegetation fires in low resolution atmospheric transport models, Atmos. Chem.
10
Phys., 7, 3385–3398, doi:10.5194/acp-7-3385-2007, 2007.
Gautam, R., Liu, Z., Singh, R. P., and Hsu, N. C.: Two contrasting dust-dominant periods over India observed from MODIS and CALIPSO data, Geophys. Res. Lett., 36, L06813, doi:10.1029/2008GL036967, 2009.
Ge, J. M., Su, J., Ackerman, T. P., Fu, Q., Huang, J. P., and Shi, J. S.: Dust aerosol optical
15
properties retrieval and radiativeforcing over northwestern China during the 2008 China–US joint field experiment, J. Geophys. Res., 115, D00K12, doi:10.1029/2009JD013263, 2010. Ghude, S. D., Pfister, G. G., Jena, C., van der A, R. J., Emmons, L. K., and Kumar, R: Satellite
constraints of nitrogen oxide (NOx) emissions from India based on OMI observations and WRF-Chem simulations, Geophys. Res. Lett., 40, 423–428, doi:10.1002/grl.50065, 2013.
20
Ginoux, P., Chin, M., Tegen, I., Prospero, J. M., Holben, B., Dubovik, O., and Lin, S. J.: Sources and distributions of dustaerosols simulated with the GOCART model, J. Geophys. Res.-Atmos., 106, 20255–20273, 2001.
Granier, C. Bessagnet, B., Bond, T., D’Angiola, A., van der Gon, H. G., Frost, G. J., Heil, A., Kaiser, J. W., Kinne, S., Klimont, Z., Kloster, S., Lamarque, J.-F., Liousse, C., Masui, T.,
25
Meleux, F., Mieville, A., Ohara, T., Raut, J.-C., Riahi, K., Schultz, M. G., Smith, S. J., Thomp-son, A., van Aardenne, J., van der Werf, G. R., and van Vuuren, D. P.: Evolution of anthro-pogenic and biomass burning emissions of air pollutants at global and regional scales dur-ing the 1980–2010 period, Climate Change, 109, 163–190, doi:10.1007/s10584-011-0154-1, 2011.
30
ACPD
13, 21837–21881, 2013WRF-Chem simulations of a pre-monsoon dust
storm
R. Kumar et al.
Title Page
Abstract Introduction
Conclusions References
Tables Figures
◭ ◮
◭ ◮
Back Close
Full Screen / Esc
Printer-friendly Version Interactive Discussion
Discussion
P
a
per
|
D
iscussion
P
a
per
|
Discussion
P
a
per
|
Discuss
ion
P
a
per
|
Guenther, A., Karl, T., Harley, P., Wiedinmyer, C., Palmer, P. I., and Geron, C.: Estimates of global terrestrial isoprene emissions using MEGAN (Model of Emissions of Gases and Aerosols from Nature), Atmos. Chem. Phys., 6, 3181–3210, doi:10.5194/acp-6-3181-2006, 2006.
Han, X., Zhang, M., Han, Z., Xin, J., and Liu, X.: Simulation of aerosol direct
ra-5
diative forcing with RAMS-CMAQ in East Asia, Atmos. Environ., 45, 6576–6592, doi:10.1016/j.atmosenv.2011.08.006, 2011.
Haywood, J. and Boucher, O.: Estimates of the direct and indirect radiative forcing due to tro-pospheric aerosols: a review, Rev. Geophys., 38, 513–543, 2000.
Hegde, P., Pant, P., Naja, M., Dumka, U. C., and Sagar, R.: South Asian dust episode in
10
June 2006: aerosol observations in the central Himalayas, Geophys. Res. Lett., 34, L23802, doi:10.1029/2007GL030692, 2007.
Holben, B. N., Eck, T. F., Slutsker, I., Tanré, D., Buis, J. P.,Stezer, A., Vermote, E., Reagan, Y., Kaufman, U. J., Nakajima, T., Lavenu, F., Jankowiak, I., and Smirnov, A.: AERONET – a fed-erated instrument network and data archive for aerosol characterization, Remote Sens.
En-15
viron., 66, 1–16, 1998.
Hsu, N. C., Tsay, S. C., King, M. D., and Herman, J. R.: Aerosol properties over bright-reflecting source regions, IEEE Trans. Geosci. Remote Sens., 42, 557–569, doi:10.1109/TGRS.2004.824067, 2004.
Huneeus, N., Schulz, M., Balkanski, Y., Griesfeller, J., Prospero, J., Kinne, S., Bauer, S.,
20
Boucher, O., Chin, M., Dentener, F., Diehl, T., Easter, R., Fillmore, D., Ghan, S., Ginoux, P., Grini, A., Horowitz, L., Koch, D., Krol, M. C., Landing, W., Liu, X., Mahowald, N., Miller, R., Morcrette, J.-J., Myhre, G., Penner, J., Perlwitz, J., Stier, P., Takemura, T., and Zender, C. S.: Global dust model intercomparison in AeroCom phase I, Atmos. Chem. Phys., 11, 7781– 7816, doi:10.5194/acp-11-7781-2011, 2011.
25
Janjic, Z. I.: The surface layer in the NCEP Eta Model, Eleventh Conference on Numerical Weather Prediction, Norfolk, VA, 19–23 August, Amer. Meteor. Soc., Boston, Boston, MA, 354–355, 1996.
Janjic, Z. I.: Nonsingular Implementation of the Mellor-Yamada Level 2.5 Scheme in the NCEP Meso model, NCEP Office Note, 437, 61 pp., 2002.
30