www.atmos-chem-phys.net/10/5859/2010/ doi:10.5194/acp-10-5859-2010
© Author(s) 2010. CC Attribution 3.0 License.
Chemistry
and Physics
Aerosol optical properties and radiative forcing in the high
Himalaya based on measurements at the Nepal Climate
Observatory-Pyramid site (5079 m a.s.l.)
S. Marcq1, P. Laj1, J. C. Roger2, P. Villani1, K. Sellegri2, P. Bonasoni3, A. Marinoni3, P. Cristofanelli3, G. P. Verza4, and M. Bergin5
1Laboratoire de Glaciologie et G´eophysique de l’Environnement (LGGE), CNRS/University of Grenoble, Grenoble, France 2Laboratoire de M´et´eorologie Physique, CNRS/University of Clermont-Ferrand, Clermont-Ferrand, France
3Institute for Atmospheric Science and Climate (ISAC), CNR, Bologna, Italy 4Ev-K2-CNR Committee, Bergamo, Italy
5Georgia Institute of Technology, Civil and Environmental Engineering, Atlanta, USA
Received: 2 February 2010 – Published in Atmos. Chem. Phys. Discuss.: 26 February 2010 Revised: 11 May 2010 – Accepted: 9 June 2010 – Published: 2 July 2010
Abstract. Intense anthropogenic emissions over the In-dian sub-continent lead to the formation of layers of par-ticulate pollution that can be transported to the high alti-tude regions of the Himalaya-Hindu-Kush (HKH). Aerosol particles contain a substantial fraction of strongly absorb-ing material, includabsorb-ing black carbon (BC), organic com-pounds (OC), and dust all of which can contribute to atmo-spheric warming, in addition to greenhouse gases. Using a 3-year record of continuous measurements of aerosol optical properties, we present a time series of key climate relevant aerosol properties including the aerosol absorption (σap)and
scattering (σsp)coefficients as well as the single-scattering
albedo (w0). Results of this investigation show
substan-tial seasonal variability of these properties, with long range transport during the pre- and post-monsoon seasons and effi-cient precipitation scavenging of aerosol particles during the monsoon season. The monthly averaged scattering coeffi-cients range from 0.1 Mm−1 (monsoon) to 20 Mm−1 while the average absorption coefficients range from 0.5 Mm−1to 3.5 Mm−1. Both have their maximum values during the
pre-monsoon period (April) and reach a minimum during Mon-soon (July–August). This leads to dryw0values from 0.86
(pre-monsoon) to 0.79 (monsoon) seasons. Significant di-urnal variability due to valley wind circulation is also re-ported. Using aerosol optical depth (AOD) measurements,
Correspondence to:P. Laj
(laj@lgge.obs.ujf-grenoble.fr)
we calculated the resulting direct local radiative forcing due to aerosols for selected air mass cases. We found that the presence of absorbing particulate material can locally induce an additional top of the atmosphere (TOA) forcing of 10 to 20 W m−2 for the first atmospheric layer (500 m above
sur-face). The TOA positive forcing depends on the presence of snow at the surface, and takes place preferentially during episodes of regional pollution occurring on a very regular basis in the Himalayan valleys. Warming of the first atmo-spheric layer is paralleled by a substantial decrease of the amount of radiation reaching the surface. The surface forcing is estimated to range from−4 to−20 W m−2for small-scale
regional pollution events and large-scale pollution events, re-spectively. The calculated surface forcing is also very depen-dent on surface albedo, with maximum values occurring over a snow-covered surface. Overall, this work presents the first estimates of aerosol direct radiative forcing over the high Hi-malaya based on in-situ aerosol measurements, and results suggest a TOA forcing significantly greater than the IPCC reported values for green house gases.
1 Introduction
properties of clouds (the “indirect effects”) through their role as cloud condensation nuclei (CCN) and/or ice nuclei (IN). Current global mean estimates of direct anthropogenic aerosol radiative forcing (RF) at top of atmosphere (TOA) range from−0.63 to+0.04 W m−2(IPCC, 2007). The mean
value is significantly smaller than total greenhouse gas forc-ing of+2.9 W m−2but the comparison of global average
val-ues does not take into account immense regional variability. This is particularly true over Asia where anthropogenic emissions from industry, transport and incomplete fossil fuel combustion are rapidly rising (Richter et al., 2008), in par-ticular in China and India. Intense emission of particulate matter at the surface increased by formation of secondary particles formed by condensation of gases leads to the for-mation of layers of particulate pollution as recently discussed by Ramanathan and Carmichael (2008). These layers of par-ticulate pollution that can be observed also from satellites are often referred to the brown cloud (Lelieveld et al., 2001; Nakajima et al., 2007; Ramanathan et al., 2007a, b). The brown cloud refers to the ability of aerosols, such as black carbon from combustion processes, to not only scatter but also absorb solar radiation. Absorbing aerosols such as dust and black carbon (BC) and, to a lesser extent, brown carbon, which originate from incomplete combustion of fossil fuel or bio-fuel, can effectively absorb solar radiation and enhance atmospheric solar heating (Bond and Sun, 2005), and may contribute to atmospheric warming, in particular over world regions with intense anthropogenic emissions such as India. The Intergovernmental Panel on Climate Change (2007) rec-ognizes BC as responsible for a global heating of approx-imately +0.5 W m2, thus comparable to that of methane, which is the second most important next to CO2. Aerosol
optical depth (AOD) in visible wavelengths measured over the most polluted regions in India ranges between 0.4 and 0.7 as compared to much lower AODs of 0.05 found in un-polluted air over the Indian Ocean (Welton et al., 2002). Ac-cording to Ramanathan et al. (2005), absorbing aerosols over India have masked as much as 50% of the surface warming due to the global increase in greenhouse gases (GHG). Atmo-spheric forcing caused by the aerosol layer ranging from+10 to+20 W m−2are calculated for the Indian subcontinent, in
particular during the dry winter period (January–April). Work performed within the INDian Ocean Experiment (INDOEX) also has revealed that this haze layer can be effi-ciently transported far beyond the source region, particularly during December to April and detected all over the Indian sub-continent (Clarke et al., 2002). Due to general circu-lation patterns, the Himalayan area is a strong receptor of the Indian/Pakistan source area. Atmospheric aerosols com-posed mainly of dust and black carbon from regional emis-sions, builds up over the Indo-Gangetic Plain, and is lifted up by the Himalaya orography. Lau and Kim (2006) sug-gest that absorbing aerosols in the elevated regions of Hindi-Kush-Himalaya HKH heat the mid-troposphere by absorbing solar radiation. Heating produces an atmospheric dynamical
feedback – the so-called elevated-heat-pump (EHP) effect re-sulting in increased precipitation over much of India.
Transport of optically active material to the very sensitive regions of the Himalayas is therefore a key issue to improve the description of the BC effect on Indian Summer Monsoon and, in particular, its impact on precipitation in the HKH re-gions and therefore on frozen water storage. In fact, BC not only affects the energy budget of the atmosphere, but de-posits to snow surfaces, absorbs light, thus decreasing the albedo of the snow and modifying the energy budget of snow surfaces (Flanner et al., 2009 and 2007). Flanner et al. (2007) determined that the addition of 500 ppb (by weight) of black carbon to snow decreased its visible albedo from 0.98 to 0.88, and calculated that the instantaneous forcing over the Tibetan Plateau, due to the presence of BC in snow, exceeds 20 W m−2 in some places confirming that snow darkening
is an important component of carbon aerosol climate forc-ing. This in turn affects snow melt, the duration of the snow cover and the seasonal availability of water. Predicting the effect of atmospheric aerosol loading on snow optical prop-erties and energy budget is therefore essential to relate atmo-spheric aerosol loading and the seasonality of water flow.
The issue of the impact of optically active particulate mat-ter on the local energy budget in the Himalaya has been put forward by recent observations showing that pollution aerosol from India and Pakistan can be transported by moun-tain breezes up to the high altitude (Carrico et al., 2003; Ramanathan et al., 2007; Bonasoni et al., 2008; Venzac et al., 2008; Komppula et al., 2009). Measurements of aerosol chemical composition and aerosol optical depth in the Nepal Himalaya have clearly shown the build up of aerosols in the pre-monsoon season during the winter and early spring, with relatively high values of light absorbing particulate matter including dust and black carbon (Carrico et al., 2003). Very recently, new insight into the mechanisms of aerosol trans-port from dust and pollutions sources in central and south-eastern Asia to the Tibetan and Himalayan regions was also provided by Huang et al., 2007 and Ramanathan et al., 2007. These studies indicate that aerosol in-situ and columnar con-centrations over the south slope of Himalayas are strongly affected by the development of the boundary layer, responsi-ble for transporting pollution aerosols upward, contributing to changes in solar irradiance (Dumka et al., 2006; Dumka et al., 2008; Ramachandran, 2008). Assessing the impact of aerosol particle on the local energy balance in the high alti-tude regions of Himalayas is therefore of importance for the whole area of HKH regions.
(Carrico et al., 2003; Pant et al., 2006; Dumka et al., 2006) but are often related to more populated areas. The only long-term study (1.5 y) of aerosol composition and optical proper-ties in the Higher Himalayas was that of Carrico et al. (2003), conducted at Langtang (3920 m a.s.l.) at an altitude still be-low the ice front of glaciers. This study showed elevated concentrations of PM2.5especially during the February–May
season (59±61 µg/m3) paralleled with substantial extinction
(aerosol optical depth δ500 nm=0.37±0.25) with a
domi-nance of both organic and elemental carbon from combus-tions sources as well as elements associated with dust emis-sion. Additional measurements recently reported by Komp-pula et al., 2009, Hyvarinen et al., 2009, Kivek¨as et al., 2009 for research stations located in India (Mukteshwar, 2180 m) and China (Mt. Waliguan, 3816 m) confirmed presence of el-evated concentration of particles lifted up to high altitude by both local wind dynamics and regional/long range transport. Hyvarinen et al. (2009) focussed more specifically on the op-tical properties of particles at Mukteshwar station showing strong seasonal dependence of aerosol concentration and av-erage value of the measured single scattering albedo of 0.81 at 525 nm, indicative of presence of substantial amount of absorbing material.
Recent work by Bonasoni et al. (2008) and Venzac et al. (2008) confirmed that pollution episodes are detected even further up in the glacierized area of Nepal, using measurements performed at the newly built Nepal Climate Observatory-Pyramid station (5100 m a.s.l.). In this paper we present observations of aerosol optical properties from NCO-P (Nepal Climate Observatory-NCO-Pyramid) with a 3-year ob-servational record of aerosol light absorption and scattering coefficients, as well as aerosol optical depth (AOD). The ob-jective is to determine the variability of aerosol optical prop-erties in relation to air mass origins, and to derive statistically relevant information to describe the most common conditions observed at NCO-P. In addition, observed values of the scat-tering and absorption coefficient combined with the Aerosol Optical Depth (AOD) are used to estimate the direct aerosol radiative forcing for the region.
2 Site and instruments description
The Nepal Climate Observatory-Pyramid (NCO-P) station has been installed in March 2006 as part of Ev-K2-CNR “SHARE-Asia” (Stations at High Altitude for Research on the Environment) and UNEP “ABC” (Atmospheric Brown Clouds) projects. The station is located in the southern Hi-malayan region at the confluence of the secondary valley of Lobuche (oriented NNW-SSE) and the main Khumbu valley, on the top of a hill close (200 m distance and 100 m above) the ABC-Pyramid Observatory (Nepal, 27.95 N, 86.82 E, 5079 m a.s.l.). The nearest village from the station is Lobuche, a small village (100 inhabitants, 4850 m) located 5 km away. The largest village in the Valley is
Namche-Bazar (1000 inhabitants, 3440 m) located 25 km away. The Pyramid station is occupied year-round by station personnel but emissions are extremely reduced as power is mostly pro-duced by photovoltaic cells. We can therefore exclude any artefact from local contamination in the measurement record. A complete description of the station can be found in Bona-soni et al. (2008) and BonaBona-soni et al. (2010).
The station was equipped to perform continuous measure-ments of chemical (organic and inorganic, soluble and in-soluble), physical (mass and number size distribution) and optical (absorption and scattering coefficients) properties of aerosol. Surface O3 and climate altering halocarbon
con-centrations are also measured at ABC-Pyramid. Aerosol sun photometry studies are carried out as well within the AERONET (AErosol RObotic NETwork) program (Holben et al., 1998). In the present paper, we will focus on optical aerosol properties derived from integrating nephelometer and absorption photometers with a data record extending from March 2006 up to March 2009.
Aerosol total and back scattering coefficients at three wavelengths (450, 550 and 700 nm) are derived by an inte-grating nephelometer (model TSI 3563), installed in March 2006. A PM2.5 cyclone before entering the nephelometer
limits sampling to aerosol particles with aerodynamic diam-eter less than 2.5 µm. We have followed operating proce-dures described in Anderson and Ogren (1998) in particular for calibration procedures and corrections for truncation er-rors. One limitation, however, was that CO2calibration
pro-cedures could only be performed once/year during the yearly mission of expert personnel from France and Italy. Relative humidity in the Nephelometer never exceeded 30% even dur-ing Monsoon periods thus not affectdur-ing the scatterdur-ing coeffi-cient (Fierz-Schmidhauser et al., 2010). Measurements are performed at 30 l min−1 with a time integration of 5 min, averaged every hour. Over the course of the 3-year period, a number of problems limited the measurement record to the following periods: from 1 November 2006 to 10 Febru-ary 2007, from 10 December 2007 to 20 FebruFebru-ary2008 and from 15 November2008 up to the end of the measurement record used in this study (March, 2009). In fact, instrument failures occurred during the autumn and could not be fixed until late winter of the following year.
The aerosol light absorption at 670 nm was measured with a Multi-Angle Absorption Photometer (MAAP 5012, Thermo Electron Corporation). Measurements are per-formed below a PM10 inlet with a time-integration of 5 min
and are averaged every hour. Black carbon concentrations are calculated using a mass absorption coefficient of 6.6 gm−2
as recommended by Petzold and Sch¨onlinner (2004). Addi-tional information on MAAP measurements, calibration pro-cedures and comparisons with Elemental Carbon EC mea-surements are provided by Marinoni et al. (2010).
Overall, concurrent measurements of absorption and scat-tering coefficients (σapandσsp, respectively) are available for
seasons are not evenly sampled due to nephelometer fail-ures with a majority of concurrent absorption/scattering co-efficient samples during the post-Monsoon season (Octo-ber/November) and the pre-Monsoon and Monsoon seasons (April/May and June/September) while limited information is available for winter season (December/February).
Overall, the 3-year record consists of slightly less than 20 000 concurrent hours of measurements for σap andσsp
representing more approximately 75% of the maximum sam-pling time available. Due to nephelometer failures encoun-tered predominantly during the winter period, sampling has been performed mostly during Pre-, post-, and Monsoon pe-riods. In fact, the number of points available during the win-ter season has been considered too low to be included in data reduction of the present paper. The entire available record has been used to calculate diurnal and seasonal variations. The number of observations used to derive average infor-mation for specific conditions of air masses encountered at NCO-P is a sub-sample of the entire record.
In addition, we have used in this paper, measurements from a Cimel CE 318 sun photometer. It is an automatic sun-tracking and sky radiometer for measuring the aerosol optical depth at 8 wavelengths between 340 and 1020 nm. This instrument is part of the AERONET project, registered as number 367. Both sun photometer data and specifica-tions can be downloaded from the AERONET web site (http: //aeronet.gsfc.nasa.gov, station EVK2-CNR). See Gobbi et al. (2010) for further information. Determination of aerosol properties is completed by a Scanning Mobility Particle Sizer (SMPS) measuring aerosol number concentration and size from 15 to 500 nm in diameter. The description of the SMPS system can be found in Villani et al. (2007)
Finally, all meteorological information are derived from a Vaisala WXT510 meteorological unit, measuring temper-ature, pressure, relative humidity, rain, wind intensity and direction. All measurements presented in this paper are available at the following url (http://www.rrcap.unep.org/ abc/data/abc/ncop.html). It should be noted that data used in this paper have been manually checked and in the case of a doubt concerning data quality removed through an analysis of consistency with the other data.
3 Synoptic and local meteorology and air mass classification
Synoptic meteorology of the Khumbu Valley area is dis-cussed by Bonasoni et al. (2010). For the purpose of the present paper, we can summarize synoptic meteorology at NCO-P as follows: (1) Four seasons are identified thereafter defined as pre-Monsoon season (March to May), Monsoon season (June to September), post-Monsoon season (October to November) and winter season (December to February), (2) Origin of air masses during all seasons is predominantly from the West, over Middle East/central Asia, except during
Mon-soon season for which a transport from the South is domi-nant. Bonasoni et al. (2010) discussed the air mass classifica-tion at NCO-P using a hierarchical cluster analysis to group the trajectories into clusters. They identified 3 main clusters corresponding to (1) SW south-westerly (SW-AP: Arabian Peninsula, SW-AS: Arabian Sea, SW-BG: Bengal Gulf); (2) W westerly (W-NA: North Africa, W-EU: Europe, W-ME: Middle East) and REG regional.
In addition to synoptic scale meteorology, NCO-P is un-der the influence of orographic induced local circulation. The most common pattern is characterized by upslope wind bringing the air masses from the low-altitude Nepal plains during the afternoon. Opposite during night-time and morn-ing hours, with down-slope wind brmorn-ingmorn-ing the air aloft from the free troposphere to the station. The local wind-slope sys-tem weakens during the monsoon season. Most atmospheric signals measured at NCO-P are strongly influenced by slope winds. In particular, the diurnal variation of anthropogenic species such as BC regularly exhibits very low night-time concentrations and daytime values peaking in the middle of the afternoon. Consequences of local circulation on aerosol dynamics are discussed by Venzac et al. (2008) and Panday et al. (2009). Local circulation is not considered in the cluster analysis of Bonasoni et al. (2010).
As will be discussed later, both large scale transport and local meteorology influence the atmospheric signals at NCO-P. However, the variability of aerosol optical properties does not appear to be linked to back-trajectories using cluster clas-sification defined by Bonasoni et al. (2010). Therefore, in this paper, we have not based data reduction on air-mass backtrajectory analyses. Instead, it is observed that the vari-ability of σap andσsp is primarily driven by both synoptic scale meteorology (seasonal dependency) and local scale dy-namics. The data reduction process has therefore been done with the following distinctions:
1. Background periods (BG) corresponding to air flowing from the Tibetan plateau and characterized by very low concentration values. BG samples are selected on the basis of the local dynamics when wind flows from<90◦ and>270◦at NCO-P, and restricted to early morning periods (5 a.m.–9 a.m. (local time)). Night-time sam-ples were not considered to avoid artefact by recir-culation of pollutants emitted the night before, which spend the night in elevated layers over the valley. Over the duration of the entire record, data sampled during background periods represent about 2000 h of measure-ments (approximately 60% of the maximum sampling time available in the period). BG samples are predomi-nantly available for Pre-Monsoon period (48% of obser-vations) as respect to both Monsoon and post-Monsoon periods (33% and 18%, respectively).
mentioned before, these conditions are driven by the timing of thermal-induced ventilation from the valley showing strong day-to-day similarity, with a strong westerly wind blowing through the valley from late morning until dusk. The timing of the up-slope flow ini-tiation depends on the seasons but takes place at NCO-P between 9 am and 11 am. In order to avoid sampling BG air, RP samples are selected with wind flows be-tween 90 ˚ and 270 ˚ and restricted to afternoon periods (3 p.m.–6 a.m. (local time)). Overall, RP samples repre-sent approximately 1600 h of measurement and 65% of the maximum sampling time available. As for BG sam-ples, RP samples are predominantly from Pre-Monsoon periods.
3. In addition to BG and RP samples, we have defined samples called “Special Events (SE)”. Special events characterize situations of long-range transport of pol-lution not necessarily linked to mountain breeze and identified based on scattering and/or absorption coef-ficient afternoon values larger than twice the median coefficients for afternoon periods in the same season and corresponding to elevated concentrations of parti-cles (from SMPS measurements), BC (from MAAP) and PM1, PM2.5and PM10 (from GRIMM) as respect
to typical average values for the season.
Over the 3-year record, we have identified 32 SE events representing almost 1600 h of measurements, mostly from pre-Monsoon period (11 events but 53% of the measure-ments). Overall, we believe both the analysis of seasonal and diurnal variations and the derivation of average values for representative conditions at NCO-P is based on a very repre-sentative number of samples. In addition, no sampling bias is affecting the data set besides the fact that the winter season is not considered in the study. In any case, it represents the longest record available of aerosol optical properties for this area of the globe.
4 Seasonal and diurnal variations of scattering,σsp,
and absorption,σap, coefficients and single-scattering
albedo,w0
4.1 Seasonal variations of measured properties
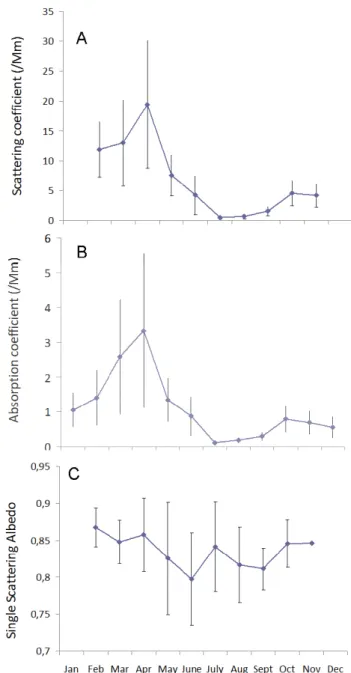
Monthly averaged scattering (σsp)and absorption (σap)
co-efficients over the course of the record are – provided in Fig. 1a and b. They are provided at 700 nm and 670 nm, re-spectively with their mean and standard deviation. We chose to presentσsp at 700 nm only because this wavelength was used to calculate the dry single scattering albedo (w0). The
good correlation between EC and BC shown in Marinoni et al. (2010) and Decesari et al. (2010) at the NCO-P site shows that light absorption is dominated by carbonaceous material which is predominantly in the sub-micron fraction. The use
Fig. 1. Monthly averaged values of scattering coefficient(A),
ab-sorption coefficient(B)and single scattering albedo(C)measured at NCO-P. Error bars correspond to±1 standard deviation.
of different cut-size for Nephelometer and MAAP inlets will therefore not affectw0values. For reasons explained above,
scattering coefficients for December and January are not pro-vided.
The average scattering coefficient (not corrected for pres-sure) at the site is 6.3±10.7 Mm−1, that includes
rela-tively high σsp values during the pre-Monsoon periods
(19.4±21.2 Mm−1 in March) as well as lowσ
sp values for
0 5 10 15 20 25 30
0 4 8 12 16 20
Time of day (h)
S
catter
ing
Coeff.
(M
m
-1)
Pre-Monsoon
0
0 0
0,5 1 1,5 2 2,5 3 3,5
0 4 8 12 16 20
Time of day (h)
S
catter
ing
Coeff.
(M
m
-1)
Monsoon
0 0
2 4 6 8 10 12
0 4 8 12 16 20
Time of day (h)
S
catte
ri
ng Coeff.
(M
m
-1)
Post-Monsoon
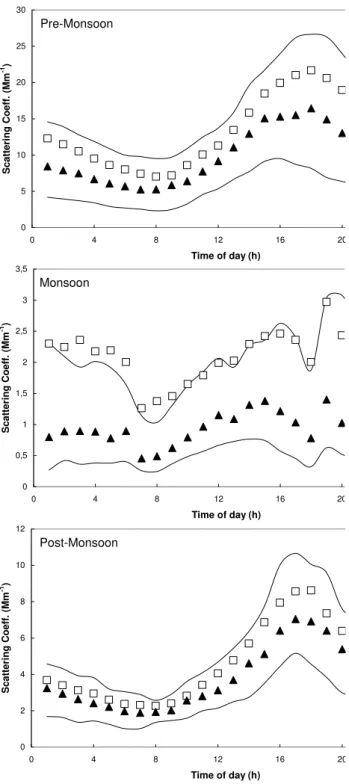
Fig. 2.Diurnal variability of hourly averaged (squares) and median
(triangle) scattering coefficient values at NCO-P for pre-monsoon, monsoon and post-monsoon periods. Dashed lines represent 25 and 75-percentile, respectively.
These summer-Monsoon values are even lower than those observed at other remote sites such as Mauna Loa, Cape Grim, South Pole or Barrow where σsp ranges from 5 to
10 Mm−1(these measurements are at 550 nm and for a size
cut of Dp<1 mm at RH <40%) (Ogren, 1995; Carrico et al., 1998, 2000; Koloutsou-Vakakis et al., 2001; Delene and Ogren, 2002). The seasonal variations ofσspreflect a feature already observed for other aerosol variables at NCO-P and in the Himalaya with elevated concentrations during winter and pre-Monsoon seasons and much lower concentrations found during the Monsoon season (Carrico et al., 2003; Bonasoni et al., 2008, Venzac et al., 2009). This is to be compared to measurements performed at the altitude site of Mukteshwar station in India where much larger values ofσsp are found
closer to the source areas for both Monsoon and pre/post Monsoon seasons. Variations ofσapclosely follow those of
σspwith average annual value of 1.1±2.1 Mm−1and maxima
during pre-Monsoon periods (3.4±4.4 Mm−1 in April) and
minima during Monsoon season (0.3±0.2 Mm−1in July).
This obviously reflects wet scavenging of the aerosol compo-nent during the Monsoon season and stronger influence of air masses originating from Nepal and Indian plains during the pre-Monsoon seasons (Panday et al., 2009). As forσsp, data can be compared to measurements performed at Mukteshwar station showing highest σap in April (23.2 Mm−1) and the lowest one (4.5 Mm−1)in August. Here again, distance from the strong Indian emission areas and high altitude explains differences between NCO-P and Mukteshwar stations.
Monthly averaged dry w0 values are derived from σap
(670 nm) andσsp(700 nm) and gange from 0.80 (in July) to
0.87 (in February) as shown in Fig. 1c. These variations re-flect a higher proportion of absorbing material during the Monsoon that can either be related to preferential scaveng-ing of more hygroscopic aerosol particles, such as sulphate and/or nitrate, or due to less-hygroscopic absorbing organic and BC material. It can also reflect changing emission source areas from long range transport of material from western re-gions of India and Pakistan in winter to more direct emissions from Indian and Nepal plains during Monsoon (summer) sea-son (Bonasea-soni et al., 2010). Very loww0values (as low as
∼0.75) have been measured by several authors within the boundary layer in India (Ramanathan et al., 2001) and also at the Mukteshwar station wherew0 at 525 nm range from
0.74 to 0.85. Our study therefore adds additional evidence that strongly absorbing particles are efficiently transported to the high remote Himalaya regions.
4.2 Diurnal variations of measured properties
The variability of the monthly-averaged optical properties is very strongly influenced not only by day-to-day changes but rather by significant diurnal variation. As discussed before, daily variations originate from thermal winds developing in the valley during the day. Both σap and σsp are strongly
dependent upon local wind circulation with very low val-ues during the night and increase upon wind-shift in the late morning. Hourly averagedσsp for pre-Monsoon, Monsoon
Diurnal variations show two distinct periods with low val-ues in the early morning (1 a.m. to 11 a.m.) followed by strong increase associated with up-slope wind conditions from 11:00 on to evening hours). Diurnal variations are well pronounced during pre-Monsoon and post Monsoon seasons with up to a 3-fold increase in the mid-afternoon as respect to early morning values. On the contrary, the diurnal signal during the Monsoon season is rather weak, reflecting limited thermal wind circulation and/or scavenging process.
Scattering coefficient values in free tropospheric air sam-pled in the early morning at NCO-P typically range from 2 to 5 Mm−1 depending on the season. This is close to
values measured in remote areas (Clarke, 1989). The free-tropospheric air flowing from the Tibetan plateau at night is extremely clean and does not show any influence of emission in Southern China. During afternoon hours, averaged val-ues ofσsp typically range between 10 and 20 Mm−1during
pre-Monsoon and post-Monsoon seasons, slightly less than 5 Mm−1 during Monsoon season. Upslope winds transport primary and secondary particles from the Nepal and Indian plains from more than 100 km away to the high altitude re-gions of Himalayas. Emission sources are likely linked to biofuel combustion sources as shown by the elevated levels of organic material measured in the particulate phase (Dece-sari et al., 2010).
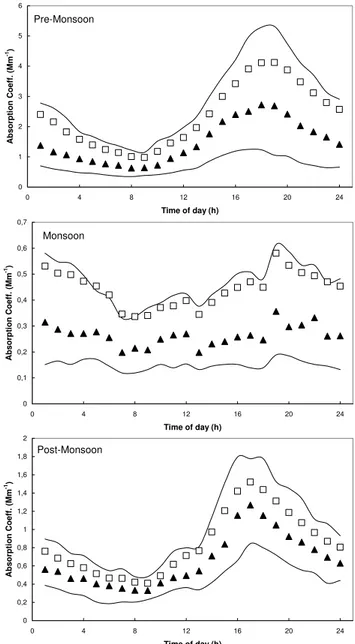
Very similar diurnal variations are observed for the ab-sorption coefficient, ranging from 0.4 Mm−1in the morning
for Monsoon periods to 4 Mm−1 in the afternoon for
pre-Monsoon periods – see Fig. 3. Seasonal changes of the diur-nal variation also show the strong influence of wet scaveng-ing with very limited increase durscaveng-ing the afternoon. Bothσsp
andσapdiurnal variations are in strong agreement with those measured by independent particle instruments at NCO-P.
Instead, diurnal variations of the single scattering albedo are not so well pronounced (see Fig. 4). During pre-Monsoon periods,w0shows a maximum (0.87) in the morning hours
in correspondence with the nucleation peak seen by Venzac et al. (2008). Although scattering intensity by small parti-cle is limited, presence of elevated levels of non-absorbing 20–40 nm particles might explain thew0increase. Thew0
then steadily decreases throughout the day reaching mini-mum values below 0.84 in the evening. Presence of a higher fraction of absorbing material in aerosol is likely due com-bustion aerosol in regionally-transported air masses. Resid-ual layers from regional pollution seem to stay up until the evening although wind direction already shifted northwards. Daily variability during other seasons is less clear. Dur-ing the Monsoon season, high humidity durDur-ing the afternoon may be responsible for higher scattering (thus higher single scattering albedos). Relative humidity in the nephelometer is not controlled and scattering may be increased by hygro-scopic growth of soluble particles. Lowestw0values (0.82)
are found during the evening period as well, possibly ex-plained by preferential scavenging of soluble material before reaching the high altitude and consequent enrichment in
wa-0 1 2 3 4 5 6
0 4 8 12 16 20 2
Time of day (h)
Ab
sor
p
ti
on Coeff.
(M
m
-1)
Pre-Monsoon
4
0 0,1 0,2 0,3 0,4 0,5 0,6 0,7
0 4 8 12 16 20 24
Time of day (h)
Absor
p
ti
on Coeff.
(Mm
-1)
Monsoon
0 0,2 0,4 0,6 0,8 1 1,2 1,4 1,6 1,8 2
0 4 8 12 16 20 24
Time of day (h)
Ab
sor
p
ti
on Coeff.
(M
m
-1)
Post-Monsoon
Fig. 3.Diurnal variability of hourly averaged (square) and median
(triangle) absorption coefficient values at NCO-P for pre-monsoon, monsoon and post-monsoon periods. Dashed lines represent 25 and 75-percentile, respectively.
ter insoluble BC fraction. During post-Monsoon season,w0
varies from 0.84 to 0.86, with maximum values in the morn-ing hours. The daily variability is however very limited.
Table 1.Averaged aerosol optical properties found in the 3 types of events for each considered season excluding winter season.
Season Event type σscatt σabs AOD 550 nm particles number w0 asymmetry
(Mm−1) (Mm−1) (D >10 nm) factorg
(cm−3)
f Monsoon
BG 0.7±0.8 0.2±0.2 0.031±0.000 384±189 0.76 0.68
RP 1.3±2.2 0.3±0.4 0.043±0.010 546±389 0.81 0.68
SE 8.3±9.3 1.2±1.1 0.077±0.015 839±191 0.88 0.65
Post-Monsoon
BG 2.3±1.9 0.4±0.3 0.008±0.000 728±272 0.85 0.71
RP 7.0±5.6 1.2±0.9 0.023±0.015 1127±624 0.85 0.74 SE 14.4±6.1 2.8±1.0 0.098±0.027 1479±436 0.84 0.63
Pre-Monsoon
BG 5.9±4.6 0.8±0.6 0.010±0.000 656±269 0.89 0.78
RP 12.9±9.3 2.3±2.3 0.025±0.015 1194±672 0.84 0.75 SE 36.2±27.9 7.8±6.0 0.093±0.035 2810±1252 0.82 0.70
Tibet. Chemical analysis and analysis of BC/PM1variability
seem to support the later hypothesis (Decesari et al., 2010; Marinoni et al., 2010).
The difference between median and meanw0is substantial during the Monsoon season while very similar (albeit slightly negative – meanw0<medianw0). Both preferential scav-enging of non-absorbing aerosols and the presence of rela-tively frequent episodes of long-range pollution may explain these findings.
4.3 Aerosol properties according to air masses
As mentioned previously, both seasonal and diurnal vari-ations of aerosol optical properties appear to be strongly linked to: (1) wet removal during the Monsoon season low-ering particle concentration and, thus, scattlow-ering and absorp-tion coefficients, and (2) thermal wind development during the day explaining much of the daily variability of almost all aerosol parameters. Instead, origin of 5-day air mass back-trajectories cannot be used to explain the observed variabil-ity. In the following, we have, therefore, derived averaged values of optical properties using the classification proposed in Sect. 3, i.e. splitting between Background (BG), Regional Pollution (RP) and Special Events (SE). As mentioned ear-lier, BG and RP samples are restricted to very specific time periods during a typical day at NCO-P (5 a.m. to 9 a.m. for BG and 3 p.m.–6 p.m. for RP). The distinction between BG and RP on one hand, and special events on the other is instead made on a case-by-case basis after reviewing the data. The strong influence of SEs can be seen in both Figs. 2 and 3 by the substantial difference between median and averagedσsp
andσapin the record. SE events occur regularly, limit
diur-nal variability and are characterized by significant increases in BC, O3 and particle Number concentrations for several
days in a row.
Aerosol optical depth derived in Table 1 only used the fine fraction component of AOD to limit artefacts due to el-evated clouds and high humidity, as recommended by Gobbi
et al. (2010). There are substantial differences between the 3 air mass types in addition to the seasonal dependence within each air mass type. Clearly, SE show very different values as respect to both BG and RP air masses. This is seen for all other parameters related to optical and chemical proper-ties. Special events are characterized by large scale changes as discussed by Bonasoni et al. (2010). However, it should be noted that day/night variability still exist during SEs but, contrary to RPs, nightime is not characterized by low PM concentrations. Absorption and scattering coefficients, how-ever, can reach much higher values with respect to both BG and RP, such as other aerosol variables. There are no clear trends inw0related to SE. While SE during Monsoon shows relatively highw0(0.88), absorption is relatively higher dur-ing pre-and post- Monsoon SEs (0.82 and 0.84, respectively). The very high values ofσsp(36±26 Mm−1) are comparable
to, for example, those observed (at 550 nm) in North Amer-ican or European sub-urban areas like Bondville, IL, south-ern Great Plains, OK, Sable Island, NS, and Sagres, Portu-gal where values of 30–50 Mm−1are reported (Delenne and Ogren, 2002; Carrico et al., 2000); which also corresponds to measurements by Hyv¨arinen et al. (2009) at the Mukteshwar station much closer to emission sources.
Single scattering albedow0during pre and post-Monsoon
seasons vary from 0.84 to 0.89 for RP events and from 0.89 to 0.83 for BG events. This opposite behaviour is difficult to explain. Similar changes in w0 are measured at
average presented by Decesari et al. (2010). The very loww0
measured during the Monsoon season BGs is however diffi-cult to compare with filters due to the very limited number of filters collected under these conditions.
5 Direct aerosol radiative forcing estimation
5.1 Model description
Data from Table 1 are used to derive the local aerosol ra-diative forcing for different air mass origins. It should be noted that we applied correction procedures recommended by Nessler (2005a and b) to scattering coefficients to ac-count for high relative humidity (RH) at the station espe-cially during the Monsoon season (mean RH above 90%). No correction is applied to absorption coefficient, thus con-sidering BC mostly hydrophobic. To derive the local direct aerosol forcing, we have used the GAME code (Global At-mospheric ModEl code; Dubuisson et al., 1996) set in the configuration described in Roger et al. (2006). The absorp-tion is based on the results of a line by line code (Scott, 1974) and includes the gas-phase absorbers in the short-wave re-gion. The multiple scattering effects are treated using the Discrete Ordinates Method (DOM) (Stamnes et al., 1988) following the plane-parallel approximation. The DOM em-ploys a Legendre polynomial decomposition for the phase function and the radiance. Interactions between multiple scattering and gaseous absorption are accurately treated us-ing the correlated-k method (Lacis and Oinas, 1991). The GAME code takes into account the surface albedo as well as the asymmetry factor (given in Table 1) calculated using the method described in Marshall et al. (1995).
For computations, the GAME code divides the atmosphere into several layers. For this study, we have made the follow-ing hypotheses: (1) Above 9000 m a.s.l. the atmosphere is divided into several layers, which optical properties remain constant. We have used the global standard properties for this altitude (Hess et al., 1988). (2) the atmosphere between 5000 m a.s.l. and 9000 m a.s.l. is divided into eight uniform 500 m-thick layers. Aerosol intensive properties within each layer are originally derived from surface measurements with different degree of mixing with typical free tropospheric air. Layer 1 (5000 m a.s.l. to 5500 m a.s.l.) is the polluted layer for which optical aerosol properties are given by the direct measurements at NCO-P. The thickness of the layer is de-rived from modelling studies of thermal wind developments in the Alps, showing a thermal wind depth of a few hundred meters (Henne et al., 2005). Layers 2 to 5 (5500 m a.s.l. to 7500 m a.s.l.) are resulting from the mixing between layer 1 and layers above. We considered that the mass of particles in all four layers as equal to 10% of the mass of the parti-cles from layer 1 (polluted layer) plus 90% of the mass of the particles from layer 6 to 8 (free troposphere). Layers 6 to 8 (7500 m a.s.l. to 9000 m a.s.l.) are the free tropospheric
layers and are considered to have uniform optical properties. These properties are given by the direct measurements at the station during night time when the downslope wind brings clean air masses from the free troposphere to the station.
For each layer, the GAME code inputs consist of (1) rela-tive humidity, pressure and temperature derived from climate data for high altitudes atmospheric layers but adapted to fit the measures from the station, (2) wavelength-dependence aerosol optical properties (in practice 10 values in the solar range are entered and others are deduced by interpolation) : extinction coefficientσext(scattering coefficient + absorption
coefficient), asymmetry factor and single scattering albedo w0. The coefficients are calculated to fit the layering of the
atmosphere that we supposed and the AOD is divided into the layers so that the contribution of each layer to the AOD is proportional to the concentration of aerosols in it; and (3) So-lar angle and surface wavelength-dependence ground albedo. The outputs of the GAME code are the upward and down-ward net radiative fluxes between the different atmospheric layers computed for all solar spectrum (intervals of 100 cm−1 from 0.3 µm to 3.0 µm) and their radiative heating rate. Com-putations are done for two cases: with and without aerosol. The direct radiative forcing is then derived by subtracting these two values. The conventions of this forcing at the ground (Bottom Of Atmosphere – 1FBOA), in the
atmo-sphere (1FATM)and at the Top Of the Atmosphere (1FTOA)
are the ones commonly used, i.e. imply an aerosol cooling effect when1F is negative. It should be kept in mind that calculated forcing are maximum theoretical values because it is assumed that all energy is converted to heating. Clouds are not considered in the study, assuming only clear-sky con-dition. Snow albedo is that of pure fresh snow and therefore, synergistic impact of BC deposition to snow and albedo mod-ification is not considered in the study.
5.2 Direct radiative forcing by aerosols
Several runs have been performed for the different condi-tions listed in Table 2. For the pre-Monsoon season, we considered two cases; with snow surface and with rock sur-face conditions corresponding respectively to 58% and 42% of frequency. Results are summarized in Table 2 where we report forcing in W m−2 for the first layer of the
atmo-sphere (FATM), at the surface (FBOA)and at top of
atmo-sphere (FTOA)due to the presence of the aerosol layer. We
point out thatFTOAis calculated only considering the
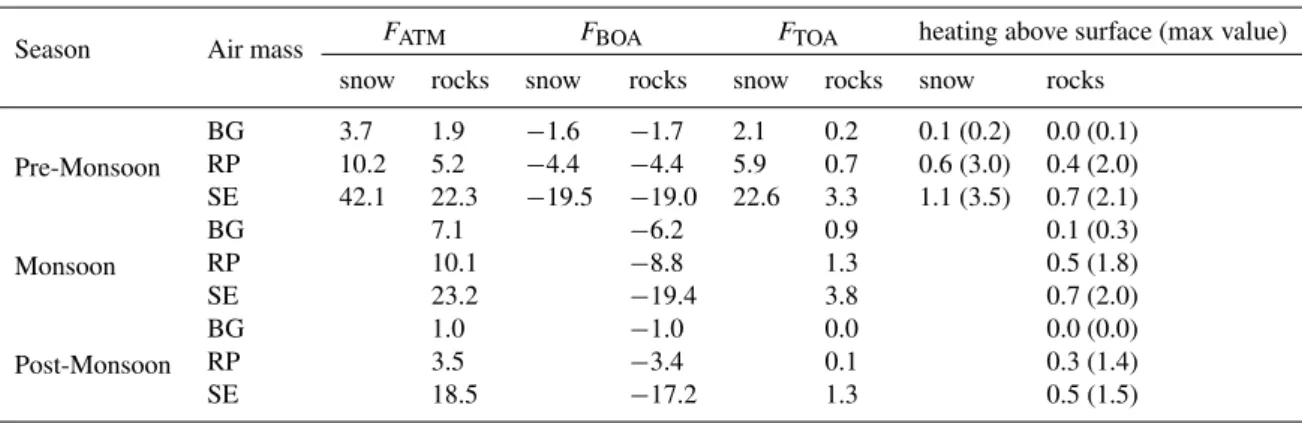
Table 2. Daily aerosol direct radiative forcing (W m2/day) for the different seasons and different air masses (BG for Background; RP for regional pollution; SE for special event) at , within all the Atmosphere (FATM), at the surface (FBOA)and at top of atmosphere (FTOA). We
also report the daily heating (in K) just above the surface; the mean value of the 3 h afternoon period around the maximum is reported in parenthesis.
Season Air mass FATM FBOA FTOA heating above surface (max value)
snow rocks snow rocks snow rocks snow rocks
Pre-Monsoon
BG 3.7 1.9 −1.6 −1.7 2.1 0.2 0.1 (0.2) 0.0 (0.1)
RP 10.2 5.2 −4.4 −4.4 5.9 0.7 0.6 (3.0) 0.4 (2.0)
SE 42.1 22.3 −19.5 −19.0 22.6 3.3 1.1 (3.5) 0.7 (2.1)
Monsoon
BG 7.1 −6.2 0.9 0.1 (0.3)
RP 10.1 −8.8 1.3 0.5 (1.8)
SE 23.2 −19.4 3.8 0.7 (2.0)
Post-Monsoon
BG 1.0 −1.0 0.0 0.0 (0.0)
RP 3.5 −3.4 0.1 0.3 (1.4)
SE 18.5 −17.2 1.3 0.5 (1.5)
For all background (BG) conditions, the daily radiative im-pact due to the presence of aerosol particles is almost neg-ligible with none significant heating at surface, which is ex-pected since BG air masses correspond to the very clean con-ditions of the free troposphere.
Radiative forcing during RP and SE conditions is signifi-cantly higher than for BG conditions. In Fig. 5, daily varia-tions of the aerosol direct radiative forcing are shown using conditions corresponding to the pre-Monsoon conditions. In the absence of snow (bare rocks conditions), aerosol forc-ing on the first 500 m atmospheric layer (FATM)and the
as-sociated forcing is limited for RP events, ranging from 3.5 to 10.1 W m2/day according the season. Almost all effective forcing is concentrated over the 11 a.m.–3 p.m. period corre-sponding to the peak of particle concentration due to regional transport. In that case, instantaneous radiative impact above a rocky surface ranges from up to 20 W m2corresponding to 1.4 K to 2.0 K warming above surface. In all cases, the ATM radiative impact is more important during the pre-Monsoon season due to the presence of snow.
The aerosol radiative forcing is higher in the presence of snow. This is due to higher surface albedo as respect to bare rocks favouring direct and multiple reflections between the surface and the atmosphere. During pre-Monsoon period, we have considered the presence of snow for 58% of the time, based on meteorological observations. This leads to instan-taneous ATM forcing of up to 40 W m2corresponding to a maximum of 3.0 K warming in the atmosphere above surface for a given day.
Radiative impact is even higher during SEs. This is not only due to very elevated concentration of particles, as seen in previous sections, but also because radiative impact and heating is more persistent throughout the day as respect to RP conditions. The average daily radiative impact for pre-Monsoon seasons ranges from 18 to 23 W m2/day over rocks
depending on the seasons. Over snow, the instantaneous forcing is even higher, reaching more than 50 W m2 in the morning and 140 W m2in the afternoon. This corresponds to maximum heating rate of 3.5 K/day above surface.
Overall, when we consider that SE event account for a maximum of 5% of the time and that daylight period is, on average, split between BG in the morning (30% of the time) and RP in the late-morning/afternoon (events 70% of the time), we calculate an average radiative forcing of approx-imately 10 W m−2 above bare rocks and 20 W m−2 above
snow surface. These are obviously considering only clear-sky conditions. Radiative forcing and heating rates calcu-lated for the conditions of NCO-P are slightly higher but on the same order, than those estimated by Ramana et al. (2004) for the Himalaya area, using a different method. There, daily heating rate are on average 1.2 K per day with in the first kilometer corresponding to 5 W m−2. Since our estimate is on one side a maximum value as explained in section 5.1 and on the other side, only referring to a very local layer of a first 500 m, we can consider that the two estimates show similar results.
At the surface, the computed forcing is negative, ranging from−1.5 W m−2for BG periods up to−20 W m−2for SEs
(see Table 2). Presence of snow is, in that case, not influ-encing BOA forcing. This forcing estimate is similar to that derived by Ramana et al. (2004) but for location much closer to emission sources. The amount of radiation received at the surface is clearly modified by the presence of aerosol parti-cles even at very high elevation.
6 Conclusions
S. Marcq et al.: Aerosol optical properties and radiative forcing in the high Himalaya 5869
0,78 0,82 0,86 0,9
0 4 8 12 16 20 24 Time of Day (h)
Sin g le Sca tte rin g Al be do w0 Pre‐Monsoon ‐ ‐ 0,64 0,68 0,72 0,76 0,8 0,84 0,88 0,92
0 4 8 12 16 20 24 Time of Day (h)
Single Sc atte ri n g Albedo w0 Monsoon ‐ 0,78 0,82 0,86 0,9
0 4 8 12 16 20 24 Time of Day (h)
Single Sc atte ri n g Albedo w0 Post‐Monsoon
Fig. 4.Diurnal variability of the hourly averaged (square) and
me-dian (triangle) single scattering albedo values at NCO-P for pre-monsoon, monsoon and post-monsoon periods. Dashed lines repre-sent 25 and 75-percentile, respectively.
Himalayas, and locally higher than IPCC estimated GHG as-sociated warming. Our estimates range from 10 to 20 W m−2 for the first atmospheric layer (500 m above surface). Warm-ing this layer is extremely dependent upon the presence of snow at the surface.
Warming takes place preferentially during episodes of re-gional pollution occurring on a very regular basis in the Hi-malayan valleys. A very strong component of the forcing is linked to the chemical characteristics of aerosol particles containing a strong absorption component. Single scattering albedos of 0.85, and lower, are regularly measured at NCO-P, in particular during episodes of regional pollution
dur-0 20 40 60 80 100 120 140 160
7 9 11 13 15 17
Hour Dir e ct In st a n ta n e o u s Ae ro so l Ra d ia ti v e Im p a ct (W /m
2) BG ‐ Rocks RP ‐ Rocks SE ‐ Rocks
BG ‐ Snow RP ‐ Snow SE ‐ Snow
Fig. 5. Direct instantaneous radiative forcing in the first
atmo-spheric layer (FS)during insulation hours in the pre-monsoon
sea-son for the 3 defined air mass types (BackGround, Regional Pollu-tion and Special Events) and for snow-covered and bare rock sur-faces.
ing the pre-Monsoon seasons. On relatively polluted days, instantaneous radiative forcing can reach values as high as 140 W m−2 corresponding to more than a 3 K warming of the lower atmosphere. Warming of the lower layer is accom-panied by a substantial decrease of the amount of radiation reaching the surface. This is estimated on the order of−4 to −20 W m−2for RP and SE events, respectively.
radiative balance of atmosphere with that of snow is required to provide a more complete estimate of the impact of aerosol particles in the HKH area.
Acknowledgements. This work was carried out in the
frame-work of the UNEP – ABC (Atmospheric Brown Clouds) and EvK2CNR – SHARE (Stations at High Altitude for Research on the Environment) projects. Contribution from CNRS through the PICS bilateral program between CNR and CNRS and through the LEFE-INSU program is greatly acknowledged. This work has also been supported by French National Research Agency (ANR) under Changements Environnementaux Plan´etaires program. We thank Tenzing Chhottar Sherpa, Kaji Bista, Laxman Adhikary, Pema Sherpa, Lhakpa Tshering Sherpa, Lakpa Tenzi Sherpa, Chhimi Tenzing Sherpa and Hari Shrestha for their support at the Nepal Climate Observatory -Pyramid.
Edited by: J. J. Schauer
The publication of this article is financed by CNRS-INSU.
References
Anderson, T. L. and Ogren, J. A.: Determining Aerosol Radia-tive Properties Using the TSI 3563 Integrating Nephelometer, Aerosol Science and Technology, 29(1), 57–69, 1998.
Bollasina M., Nigam, S., and Lau, K. M.: Absorbing aerosols and summer monsoon evolution over South Asia: An observational portrayal, J. Climate, 21, 3221–3239, doi:10.1175/2007JCLI2094.1, 2008.
Bonasoni, P., Laj, P., Angelini, F., Arduini, J., Bonaf`e, U., Calzo-lari, F., Cristofanelli, P., Decesari, S., Facchini, M. C., Fuzzi, S., Gobbi, G. P., Maione, M., Marinoni, A., Petzold, A., Roccato, F., Roger, J. C., Sellegri, K., Sprenger, M., Venzac, H., Verza, G. P., Villani, P., and Vuillermoz, E.: The ABC-Pyramid Atmospheric Research Observatory in Himalaya for aerosol, ozone and halo-carbon measurements, Sci. Tot. Environ., 391, 252–261, 2008. Bonasoni, P., Laj, P., Marinoni, A., Sprenger, M., Angelini, F.,
Arduini, J., Bonaf`e, U., Calzolari, F., Colombo, T., Decesari, S., Di Biagio, C., di Sarra, A. G., Evangelisti, F., Duchi, R., Facchini, M. C., Fuzzi, S., Gobbi, G. P., Maione, M., Panday, A., Roccato, F., Sellegri, K., Venzac, H., Verza, G. P., Villani, P., Vuillermoz, E., and Cristofanelli, P.: Atmospheric Brown Clouds in the Himalayas: first two years of continuous observa-tions at the Nepal-Climate Observatory at Pyramid (5079 m), At-mos. Chem. Phys. Discuss., 10, 4823–4885, doi:10.5194/acpd-10-4823-2010, 2010.
Bond, T. C. and Sun, H.: Can Reducing Black Carbon Emissions Counteract Global Warming? Environ. Sci. Technol., 39(16), 5921–5926, 2005.
Carrico, C. M., Rood,, M. J., and Ogren, J. A.: Aerosol light scattering properties at Cape Grim, Tasmania, during the First
Aerosol Characterization Experiment (ACE 1), J. Geophys. Res., 103(D13), 16565–16574, 1998.
Carrico C. M., Rood, M. J., Ogren, J. A., Neus¨uß, C. Wieden-sohler, A., and Heintzenberg, J.: Aerosol optical properties at Sagres, Portugal during ACE-2, Tellus B, 52(2), 69-4-715, doi:10.1034/j.1600-0889.2000.00049.x, 2000.
Carrico, M. C., Bergin, M. H., Shrestha, A. B., Dibb, J. E., Gomes, L., Harris, J. M.: The importance of carbon and mineral dust to seasonal aerosol properties in the Nepal Himalaya, Atmos. Environ., 37, 2811–2824, doi:10.1016/S1352-2310(03)00197-3, 2003.
Clarke, A. D.: Aerosol Light Absorption by Soot in Remote En-vironments, Aerosol Science and Technology, 10(1), 161–171, 1989.
Clarke, A. D., Howell, S., Quinn, P. K., Bates, T. S., Ogren, J. A., Andrews, E., Jefferson, A., Massling, A., Mayol-Bracero, O., Maring, H., Savoie, D., and Cass, G.: INDOEX aerosol: A comparison and summary of chemical, microphysical, and opti-cal properties observed from land, ship, and aircraft, J. Geophys. Res., 107(D19), 8033, doi:10.1029/2001JD000572, 2002. Cristofanelli, P., Bracci, A., Sprenger, M., Marinoni, A., Bonaf`e,
U., Calzolari, F., Duchi, R., Laj, P., Pichon, J. M., Roccato, F., Venzac, H., Vuillermoz, E., and Bonasoni, P.: Tropospheric ozone variations at the Nepal climate observatory – pyramid (Himalayas, 5079 m a.s.l.) and influence of stratospheric intru-sion events, Atmos. Chem. Phys. Discuss., 10, 1483–1516, doi:10.5194/acpd-10-1483-2010, 2010.
Decesari, S., Facchini, M. C., Carbone, C., Giulianelli, L., Rinaldi, M., Finessi, E., Fuzzi, S., Marinoni, A., Cristofanelli, P., Duchi, R., Bonasoni, P., Vuillermoz, E., Cozic, J., Jaffrezo, J. L., and Laj, P.: Chemical composition of PM10 and PM1at the high-altitude Himalayan station Nepal Climate Observatory-Pyramid (NCO-P) (5079 m a.s.l.), Atmos. Chem. Phys., 10, 4583–4596, doi:10.5194/acp-10-4583-2010, 2010.
Delene, D.J. and Ogren, J. A.: Variability of aerosol optical proper-ties at four North American surface monitoring sites, Journal of Atmospheric Science 59 pp. 1135–1150, 2002.
Dubuisson, P., Buriez, J. C., and Fouquart, Y.: High spectral reso-lution solar radiative transfer in absorbing and scattering media: application to the satellite simulations, J. Quant. Spectrosc. Ra., 55, 103–126, 1996.
Dumka, U. C., Satheesh, S. K., Pant, P., Hegde, P., and Kr-ishna Moorthy, K.: Surface changes in solar irradiance due to aerosols over central Himalayas, Geophys. Res. Lett., 33, L20809, doi:10.1029/2006GL027814, 2006.
Dumka, U. C., Satheesh, S. K., Pant, P., Hegde, P., and Moorthy, K. K.: Reply to comment by S. Ramachandran on “Surface changes in solar irradiance due to aerosols over central Himalayas”, Geo-phys. Res. Lett., 35, L04813, doi:10.1029/2007GL030556, 2008. Flanner, M. G. and Zender, C. S.: Snowpack Radiative Heating: Influence on Tibetan Plateau Climate, Geophys. Res. Lett., 32(6), L06501, doi:10.1029/2004GL022076, 2005.
Flanner, M. G., Zender, C. S., Randerson, J. T., and Rasch, P. J.: Present-day climate forcing and response from black carbon in snow, J. Geophys. Res., 112, D11202, doi:10.1029/2006JD008003, 2007.
Atmos. Chem. Phys., 9, 2481–2497, doi:10.5194/acp-9-2481-2009, 2009.
Gobbi, G. P., Angelini, F., Bonasoni, P., Verza, G. P., Marinoni, A., and Barnaba, F.: Sunphotometry of the 2006–2007 aerosol opti-cal/radiative properties at the Himalayan Nepal Climate Obser-vatory – Pyramid (5079 m a.s.l.), Atmos. Chem. Phys. Discuss., 10, 1193–1220, doi:10.5194/acpd-10-1193-2010, 2010. Hansen, J., Sato, M., Ruedy, R., Lacis, A., and Oinas, V.: Global
warming in the twenty-first century: An alternative scenario, PNAS 29 August 2000, Vol. 97, No. 18, 9875–9880, 2000. Henne, S., Furger, M., Nyeki, S., Steinbacher, M., Neininger, B.,
de Wekker, S. F. J., Dommen, J., Spichtinger, N., Stohl, A., and Pr´evˆot, A. S. H.: Quantification of topographic venting of bound-ary layer air to the free troposphere, Atmos. Chem. Phys., 4, 497– 509, doi:10.5194/acp-4-497-2004, 2004.
Hess, M., Koepke, P., and Schult, I.: Optical properties of aerosols and clouds: the software package, B. Am. Meteorol. Soc., 79, 831–844, 1998.
Holben, B. N., Eck, T. F., Slutsker, I., Tanre, D., Buis, J. P., Set-zer, A., et al.: AERONET – A federated instrument network and data archive for aerosol characterization, Remote Sens. Environ., 66(1), 1–16, 1998.
Huang, Y., Chameides, W. L., and Dickinson, R. E.: Direct and indirect effects of anthropogenic aerosols on regional pre-cipitation over East Asia, J. Geophys. Res., 112, D03212, doi:10.1029/2006JD007114, 2007.
Hyv¨arinen, A. P., Lihavainen, H., Komppula, M., Sharma, V. P., Kerminen, V. M., Panwar, T. S., and Viisanen, Y.: Continu-ous measurements of optical properties of atmospheric aerosols in Mukteshwar, northern India, J. Geophys. Res., 114, D08207, doi:10.1029/2008JD011489, 2009.
IPCC: Climate 2007, The scientific basis, Houghton, J. T., et al., (Cambridge Univ. Press., Cambridge), 2007.
Jacobson, M. Z.: Control of fossil-fuel particulate black car-bon and organic matter, possibly the most effective method of slowing global warming, J. Geophys. Res., 107(D19), 4410, doi:10.1029/2001JD001376, 2002.
Kivek¨as, N., Sun, J., Zhan, M., Kerminen, V.-M., Hyv¨arinen, A., Komppula, M., Viisanen, Y., Hong, N., Zhang, Y., Kulmala, M., Zhang, X.-C., Deli-Geer, and Lihavainen, H.: Long term par-ticle size distribution measurements at Mount Waliguan, a high-altitude site in inland China, Atmos. Chem. Phys., 9, 5461–5474, doi:10.5194/acp-9-5461-2009, 2009.
Koloutsou-Vakakis, S., Carrico, C. M., Kus, P., Rood, M. J., Li, Z., Shrestha, R., Ogren, J. A., Chow, J. C., and Watson, J. G.: Aerosol properties at a midlatitude Northern Hemisphere conti-nental site, J. Geophys. Res., 106(D3), 3019–3032, 2001. Komppula, M., Lihavainen, H., Hyv¨arinen, A.-P., Kerminen, V.-M.,
Panwar, T. S., Sharma, V. P., and Viisanen, Y.: Physical proper-ties of aerosol particles at a Himalayan background site in India, J. Geophys. Res., 114, D12202, doi:10.1029/2008JD011007, 2009.
Lacis, A. A. and Oinas, V.: A description of the correlated k-distribution method, J. Geophys. Res., 96, 9027–9064, 1991. Lau, K.-M. and Kim, K.-M.: Observational relationship between
aerosol and Asian monsoon rainfall, and circulation, Geophys. Res. Lett., 33, L21810, doi:10.1029/2006GL027546, 2006. Lelieveld, J., Crutzen, P. J., Ramanathan, V., et al.: The Indian
Ocean Experiment: Widespread Air Pollution from South and
Southeast Asia, Science, 291, 1031–1036, 2001.
Marinoni, A., Cristofanelli, P., Laj, P., Duchi, R., Calzolari, F., Decesari, S., Sellegri, K., Vuillermoz, E., Verza, G. P., Villani, P., and Bonasoni, P.: Aerosol mass and black carbon concen-trations, two year-round observations at NCO-P (5079 m, South-ern Himalayas), Atmos. Chem. Phys. Discuss., 10, 8379–8413, doi:10.5194/acpd-10-8379-2010, 2010.
Marshall, D., Covert, S., and Charlson, R. J.: Relationship between asymmetry parameter and hemispheric backscatter ratio – impli-cations for climate forcing by aerosols, Appl. Optics, 34, 6306– 6311, 1995.
Nakajima, T., Yoon, S., Ramanathan, V., Shi, G., Takemura, T., Hig-urashi, A., Takamura, T., Aoki, K., Sohn, B., Kim, S., Tsuruta, H., Sugimoto, N., Shimizu, A., Tanimoto, H., Sawa, Y., Lin, N., Lee, C., Goto, D., and Schutgens, N.: Overview of the Atmo-spheric Brown Cloud East Asian Regional Experiment 2005 and a study of the aerosol direct radiative forcing in east Asia, J. Geo-phys. Res., 112, D24S91, doi:10.1029/2007JD009009, 2007. Nessler, R., Weingartner, E., and Baltensperger, U.: Effect of
hu-midity on aerosol light absorption and its implications for extinc-tion and the single scattering albedo illustrated for a site in the lower free troposphere, J. Aerosol Sci., 36(8), 958–972, 2005a. Nessler, R., Weingartner, E., and Baltensperger, U.: Adaptation
of dry nephelometer measurements to ambient conditions at the Jungfraujoch, Environ. Sci. Technol., 39, 2219–2228, 2005b. Ogren, J. A.: A systematic approach to in situ observations of
aerosol properties, in: Aerosol Forcing of Climate, edited by: Charlson, R. J. and Heintzenberg, J., John Wiley & Sons, Ltd., 215–226, 1995.
Painter, T. H., Barrett, A. P., Landry, C., Neff, J., Cassidy, M. P., Lawrence, C., McBride, K. E., and Farmer, G. L.: Impact of dis-turbed desert soils on duration of mountain snowcover, Geophys. Res. Lett., 34(12), L12502, doi:10.1029/2007GL030284R, 2007. Panday, A. and Prinn, R.: The diurnal cycle of air pollution in the Kathmandu Valley, Nepal: Observations, J. Geophys. Res-Atmos., 114, D09305, doi:10.1029:2008JD009777, 2009. Pant, P., Hegde, P., Dumka, U. C., Sagar, R., Satheesh, S. K.,
Moor-thy, K. K., Saha, A., and Srivastava, M. K.: Aerosol character-istics at a high-altitude location in central Himalayas: Optical properties and radiative forcing, J. Geophys. Res., 111, D17206, doi:10.1029/2005JD006768, 2006
Petzold, A., Kramer, H., and Sch¨onlinner, M.: Continuous measure-ment of atmospheric black carbon using a Multi-Angle Absorp-tion Photometer, Environ. Sci. Pollut. R., 4, 78–82, 2002b Ramachandran, S.: Comment on Surface changes in
so-lar irradiance due to aerosols over central Himalayas by U. C. Dumka et al., Geophys. Res. Lett., 35, L04814, doi:10.1029/2007GL030060, 2008.
Ramanathan, V., Krutzen, P. J., Kiehl, J. T., and Rosenfeld, D.: Aerosols, climate, and the hydrology, Science, 294, 2119–2124, 2001.
Ramanathan, V., Chung, C., Kim, D., Bettge, T., Buja, L., Kiehl, J. T., Washington, W. M., Fu, Q., Sikka, D. R., and Wild, M.: Atmospheric Brown Clouds: Impacts on South Asian Climate and Hydrological Cycle, PNAS, Vol. 102, No. 15, 5326–5333, 2005.
2007a.
Ramanathan, V., Li, F., Ramana, M. V., Siva, P. S., Kim, D., Corri-gan, C. E., Nguyen, H., Stone, E. A., Schauer, J. J., Carmichael, G. R., Adhikary, B., and Yoon, S. C.: Atmospheric Brown Clouds: Hemispherical and regional variations in long range transport, absorption and radiative forcing, J. Geophys. Res., 112, doi:10.1029/2006JD008124, 2007b.
Richter A., Burrows, J. P., N¨uˆa, H., Granier, C., and Niemeier, U.: Increase in tropospheric nitrogen dioxide over China observed from space, Nature, 437, 129–132, 2005.
Roger, J.-C., Mallet, M., Dubuisson, P., Cachier, H., Vermote, E., Dubovik, O., and Despiau, S.: A synergetic approach for estimating the local direct aerosol forcing: Application to an urban zone during the Exp´erience sur Site pour Contrain-dre les Mod`eles de Pollution et de Transport d’Emission (ES-COMPTE) experiment J. Geophys. Res., 111(D13), D13208, doi:10.1029/2005JD006361 (AGU), 2006.
Scott, N. A.: A direct method of computation of the transmission function of an inhomogeneous gaseous medium-I: Description of the method, J. Quant. Spectrosc. Ra., 14, 691–704, 1974. Stamnes, K., Tsay, S., Wiscombe, W., and Jayaweera, K.:
Nu-merically stable algorithm for discrete-ordinate-method radiative transfer in multiple scattering and emitting layered media, Appl. Optics, 27, 2502–2509, 1988.
Sellegri, K., Laj, P., Venzac, H., Boulon, J., Picard, D., Villani, P., Bonasoni, P., Marinoni, A., Cristofanelli, P., and Vuiller-moz, E.: Seasonal variations of aerosol size distributions based on long-term measurements at the high altitude Himalayan site of Nepal Climate Observatory-Pyramid (5079 m), Nepal, At-mos. Chem. Phys. Discuss., 10, 6537–6566, doi:10.5194/acpd-10-6537-2010, 2010.
Venzac, H., Sellegri, K., Laj, P., Villani, P., Bonasoni, P., Mari-noni, A., Cristofanelli, P., Calzolari, F., Fuzzi, S., Decesari, S., Facchini, M.-Cr., Vuillermoz, E., and Verza, G. P.: High Frequency New Particle Formation in the Himalayas; PNAS, 105(41), 15666–15671, 2008.
Villani, P., Picard, D., Marchand, N., and Laj, P.: Design and Val-idation of a 6-Volatility Tandem Differential Mobility Analyzer (VTDMA), Aerosol Sci. Technol., 41(10), 898–906, 2007. Welton, E. J., Voss, K. J., Quinn, P. K., Flatau, P. J., Markowicz, K.,
Campbell, J. R., Spinhirne, J. D., Gordon, H. R., and Johnson, J. E.: Measurements of aerosol vertical profiles and otical proper-ties during INDOEX 1999 using micropulse lidars, J. Geophys. Res., 107, 8019, doi:10.1029/2000JD000038, 2002.
Xu, J., Bergin, M. H., Greenwald, R., Schauer, J. J., Shafer, M. M., Jaffrezo, J. L., and Aymoz, G.: Aerosol chemical, physi-cal, and radiative characteristics near a desert source region of northwest China during ACE-Asia, J. Geophys. Res., 109(D19), D19S0310, doi:1029/2003JD004239, 2003.