Canadian birth seasonality and its possible
association with seasonal brightness
David R. Cummings
Dilworth, MN
bynehill@cableone.net
Abstract
This paper tests whether atmospheric brightness is related to Canadian birth seasonality ten-eleven months earlier. Births and visibility (brightness) are correlated nation-wide and in nine provinces/ cities. For the national correlation, r=0.928. Therefore, seasonal brightness provides a plausible explanation for inter-annual changes in seasonality, and may reconcile divergent viewpoints. Easy veriication is a major strength, although underlying causality remains unknown. While these results suggest a direct association between seasonal brightness and seasonality, brightness may not be an exclusive determinant.
Keywords: human birth seasonality, atmospheric brightness, human conceptions, human fertility.
Résumé
Cet article analyse le lien éventuel entre la luminosité atmosphérique et le caractère saisonnier des naissances au Canada dix à onze mois plus tôt. Une corrélation est fait entre les naissances et la luminosité dans plusieurs villes de neuf provinces au pays. Résultats : Corrélation nationale r= 0.928. Donc la luminosité saisonnière est une explication plausible des changements interannuels du caractère saisonnier et peut réconcilier des points de vue divergents. La vériication facile est certes une force de taille bien que les causes sous-jacentes demeurent inconnues. Les résultats font croire à un lien direct entre la luminosité saisonnière et le caractère saisonnier, mais la luminosité peut ne pas être un déterminant exclusif.
Introduction
Since irst being recognized nearly two hundred years ago (Quetelet 1835), human birth seasonality remains an important tenet of modern biological and demographical research. Today, most populations demonstrate repetitive inter-annual birth patterns (Roenneberg and Aschoff 1990; Lam and Miron 1991; Rosenberg 1966; Matsuda and Kahyo (1994); Trovato and Odynak 1993, 1994; Chandwani et. al 2004). Non-seasonality, however, may be found in a number of south Paciic Islands (Brewis et al.1996) as well as Tierra del Fuego, at the southern tip of South America (Pascual et al. 2000). For the most part, however, seasonality is intrinsic to the vast majority of human populations.
Since its initial discovery, researchers have proposed numerous explanations for seasonality. During the past ifty years, for example, Roenneberg and Aschoff (1990) suggest that seasonality results from annual changes in photoperiod and temperature. In addition to the possible inluence of photoperiod, James (1990) inds that holiday seasons might be an important factor in seasonality. Trovato and Odynak (1993) as well as Cesario (2002) cite the possible inluence of the “Christ-mas effect” on conceptions. Cowgill (1966) considers increased urbanization as a possible determinant of seasonality. In Germany, changes in birth seasonality during the 1970s are linked to a shift from biological to social reasons, notably oral contraceptives (Lerchl et al. 1993). In The Netherlands, Haandrikman and van Vis-sen (2008) also ind family planning a possible cause of seasonality. Halli (1989) proposes that modern birth control disrupts seasonality patterns in Canada. In the Czech Republic, Bobak and Gjonca (2001) ind that seasonality is strongly inlu-enced by socio-demographic factors such as age, educational level and birth parity. Chang et al. (1963) cite seasonal variation in temperature as being causative to sea-sonality. In Japan, Matsuda and Kahyo (1994) believe that seasonal marriages and environmental factors inluence seasonality. Becker et al. (1986), Leslie and Fry (1989) and Huber and Fieder (2008) believe that inadequate nutrition plays a ma-jor role in seasonality. Greksa (2003) considers the seasonal pattern of weddings and the holiday seasons as critical factors for seasonality among the Old Order of Amish. In Malta, Grech et al. (2003) ind that the seasonality of births is associ-ated with the seasonality of marriages. Russell et al. (1993) suggest that seasonality may be related to environmental and social factors. Among other determinants, Rojansky et al. (1992) suggest a possible role of vitamin D3 on seasonality. More recently, Rizzi and Dalla-Zuanna (2007) ind that the seasonality of conceptions changes with woman’s age and frequency of sexual intercourse.
plausible that US conceptions occur during the autumn as temperatures moderate, however, European conceptions increase as temperatures increase.
Another dificulty arises because the seasonal distribution of births is often bimodal, making it necessary to explain both the minor and major peaks of births. As a result, researchers generally theorize one reason for one peak and a separate, unrelated reason for the other. James (1990), for example, suggests that spring conceptions are associated with photoperiod and December conceptions with the holiday season. To further complicate matters, seasonality often, but not invariably, luctuates. Thus, it becomes necessary to further explain this aspect of seasonality as well. During the 1970s, for example, European seasonality patterns gradually shifted closer to the American pattern with increased births during the last half of the year (Roenneberg and Aschoff 1990; James 1990; Lerchl et al. 1993). Several researchers (Lerchl et al. 1993; Haandrikman and van Vissen 2008), believe that this seasonal swing in seasonality is due to better family planning and the introduc-tion of oral contraceptives. Yet, oral contraceptives were introduced in the US at the same time and the US seasonality remained unchanged.
In view of the numerous explanations offered for seasonality and their associ-ated complexities, it is understandable why Lam and Miron (1991) might advocate multi determinants for seasonality. While the present paper postulates that sea-sonal changes in cloudiness offers a plausible explanation for much of seasea-sonality, the possible effect from other inluences must also be acknowledged.
There are several reasons for developing a seasonality hypothesis based on atmospheric brightness (lux) as opposed to the previous determinants cited for seasonality. First, as indicated above, none of the numerous explanations are fully satisfying. Second, and most important, because seasonality is primarily a fertil-ity issue, fundamental animal physiology and endocrine processing should be ac-knowledged. During the past one hundred years or so, the scientiic community has produced countless studies and experiments regarding the causal relationship between increased annual photoperiod, melatonin and animal reproduction (Wurt-man 1973; Wehr 1998). Furthermore, the optical-pineal pathway by which exogen-ous light affects fertility is equally well established. The totality of this evidence [not cited beyond Wurtman (1973) and Wehr (1998)] makes light a prime suspect. There seems no reason to abandon a preponderance of evidence simply because
88 90 92 94 96 98 100 102 104 106
Jan Feb Mar Apr May Jun Jul Aug Sep Oct Nov Dec
Births
late autumn/early winter conceptions in Canada and the US defy the photoperiod hypothesis. It seems more likely that there is something in the light/fertility rela-tionship that is yet to be understood.
For example, in a simple analogy daylight might be compared to a two-sided coin on which one side is the length of the light period and on the other side is its brightness, or intensity. Like the sides of a coin, the two variables are inseparable. Rather than continuing to focus on photoperiod, perhaps more attention should be directed at the intensity, or brightness (illuminance) of light. There may be an evolutionary basis for redirecting our focus to light brightness. Our species is thought to have evolved in East Africa millions of years ago (Fagan 2006), a region of little photoperiod variation, but of considerable changes in seasonal brightness due to seasonal monsoons (de Menocal 2004). Because of geographical reasons, our species may have grown more sensitive to changes in seasonal brightness than to annual changes in photoperiod. Possibly, for this underlying reason, seasonal photoperiod cannot be irmly established as a primary determinant for present-day birth seasonality.
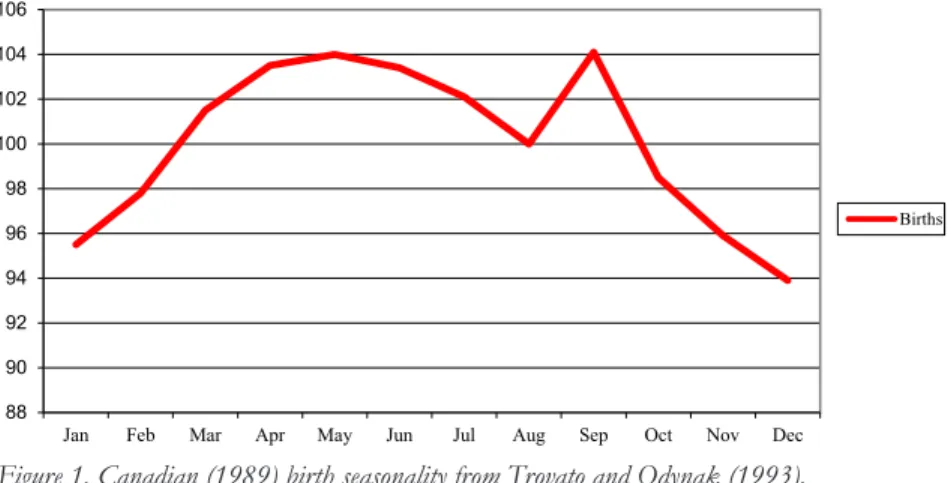
This paper tests the brightness hypothesis in Canada for several reasons. Can-ada is a vast country with considerable differences in climate, cultural diversity, ra-cial heterogeneity and population density. Despite this diversity, previous research has shown that Canadian birth patterns have been relatively stable during 1926– 1989 (Trovato and Odynak 1993). It may be noted, however, that a slight decline occurred during the irst eight months of the year. Why should birth patterns be generally consistent in the face of so many environmental and cultural differ-ences? By focusing on seasonal brightness, however, we might better understand why seasonal Canadian conceptions occur as they do. It is proposed that a direct association exists between seasonal brightness and seasonal births approximately eleven months later.
Methodology
As a fundamental strategy, atmospheric brightness (airport data) and season-ality (provincial data) are correlated using the Pearson Product Movement Coefi-cient of Correlation. Although the data match (city/provincial) is less than ideal, correlative integrity is maintained because annual visibility patterns across lower Canada are much the same. Primary differences are in degree and not the general pattern itself. Table 1, for example, displays visibility data for ifteen major cities in the most heavily populated regions of Canada . With the possible exception of the maritime provinces, the pattern is similar. (The term atmospheric brightness is used throughout the paper. It is deined as the atmospheric illuminance, or lux, as perceived by the observer. The terms atmospheric brightness and atmospheric visibility are used interchangedly.)
general health issues, clothing; headgear, social considerations, indoor/outdoor ratio time and a male contribution to seasonality. Because these confounders may occur separately or in conluence, it may be more practical to simply disprove the brightness hypothesis.
There are two underlying assumptions, the human gestation period is con-sidered to be nine complete months and a lag, or endocrine response period, exists between exposure to seasonal brightness and its affect on conceptions. Given the female menstrual cycle at 28 days, a delayed reproductive response of one-two months is not unreasonable. For example, December births may be associated with January visibility eleven months earlier. Previous research by the author (2002, 2003, 2007, 2009a, 2009b, 2010) has shown that a lag of several months exists between exposure to increase brightness and the effect on conceptions.
Because meteorological records do not relect direct measurements of atmos-pheric brightness, a suitable proxy is necessary. Solar radiation, bright sunshine, hours of sunshine and photoperiod, however, may be adequate, but not necessarily good proxies. These variables are closely related to the Sun’s annual cycle. If photo-period were a major inluence on human conceptions, maximum conceptions in Canada might occur during June or July. They do not, of course, and for this reason astronomical variables such as these make the least desirable proxies. Clear days, clear observations, percentage of sky cover and visibility measurements make bet-ter substitutes because they are largely independent of the solar cycle. For instance, in Nashville, TN, July has the strongest monthly irradiance although the sky is the clearest in September. July may have greater overall solar energy than September, but September is the clearest, or brightest month (US Climate Data Center).
Visibility measurements may make a superior proxy for brightness for several other reasons. Visibility measurements automatically compensate for a variety of atmospheric conditions that might otherwise restrict atmospheric brightness For example, a day may be designated as being clear of cloud cover without taking into full account conditions such as fog, haze, dust or other atmospheric pollu-tion. Also, visibility readings are taken at international airports on an hourly basis and are more deinitive than a singular, broad measurement such as a “clear day.” Furthermore, it seems reasonable that for a given distance, increased hours of observation represents greater atmospheric clarity, or brightness. In Table 1, for example, if an observer in Calgary is able to see a distance <= 9 km for 698.2 hours in October, but only 686.2 hours for the same distance in September, we must conclude that October is slightly brighter by 13 hours. Atmospheric light may be brighter, sharper and clearer because it is less diffused and scattered by clouds or other airborne particles. From Table 1, it is assumed that visibility hours >= 9 km represents the monthly deviation of atmospheric clarity, or brightness, for the most populous regions of lower Canada.
National level
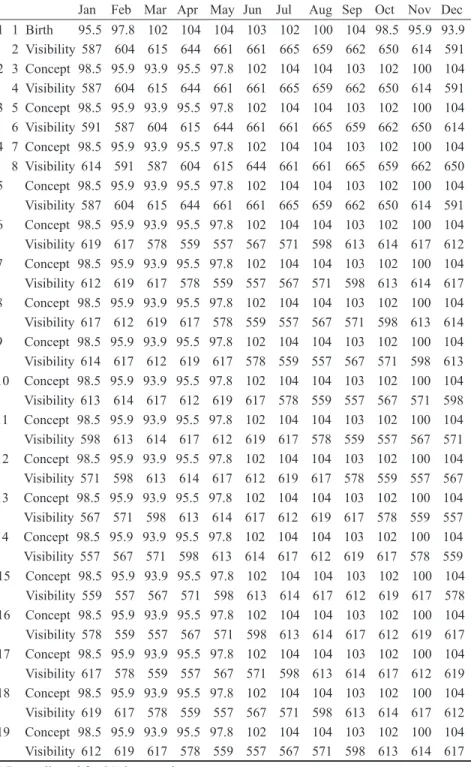
For the national correlation, Canadian birth seasonality data (1989) are pro-vided by courtesy of Trovato and Odynak (1993) and presented as a part of Table 2. [It may be noted that Weschler and Halli (1992), using a different methodology (data not shown) calculate Canadian seasonality nearly identical to that of Trovato and Odynak (1993)]. Visibility data are summarized during 1971–2000 and pro-vided by Environment Canada.
Table 2 assumes that the conceptual pattern is identical to the birth pattern nine months earlier. It tests for an association between visibility (brightness) and conceptions. For example, in Table 2, birth lines 1 and 2 display original visibil-ity and seasonal birth data. Assuming nine complete months for gestation, births for January (95.5) would have been conceived nine months earlier in April (line3). Since April conceptions may have been affected by visibility hours during April, lines 3 and 4 are correlated (r=0.339). Moving down to lines 5 and 6, line 6
advan-ces the entire visibility array by one month to test the possible inluence of visibil-ity one month prior to conception. March visibilvisibil-ity hours (614.7) are now matched to April conceptions (95.5) and correlated (r=0.689). Moving down to lines 7 and 8, line 8 advances the entire array by another month to test the possible association between visibility hours two months prior to conception. April conceptions (95.5) are matched to February visibility hours (603.9) and correlated (r=0.928). This correlation (r=0.928) is presented in Fig. 2.
Table 1. Hours of visibility for distance >= 9 km for ifteen Canadian cities (1971–2000).
Jan Feb Mar Apr May Jun Jul Aug Sep Oct Nov Dec 1 Calgary 624.7 569.5 625.1 656.8 705.9 702.4 735.5 720.8 686.2 698.2 620.3 649.0
2 Edmonton 644.2 585.4 658.1 681.4 719.6 702.0 723.8 715.2 698.1 714.4 623.5 648.9
3 Halifax 543.1 511.7 542.4 516.5 548.2 533.0 534.0 544.3 575.7 603.4 559.0 558.9
4 Montreal 581.0 546.6 623.9 643.3 681.8 647.2 668.1 651.9 627.6 652.6 584.8 586.1
5 Ottawa 573.4 532.1 603.2 631.0 665.4 625.7 642.2 622.2 595.2 634.9 572.7 554.6
6 Quebec 553.3 527.0 616.3 631.8 679.8 652.2 674.9 659.4 643.1 664.7 587.8 557.1
7 Saint John 581.6 530.8 568.1 554.1 576.9 511.0 501.7 519.9 555.8 601.2 575.3 576.0
8 Toronto 584.7 525.2 607.7 633.2 643.2 608.5 635.8 619.0 586.9 620.5 574.3 574.3
9 Vancouver 578.8 584.6 694.8 693.0 725.9 700.7 730.6 720.2 664.6 605.7 611.5 596.3
10 Victoria 600.2 577.3 693.1 699.6 728.3 705.1 732.3 721.0 676.2 623.8 609.4 597.8
11 Winnipeg 623.3 580.8 651.7 683.4 725.9 700.0 728.9 726.5 696.0 697.3 620.4 628.6
12 Gander 570.3 507.0 543.0 512.2 574.3 587.7 643.4 639.4 622.6 619.0 560.3 559.1
13 Saskatoon 640.5 585.8 668.6 679.4 723.0 706.1 734.5 731.1 704.5 717.0 645.9 634.3
14 St. John’s 515.0 469.5 491.8 458.0 493.8 512.3 553.8 565.6 571.6 586.2 535.1 533.4
15 Regina 590.8 548.8 632.9 679.5 718.0 702.2 733.3 726.8 701.4 704.5 630.5 608.8
Average 587.0 545.5 614.7 623.5 660.7 639.7 664.9 658.9 640.4 649.6 594.1 590.9
Adjust 31 for
days 587.0 603.9 614.7 644.2 660.7 661.0 664.9 658.9 661.7 649.6 613.9 590.9
Table 2. Canadian birth seasonality correlated with visibility >= 9 Km (1971-2000).*
Provincial level
Provincial birth data (1991–2007) are provided by Statistics Canada (CANSIM). Metropolitan airport visibility data (1991–2004) are provided by the National Oceanic and US Atmospheric Administration (NOAA) and the US Na-tional Climate Data Center (NCDC). Visibility data are summarized for seven Canadian cities and depicted in Fig 3.
Data sources: Birth/Province (CANSIM) Visibility/City (NCDC)
British Columbia Vancouver
Alberta Calgary
Saskatchewan Regina
Manitoba Winnipeg
Ontario Toronto
Quebec Montreal
New Brunswick Saint John
Prince Edward Island Charlottetown
Nova Scotia Halifax
Figure 2. Canadian (1989) birth seasonality from Trovato and Odynak (1993).
0 100 200 300 400 500 600 700 800
Jan Feb Mar Apr May Jun Jul Aug Sep Oct Nov Dec
A
ver
ag
e
h
rs o
f V
isi
b
il
it
y
Calgary
Montreal
Toronto
Vancouver
Winnipeg
St John's
Halifax
Figure 3. Visibility >= 9 km for seven Canadian cities (1990–2004).
500.0 550.0 600.0 650.0
700.0 Visibility
Visibility for the time-series correlations is deined as the percentage of ob-servations where ceiling >= 762 m (2500 ft) with a range >=8.04 km (5 mi) and wind speed <= 13 knots. As with the Canadian meteorological data, it is assumed that increased visibility readings for the same distance equal to differences in atmospheric brightness. An example of the monthly birth and visibility data used for correlation is shown in Appendix A. As opposed to the time-series correla-tions, however, Appendix B displays correlative results for averaged months of visibility and births.
Prior to correlation, visibility and birth data in each ile are adjusted for 31-day months/leap years and a percentage of an annual mean. The resulting percentage is formatted chronologically and aligned for a ten-month gap between visibility and birth. For instance, January 1991 visibility is aligned to November 1991 births. To eliminate aberrancies, each ile is further adjusted and presented as a six-month running average. From this inal adjustment, three r values are calculated starting with the ten-month gap between January 1991visibility and November 1991 births, a eleven-month gap between January 1991 visibility and December 1991 births and inally a twelve-month gap between January 1991 visibility and January 1992 births.
Results
For the national correlation, r=0.928. For provincial correlations: British Columbia/Vancouver r=0.765, Alberta/Calgary r=0.574, Saskatchewan/Regina r=0.721, Manitoba/Winnipeg r=0.685,Ontario/Toronto r=0.899, Quebec/Mont-real r=0.946, New Brunswick/Saint John r= 0.558, Prince Edward Island/Char-lottetown 0.610 and Nova Scotia/Halifax r=0.816.
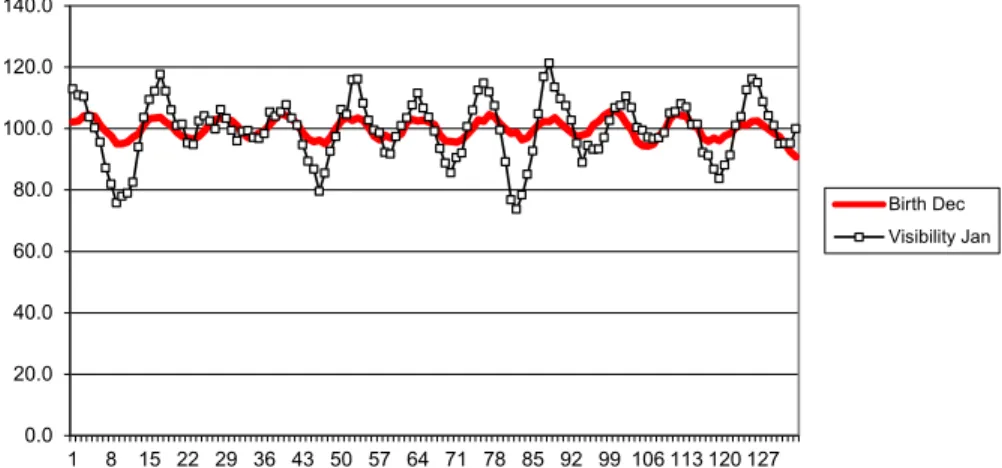
With regard to the time-series correlations, results are moderate to strong with p = 0.0000001 in all cases and are presented in Table 3. As one example of Table 3, Fig. 4 depicts the January–December result for Manitoba births and Win-nipeg visibility (1991–2002). January visibility is correlated to December births for 133 months.
Discussion
The present study conirms what two previous studies have shown, birth sea-sonality is a valid phenomenon for human populations in Canada. The present study, however, suggests that much of seasonality may be associated with atmos-pheric brightness, several months prior to the conceptual month.
photoperiod because of the increased conception rate during December. Rather, these authors ind that leisure time during the Christmas season may very well contribute to a peak of births in the following September.
Notwithstanding the importance of photoperiod and temperature on fertil-ity, it is dificult to see their inluence on seasonalfertil-ity, For example, Fig 5 presents the annual relationship between visibility, photoperiodic, temperature and birth data for Quebec city during 1971–2000. In viewing this igure, it would seem that a plausible connection might exist between temperature or photoperiod and sea-sonal births. Research suggests, however, that increased heat may be detrimental to spermatogenesis production and vitality (Levine 1991; Spira 1991; Hjollund et al. 2002). Consequently, higher temperatures in July and August should result in a decrease in births nine months later in April and May. However, this does not
Table 3. Visibility/birth, a time-series correlation results for nine Canadian Provinces.
Province/city 6 month running Avg start dates Correlative
pairs r values British Columbia Jan Vis 91 – Nov birth 91 134 0.5847 Vancouver Jan Vis 91 – Dec birth 91 133 0.7659 Jan Vis 91 – Jan birth 92 132 0.7396
Alberta Jan Vis 91 – Nov birth 91 134 0.5744 Calgary Jan Vis 91 – Dec birth 91 133 0.4386 Jan Vis 91 – Jan birth 92 132 0.2203
Saskatchewan Jan Vis 93 – Nov birth 93 103 0.7216 Regina Jan Vis 93 – Dec birth 93 102 0.5461 Jan Vis 93 – Jan birth 94 101 0.2103
Manitoba Jan Vis 91 – Nov birth 91 134 0.6102 Winnipeg Jan Vis 91 – Dec birth 91 133 0.6851 Jan Vis 91 – Jan birth 92 132 0.6206
Ontario Jan Vis 91 – Nov birth 91 134 0.8991 Toronto Jan Vis 91 – Dec birth 91 133 0.8738 Jan Vis 91 – Jan birth 92 132 0.6138
Quebec Jan Vis 90 – Nov birth 90 108 0.9462 Montreal Jan Vis 90 – Dec birth 90 107 0.8550 Jan Vis 90 – Jan birth 91 106 0.5895
New Brunswick Jan Vis 91 – Nov birth 91 134 0.5444 Saint John Jan Vis 91 – Dec birth 91 133 0.5589 Jan Vis 91 – Jan birth 92 132 0.4658
Prince Edward Jan Vis 91 – Nov birth 91 134 0.6106 Island Jan Vis 91 – Dec birth 91 133 0.4680 Charlottetown Jan Vis 91 – Jan birth 92 132 0.2134
appear to be the case as a birth peak occurs in April. While temperature variation may possibly affect fertility, it does not appear to strong determinant for seasonal-ity. On the other hand, since photoperiod reaches a maximum during June and July, it might seem to be a better candidate for causality. There are at least two valid reasons why this cannot be true. First, in the US, the bulk of seasonal concep-tions occur in November or December, or as photoperiod is decreasing. Secondly, Canadian birth patterns are not intransient, an effect conirmed by Trovato and Odynak (1993) as well as in other non-Canadian studies(Lerchl et. al 1993; Roen-neberg and Aschoff 1990; Rosenberg 1966). If photoperiod were a primary deter-minant, birth seasonality would display little variation because annual day length is extremely consistent. These two reasons weigh heavily against photoperiod as being a prime determinant for seasonality.
0.0 20.0 40.0 60.0 80.0 100.0 120.0 140.0
1 8 15 22 29 36 43 50 57 64 71 78 85 92 99 106 113 120 127
Birth Dec
Visibility Jan
Figure 4. Manitoba/Winnipeg visibility correlated to births 11 months later, Jan 1991– Dec 2002; r = 0.6850.
Figure 5. Averaged temperature, photoperiod, visibility and seasonal births for Quebec city (1971–2000).
-15 -10 -5 0 5 10 15 20 25
60 70 80 90 100 110 120 130
Jan Feb Mar Apr May Jun Jul Aug Sep Oct Nov Dec
Avg Visibility Birth(Adjusted)
Vitamin D [25(OH)D] may be another example of another variable affecting seasonality. For example, a number of researchers suggest a link between vitamin D suficiency and human fertility (Rojansky et al. 1992; Wood et al. 2006; Lips 2006; Clark 2008; Pal et al. 2008; Ozkan et al. 2009; Bodnar et al. 2009). It seems reasonable that spring and summer time increases in vitamin D suficiency may en-hance fertility, but Canadian seasonality, for example, involves a bimodal distribu-tion of births. In Canada, there is a strong peak of concepdistribu-tions during December (Trovato and Odynak 1993) when vitamin D suficiency levels are at their lowest (Rucker et al. 2002). In fact, Rucker et al. (2002) ind that vitamin D suficiency levels are lowest in western Canada during the autumn. If vitamin D affects sea-sonality, then its inluence must be limited to the spring or summertime months, not during autumn and early winter as Canadian conceptions increase.
One strength of the brightness hypothesis is its power of prediction, an at-tribute which may explain the interannual changes in Canadian and US seasonality. Although there are considerable differences in each country’s seasonality, there are similarities as well. As a difference, in Canada, births peak occur during the spring (March–June) followed by a slightly smaller peak in September. In contrast, in the US, the spring months show a minor peak in births with the major peak coming in September/October. Both countries, however, experienced a similar seasonal transition in births. In Canada (1926–1989), the spring peak of births slightly de-clined while the September peak slightly increased (Trovato and Odynak 1993). Likewise, in the US spring births slightly declined while September births also in-creased (Rosenberg 1966). The brightness hypothesis suggests that these transitions are explained by changes in seasonal cloud cover. In North Dakota, for example, the irst half of the 20th century was sunnier than the second half, particularly the month of May. Compared to the irst half of the century, there were an average of seven fewer clear days of sunshine than during the last half. With less May sun-shine, there would have been fewer July conceptions and fewer births in March of the following year. Essentially, increased spring cloudiness may explain why there were fewer spring births in North Dakota during the last half of the 20th cen-tury. The Canadian experience seems much the same because there has been an increase in spring/summer cloudiness (cloud cover deined as 6/10 to 10/10 of dome cover) in southern Canada during the last half of the 20th century (Milewska 2004). This change is concurrent with reduced spring (March–June) births (Trovato and Odynak 1993). Transitional seasonal cloudiness may provide a simple, plausible explanation for the interannual changes in birth seasonality. To clarify, increased Canadian cloud amount (reduced visibility) during the spring and summer may re-sult in fewer births 10–11 months later (March–June) in southern Canada.
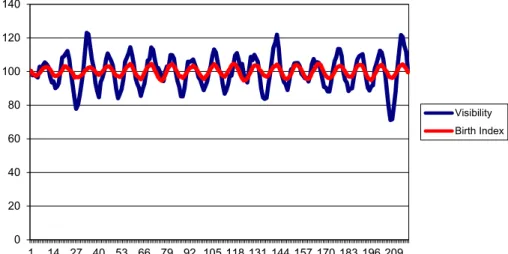
Although the primary focus of this paper concerns Canadian birth seasonal-ity, the same relationship between visibility (brightness) and birth seasonality may be seen in the neighboring border state of Minnesota during 1980–1999 (Fig. 6).
Although there are a number of strong points in the present study, there are several weaker ones as well. From a purest viewpoint, visibility data pertain to only to largest metropolitan cities while birth data represent an entire province. Seasonal visibility patterns throughout southern Canada, however, are in general agreement (Fig. 3). The primary difference may be found in the Atlantic Provinces where there is less overall visibility and with the peak brightness month in October rather than in May–July as with the other southern provinces. Most likely, much of a province has the same annual visibility pattern as its major cities.
Another disconcerting fact is that a lag exists between exposure to brightness and the its affect on conceptions several months later. It seems more intuitive that the effect should be more immediate. Perhaps, some of the delay involves the menstrual cycle. Even if most women are exposed to increased seasonal bright-ness, not all will be immediately fertile due to cycling differences. Also, to a certain degree, monthly data are imprecise. In using monthly data, it is assumed that data are evenly distributed throughout a month. This seems unlikely and may introduce bias in our assumptions. Averaging, however, over longer periods does eliminate some of these problems. Nonetheless, and for whatever reason, the data consist-ently supports a lag of several months between exposure to seasonal brightness and its ultimate affect on conceptions.
The most serious shortcoming, however, is the lack of a viable explanation to describe how brightness might actually affect fertility. By far, the bulk of re-search regarding mammalian reproduction and environmental factors has involved photoperiod, not seasonal brightness. Limited research (Danilenko and Samoilova 2007), suggests a greater role for light intensity, but much more needs to be done. It is possible that exposure to brighter morning light might synchronize menstrual cycling for a large population of women. In turn, concurrent menstrual cycling might produce a period of increased seasonal conceptions, which ultimately gives rise to seasonal births. However, there may be an easier explanation.
Figure 6. Minnesota visibility correlated to births 11 months later, Jan 1981–Jan 1999; r = 0.7924.
0 20 40 60 80 100 120 140
1 14 27 40 53 66 79 92 105 118 131 144 157 170 183 196 209
Visibility
For instance, a more practical reason may simply involve our psychological mood, or well-being. Perhaps, periods of brighter sunshine simply improve our mood, lift our spirits, and promote positive feelings about ourselves and others. Feelings of greater self-conidence may increase the frequency of intercourse, which leads to increased periods of conceptions and eventual births. There are several advantages with this explanation. First, it is unnecessary to theorize about a physiological mechanism that might promote seasonal brightness over photo-period. Second, it agrees with research that links seasonality with holidays (James 1990; Trovato and Odynak 1993; Cesario 2002) as well as studies that connect seasonality to the frequency of sexual intercourse (Rizzi and Dalla-Zuanna 2007). The major advantage, however, is that it could reconcile some of the divergent sociological and environmental viewpoints that plague seasonality research. On one hand, it is reasonable that brighter environmental light might elevate our mood and increase the frequency of sexual intercourse. For instance, the standard treatment for seasonal affective disorder (SAD) is diurnal exposure to bright light (Rosenthal el al. 1984). On the other, it is entirely plausible that vacations, or holi-day seasons, may also improve our mood and possibly lead to a greater frequency of intercourse. In both instances, there may be a deinite psychological uplift that increases the frequency of sexual intercourse, one from the environment and the other from holiday leisure time. Regardless of our inability to precisely explain how seasonal brightness might inluence seasonality, it should not be disregarded simply because the underlying causes are not fully understood.
Conclusion
Because these results conirm a direct, positive association between seasonal brightness and birth seasonality, the seasonal brightness hypothesis proved cor-rect and cannot be dismissed in Canada. Variation in seasonal brightness may be a major inluence on seasonality while other factors are secondary. Seasonal changes in atmospheric brightness offers a simple, reasonable explanation for how sea-sonality patterns vary over time. Because the hypothesis may be easily disproved, prudent researchers are encouraged to do so. Future research is recommended to determine the precise physiological means by which seasonal brightness might af-fect birth seasonality.
Acknowledgements
• To Environment Canada for visibility data for Canadian cities. • To Statistics Canada for provincial birth data.
• To National Oceanic and Atmospheric Administration (NOAA) and the Na-tional Climate Data Center (NCDC) for visibility data for Nashville, TN, USA. • To Frank Trovato for reviewing and permission to use seasonality data from
Trovato and Odynak (1993).
References
Bobak, M. and A. Gjonca. 2001. The seasonality of live birth is strongly inluenced by
socio-demographic factors. Human Reproduction 16(7):1512–7.
Bodnar, L.M., M.A. Krohn, and H.N. Simhan. 2009. Maternal vitamin D deiciency is associated with bacterial vaginosis in the irst trimester of pregnancy. The Journal of Nutrition. June: 139(6):1157–61.
Brewis, A., J. Laycock, and J. Huntsman. 1996. Birth non-seasonality on the Paciic
equator. Current Anthropoology 37:842–51.
Cesario, S. 2002. The [Christmas Effect] and other biometeorologic inluences on
childbearing and the health of women. Jounral of Obstetric, Gynecologic and Neontal
Nursing 31:526– 35. DOI: 10.1177/088421702237735.
Chandwani, K.D., I. Cech, M.H. Smolensky, K. Burau, and R.C. Hermida. 2004. Annual pattern of human conception in the state of Texas. Chronobiology International 21:73–93.
Chang, K.S.F., S.T. Chan, W.D. Low, and C.K. Ng. 1963. Climate and conception rates in Hong Kong. Human Biology 35:366–75.
Clark, A. 2008. Vitamin D Plays Major Role in Male Infertility. Oral presentation to the Fertility Society of Australia, October 21, 2008.
Cowgill, U.1966. Season of birth in man, contemporary situation with special reference to Europe and the southern hemisphere. Ecology 47:614–23.
Cummings, D.R. 2002. Theseasonality of human births, melatonin and cloud cover.
Biological Rhythm Research 33:521–59.
———. 2003. The inluence of latitude and cloud cover on the seasonality of human
births. Social Biology 50:23–41.
———. 2007. Additional conirmation for the effect of environmental light intensity on
the seasonality of human conception. Journal of Biosocial Science 39(3):383–96. DOI:
101017/S0021932006001568.
———. 2009a. Changes in European birth seasonality related to changes in regional sunshine. Biology Rhythm Research 40(2):153–68. DOI: 10.1080/09291010802067353. http://www.informaworld.com.
———. 2009b. Human birth seasonality and sunshine. American Journal Human Biology 22(3):316–24.
———. 2010. Seasonal sunshine and vitamin D: A possible explanation for differences in European and United States (US) birth patterns. Biodemography (Social Biology) Fall edn. Danilenko, K. and E.A. Samoilova. 2007. Stimulatory effect of morning bright light on
reproductive hormones and ovulation: Results of a controlled crossover trial. PLoS
Clinical Trials 92(2):e7 (published online).
de Menocal, P.B. 2004. African climate change and faunal evolution during the Pliocene-Pleistocene. Earth Planet Science Letters 3:24.
Fagan, B. 2006. Chapters 2 and 3 in People of the Earth. Upper Saddle River, NJ: Prentice Hall (ISBN 9780132274081).
Grech, V., C. Savona-Ventura, H. Agius-Muscat, and L. Janulova. 2003. Seasonality of births is associated with seasonality of marriages in Malta. Journal of Biosocial Science
35:95–105.
Greksa, L.P. 2003. Birth seasonality in the Old Order Amish. Journal of Biosocial Science
36:299–315.
Haandrikman, K. and L. van Vissen. 2008. The effects of fertility transition on birth seasonality in the Netherlands. Journal of Biosocial Science 40(5)655–72. DOI: 10.1017/ S0021932008002733.
Halli, S.S. 1989. The seasonality of births in Canada. Journal of Biosocial Science 23:321–7. Hjollund, N.H., L. Storgaard, E. Ernst, J.P. Bonde, and J. Olsen. 2002. Impact of diurnal
Huber, S. and M. Fieder. 2009. Strong association between birth month and reproductive performance of Vietnamese women. American Journal of Human Biology (Jan–Feb)
21(1):25–35. DOI: 10.1002/ajhb.20799.
James, W.H. 1990. Seasonal variation in human births. Journal of Biosocial Science 22:113–19. Lam, D.A. and J.A. Miron. 1991.Seasonality of births in human populations. Social Biology
38:51–78.
Levine, R.J. 1991. Seasonal variations in human semen quality, in Temperature and
Environmental Effects on Testis, edited by A.W. Zargniotti. New York, NY: Plenum Press.
Lerchl, M., E. Simon, and E. Nieschlag. 1993. Changes in the seasonality of birth rates in
Germany from 1951 to 1990. Naturwissenschaften 80:516–18.
Leslie, P. and P. Fry 1989. Extreme seasonality in births among nomadic Turkana pastoralists. American Journal of Physical Anthropology 79:103–15.
Lips, P. 2006. Vitamin D physiology. Progress Biophysics and Molecular Biology (Sep) 92(1):4–8. Matsuda, S. and H. Kahyo. 1994. Geographical differences and time trends in the
seasonality of birth in Japan. International Journal of Epidemiology 23:107–18.
Milewska, E.J. 2004. Baseline cloudiness trends in Canada 1953–2002. Atmosphere—Ocean
42(4):267–80.
Ozkan, S., S. Jindal, K. Greenseid, J. Shu, G. Zeitlian, C. Hickmon, and L. Pal. 2009. Replete vitamin D stores predict reproductive success following in vitro fertilization.
Fertility Sterility (Abstract, Epub ahead of print).
Pal, L., J. Shu, G. Zeitlian, and C. Hickmon. 2008. Vitamin D Insuficiency in
Reproductive Years May be Contributory to Ovulatory Infertility and PCOS. Oral presentation, 64th Annual Meeting of ASRM, San Francisco, November 11, 2008.
Pascual, J., C. Garćia-Moro, and M. Hernández. 2000. Non-seasonality of births in Tierra
del Fuego (Chile). Annals of Human Biology 27(5):517–24.
Quetelet, A. 1835. A Treatise on Man, and the Development of His Faculties. (Book First, Chapter 1, pp. 10–21)Ayer Publishing, 1968 ISBN 0833728741, 9780833728746. Rizzi, E.L. and G. Dalla-Zuanna. 2007. The seasonality of conception. Demography
44(4):705–28.
Roenneberg, T. and J. Aschoff. 1990. Annual rhythm of human reproduction: I. Biology, sociology, or both? Journal of Biological Rhythms 5:95–216.
Rojansky, N., A. Brzezinski, and J.G. Schenker. 1992. Seasonality in human reproduction: An update. Human Reproduction 7(6):735–45.
Rosenberg, H. 1966. Seasonal Variation of Births United States, 1933–63. Washington, DC: U.S. National Center for Health Statistics.
Rosenthal, N.E., D.A. Sack, J.C. Gillin, A.J. Lewy, F.K. Goodwin, Y. Davenport, P.S. Mueller, D.A. Newsome, and T.A Wehr. 1984. Seasonal affective disorder: A
description of the syndrome and preliminary indings with light therapy. Archives of General Psychiatry 41:72–80.
Rucker, D., J.A. Allan, G.H. Fick, and D.A. Hanley. 2002. Vitamin D insuficiency in
a population of healthy western Canadians. Canadian Medical Association Journal
166(12):1517–24.
Russell, D., A.S. Douglas, and T.M. Allan. 1993. Changing seasonality of births: Possible environmental effect. Journal of Epidemiological and Community Health 47:362–7. Sadleir RMFS. 1969. The Ecology of Reproduction in Wild and Domestic Animals. London:
Methuen & Co. Ltd., p. 111.
Spira, A. 1991. Epidemiologic aspects of the relationship between temperature and male reproduction, in Temperature and Environmental Effects on the Testis, edited by A.W. Zorgniotti. New York, NY: Plenum Press.
Wehr, T.A. 1998. Effect of seasonal changes in day length on human neuroendocrine function. Hormone Research 49(3–4):118–24.
Weschler, T. and S. Halli. 1992. The seasonality of births in Canada: A comparison with the northern United States. Population and Environment 14(1):85–94.
Wood, S., A. Quinn, S. Troupe, C. Kingsland, and I. Lewis-Jones. 2006. Seasonal variation
in assisted conception cycles and the inluence of photoperiodism on outcome in
vitro fertilization cycles. Human Fertility(Camb) 9(4):223–9.
Wurtman R. 1975. The effects of light on the human body. Scientiic American 233:69–77.
Appendix A. British Columbia births and Vancouver visibility
British Columbia births 1991–2007
Jan Feb Mar Apr May Jun Jul Aug Sep Oct Nov Dec
1991 3,745 3,390 3,754 3,840 4,160 3,911 4,041 3,983 3,966 3,764 3,448 3,610 1992 3,704 3,642 3,924 3,993 4,045 3,935 4,180 3,863 3,935 3,718 3,549 3,668 1993 3,629 3,483 3,975 3,872 4,150 3,937 4,127 3,780 3,980 3,841 3,550 3,702 1994 3,698 3,517 3,980 4,028 4,225 3,994 4,161 3,983 4,105 3,849 3,715 3,743 1995 3,664 3,603 3,959 3,857 4,305 4,056 4,082 4,155 4,149 3,856 3,606 3,528 1996 3,812 3,636 4,102 3,873 4,187 3,867 4,017 3,864 3,902 3,793 3,420 3,665 1997 3,693 3,410 3,795 3,855 4,066 3,834 3,910 3,776 3,735 3,641 3,329 3,533 1998 3,547 3,328 3,733 3,657 3,768 3,630 3,784 3,633 3,677 3,609 3,304 3,402 1999 3,413 3,195 3,635 3,615 3,752 3,568 3,766 3,442 3,574 3,423 3,208 3,348 2000 3,376 3,180 3,606 3,493 3,551 3,638 3,568 3,428 3,382 3,266 3,167 3,017 2001 3,455 3,020 3,466 3,498 3,605 3,495 3,549 3,504 3,391 3,301 3,104 3,187 2002 3,255 2,978 3,372 3,416 3,569 3,306 3,476 3,452 3,542 3,434 3,089 3,176 2003 3,263 3,086 3,464 3,386 3,586 3,580 3,519 3,365 3,510 3,437 3,133 3,167 2004 3,186 3,060 3,494 3,444 3,467 3,423 3,414 3,512 3,467 3,455 3,256 3,311 2005 3,388 2,976 3,397 3,383 3,546 3,526 3,503 3,595 3,647 3,463 3,247 3,156 2006 3,368 2,967 3,523 3,379 3,668 3,676 3,661 3,576 3,714 3,519 3,354 3,324 2007 3,421 3,154 3,533 3,544 3,788 3,791 3,778 3,989 3,810 3,807 3,531 3,503
Vancouver visbility 1991–2004
Visibility ceiling >= 762 m (2500 ft), range >= 8.04 km (5 mi)
Jan Feb Mar Apr May Jun Jul Aug Sep Oct Nov Dec
opulation
39, No
. 1–2 (Spring/Summer 2012)
62