DOI: http://dx.doi.org/10.1590/2446-4740.0805
*e-mail: [email protected]
Received: 05 June 2015 / Accepted: 14 October 2015
The inluence of subcutaneous fat in the skin temperature variation
rate during exercise
Eduardo Borba Neves*, Tiago Rafael Moreira, Rui Jorge Lemos, José Vilaça-Alves, Claudio Rosa, Victor Machado Reis
Abstract Introduction: Thermography records the skin temperature, which can be inluenced by: muscle mass and subcutaneous fat layer. Thus, the aim of this study was to investigate the inluence of subcutaneous fat layer in the skin temperature variation rate, during exercise. Methods: This is a short-longitudinal study that involved 17 healthy male trained volunteers. Volunteers were divided in two groups. The irst called GP1 with nine volunteers (biceps brachii skinfold thickness < 4 mm) and the second called GP2 with eight volunteers (biceps brachii skinfold thickness from 4 to 8 mm). Both groups performed three sets with 16 repetitions of unilateral biceps brachii bi-set exercise with dominant arm (eight repetitions of biceps curls and another eight of biceps hammer curls, with dumbbells), and with load of 70% of 1RM. The rest time between sets was 90s. Results: The skin temperature variation rate (variation of temperature / time) was 3.59 × 10⁻³ ± 1.47 × 10⁻³ °C/s for GP1 and 0.66 × 10⁻³ ± 4.83 × 10⁻³ °C/s for GP2 (p = 0.138) considering all moments. For the period after set 1 until the end of set 3, skin temperature variation rate was 5.11 × 10⁻³ ± 2.57 × 10⁻³ °C/s for GP1 and 1.88 × 10⁻³ ± 3.60 × 10⁻³ °C/s for GP2 (p = 0.048). Subcutaneous fat layer also inluences the skin temperature at resting (p = 0.044). Conclusion: Subjects with lower subcutaneous fat layer have a higher skin temperature variation rate during exercise than those with higher subcutaneous fat layer.
Keywords: Thermography, Subcutaneous fat, Skin temperature, Exercise.
Introduction
Researchers have developed new applications for technology already used for diagnostic purposes, with a view to expanding its use to other areas beyond the primary development area of the product (Neves et al., 2010; 2013).
Diagnostic tools for image have been increasingly used by health professionals to carry out (Ripka et al., 2012; Vacari et al., 2013) or complement the diagnosis (Perin et al., 2012). Some authors also propose the combined use of images generated by different technologies (Sanches et al., 2013).
The thermography has been developed in the two last decades and being applied in the sports medicine and medical ields. Thermal imaging have been used for diagnosis of sports injuries (Bandeira et al., 2014) and injuries after strength training (Bandeira et al., 2012). Recently, researchers have investigated the thermal response during and after exercise (Chudecka and Lubkowska, 2012; Merla et al., 2010). However, this response depends on some variables such as: itness level (Formenti et al., 2013), muscle mass in the region of interest (Neves et al., 2015a), subcutaneous fat (Bandeira et al., 2012), type and intensity of exercise (Neves et al., 2015b; 2015c).
The subcutaneous fat layer can inluence the uptake of biological signals such as: electromyography signals and mechanomyography signals (Krueger et al., 2013). Although some authors (Bandeira et al., 2012; Formenti et al., 2013) have reported that subcutaneous fat layer has some inluence on the skin temperature, were not presented quantitative data regarding this inluence. One variable investigated to understand the local thermal response during exercise is the skin temperature variation rate. Authors (Chudecka and Lubkowska, 2012; Formenti et al., 2013) have related this variable with the itness level without regarding the inluence of the subcutaneous fat layer of the region of interest. In this sense, the aim of this study was to investigate the inluence of subcutaneous fat layer in the skin temperature variation rate, during exercise.
Several studies report the inluence of subcutaneous fat layer on the skin temperature and its inluence on the dissipation of body heat (Bandeira et al., 2012; Chudecka and Lubkowska, 2012; Savastano et al., 2009); however they did not perform group stratiication by subcutaneous fat layer of the active muscle region. And yet, the body thermal response varies according to each body region, each muscle group
and according to the type and intensity of exercise (Neves et al., 2015d). There were no studies that evaluated the temperature change rate during exercise of high intensity and energy demand predominantly anaerobic with the arm lexors. In this sense, this work can be considered unprecedented for evaluating the temperature change rate during a high intensity and energy demand predominantly anaerobic exercise with this muscle group.
Methods
Study design and sample
This is a short-longitudinal study that involved 17 healthy male trained volunteers. The volunteers were selected among customers of two bodybuilding gyms of Guimarães city, Portugal. The inclusion criterion was the agreement of the volunteer to stay without physical activities during data collection period (two weeks). All volunteers signed the Term of free and informed consent and the study protocol was approved by Human Research Ethics Committee of Campos de Andrade University Center under CAAE number 28901414.3.0000.5218. The anthropometric characteristics of the sample were presented formatted as average ± standard deviation (SD): age of 24.69 ± 2.12 years; weight of 75.27 ± 9.79 kg, height of 1.77 ± 0.08 meters and biceps brachii skinfold thickness of 4.09 ± 1.52 millimeters.
Experimental protocol
The volunteers were divided in two groups. The irst called GP1 with nine volunteers (biceps brachii skinfold thickness < 4 mm) and the second called GP2 with eight volunteers (biceps brachii skinfold thickness from 4 to 8 mm). Both groups performed the same exercise protocol of strength training.
The one-repetition maximum (1RM) was determined seven days before the experimental day. The 1RM test
was performed according to the protocol described by Kraemer and Fry (1995). All volunteers performed two sessions of 1RM test with interval of one week between sessions. No exercise was performed between the 1RM tests.
At experimental day, a week after the 1RM tests, volunteers stayed for 15 minutes in an acclimatized room with temperature of 24 °C ± 0.3 °C to reach thermal balance before the images acquisition (Bandeira et al., 2014). After acclimation, both groups performed three sets (set 1, set 2 and set 3) with 16 repetitions of unilateral biceps brachii bi-set exercise (Foschini and Prestes, 2007) with dominant arm (eight repetitions of biceps curls and another eight of biceps hammer curls, with dumbbells) with load of 70% of 1RM. Where “set 1” = the irst set of exercise; “set 2” = the second set of exercise; and “set 3” = the third set of exercise. A metronome was used adjusted to 60 bpm and the volunteers were instructed to maintain a constant velocity of 1 second in the concentric phase and 1 second in the eccentric phase. The rest time between sets was 90s. Thermal images were acquired in the following moments: before set 1, after set 1, after set 2, after set 3. Figure 1 illustrates thermal images acquired before set 1 and after set 3 from a typical volunteer.
Instrumentation and data acquisition
It was used a term digital hygrometer to monitor the temperature and humidity of the room. Thermal images were acquired from both arms (biceps brachii was the region of interest) using an infrared camera (FLIR Systems Inc. Model SC2000). This camera has a high resolution (320 × 240 pixels), which measures temperatures ranging from –20 °C to +120 °C, able to detect differences of less than 0.1 °C temperature and provides accuracy of ± 1 °C of the absolute temperature.
Ultrasonographic images from the midpoint of biceps brachii (Neves et al., 2015b) were recorded
using an Aloka SSD 500V real time scanner equipped with a linear probe of 7.5 MHz, in order to evaluate the biceps brachii skinfold thickness (Neves et al., 2013).
Data processing and statistical analysis
All acquired images were analyzed by FLIR ThermaCamTM Researcher Pro 2.9 software. The software
was set to treat the image with background temperature of 22 °C and emissivity of 0.98 and in the color palette midgreen (Bandeira et al., 2014; Neves et al., 2015c).
Shapiro-Wilk test (Razali and Wah, 2011) was performed to exam the variables distribution and descriptive statistics (average and standard deviation) were used to summarize the characteristics of the study sample, Pearson (r) correlation analysis (Wang, 2013) was used for evaluation of association between skinfold thickness and skin temperature. Tendency lines and itting equations (Mitchell-Olds and Shaw, 1987) were used to analyze the skin temperature variation rate. The Student t test for independent samples (Ruxton, 2006) was used to compare the variables between both studied groups. The Statistical analyses were performed with Statistical Package for Social Sciences (SPSS, version 21.0). The statistical signiicance level was deined as p < 0.05.
Results
All variables showed Gaussian distribution in Shapiro-Wilk test output. Table 1 shows the variables assessed by each group and result of t test.
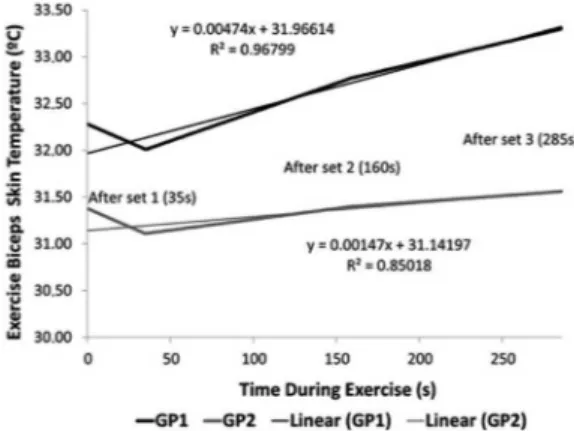
The results presented in Table 1 ensure comparability between groups, pointing to the biceps brachii skinfold thickness (measurement of subcutaneous fat layer) as the independent variable in this experiment. Figure 2 shows the behavior of the exercise biceps skin temperature in each group and the itting lines.
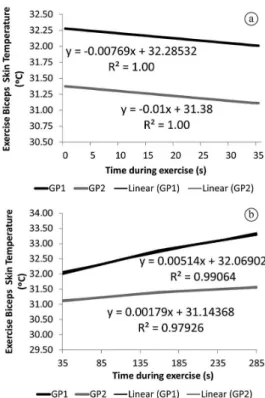
To better understand the thermal behavior in response to strength training, the Figure 3 presents the thermal curve divided in two stages. The stage A corresponds to the initial response to the exercise when occurs a skin temperature reduction due an action of redirecting blood low to the active muscles, generated by a relex cutaneous vasoconstriction. And, the stage B corresponds to the dissipation of muscle heat through the skin.
Figure 2 shows a large difference in the skin temperature between both groups even before set 1. The GP1 presented a higher temperature than the GP2. This difference showed statistical signiicance (p = 0.044) when tested by t test.
Figure 3 allows a graphical analysis of curve inclination (it line), which correspond to skin temperature variation rate of each group.
Table 1. Results of the Student t test for variables that ensure the comparability of the groups (GP1, n = 9, biceps skinfold thickness < 4 mm and GP2, n = 8, biceps skinfold thickness from 4 to 8 mm).
Variable Group Average SD p value
Age (years) GP1 25.50 2.33 0.129
GP2 23.88 1.64
Weight (kg) GP1 72.43 11.16 0.311
GP2 77.75 8.36
Height (m) GP1 1.80 0.12 0.284
GP2 1.75 0.04
70% 1RM (kg) GP1 12.22 2.11 0.402
GP2 11.38 1.92
Elbow Flexors* Muscle Thickness (mm) GP1 31.00 3.87 0.771
GP2 31.50 2.93
Biceps Brachii Skinfold Thickness (mm) GP1 2.889 0.22 <0.001
GP2 5.438 1.15
*Elbow Flexors = Biceps Brachii and Brachii muscles.
for the stage B, the temperature increase rate was 5.11 × 10⁻³ ± 2.57 × 10⁻³ °C/s for GP1 and 1.88 × 10⁻³ ± 3.60 × 10⁻³ °C/s for GP2 (p = 0.048).
Considering all volunteers (n = 17), the correlation coeficient between biceps brachii skinfold thickness and biceps brachii skin temperature before exercise (at rest) was (r = –0.513, p = 0.035).
Figure 4 shows the behavior of the control biceps skin temperature in each group and the itting line.
Discussion
The Table 1 shows the results of t test for ive variables (Age, weight, height, 70% 1RM and Elbow Flexors Muscle Thickness) that presented similar values in both groups. These variables ensure comparability between GP1 and GP2, because these are variables that could inluence the skin temperature (Neves et al., 2015a; 2015c; Neves and Reis, 2014). Thus, the biceps brachii skinfold thickness is the only variable that differentiates the two groups.
The results showed that the exercise biceps skin temperature decreases during the stage A (between the start and the end of the irst set of exercise), and increases continuously in stage B. On the other hand, it was observed a decrease in control biceps skin temperature from the moment before set 1 to after set 3.
In the present study all volunteers were trained, and the results suggest that GP1 (subjects with lower subcutaneous fat layer) have a higher skin temperature variation rate (n = 9, 5.11 × 10⁻³ ± 2.57 × 10⁻³ °C/s)
during exercise than GP2 (1.88 × 10⁻³ ± 3.60 × 10⁻³ °C/s).
Formenti et al. (2013) conducted a study comparing the temperature increase rate during exercise between trained and untrained subjects. The authors observed higher values in the trained group (n = 7, 0.009 ± 0.002 °C/s) than in untrained ones (n = 7, 0.004 ± 0.001 °C/s), although had no control of the subcutaneous fat layer of the studied region. Authors (Chudecka et al., 2014; Guyton and Hall, 2011) report that fat acts as a good insulator because it has a low thermal conductivity.
The results also suggest that the thickness of the subcutaneous fat layer inluences the skin temperature at resting (p = 0.044) and the skin temperature variation rate during exercise (p = 0.048). Other authors (Chudecka and Lubkowska, 2012) studied the skin temperature variation in response to prolonged exercise (90 minutes) involving other heat dissipation mechanism (sweat), and reported the importance of considering the subcutaneous fat layer in thermographic assessments, but without presenting quantitative data about this variable. Authors (Bandeira et al., 2012; Savastano et al., 2009) have presented data correlations between the subcutaneous fat layer
Figure 3. Behavior of the exercise biceps skin temperature during three sets of unilateral biceps curl exercise, divided in two stages: (a) from beginning until 35 seconds (“before” to “after set 1”); and (b) from 35 seconds to 285 seconds of exercise (“after set 1” to “after set 3”). GP1 (n = 9, biceps brachii skinfold thickness < 4 mm) and GP2 (n = 8, biceps brachii skinfold thickness from 4 to 8 mm), and the it line with it equation. Where “set 1” = the irst set of exercise; “set 2” = the second set of exercise; and “set 3” = the third set of exercise. The rest among the sets was 30 seconds.
Figure 4. Behavior of the control biceps skin temperature during three sets of unilateral biceps curl exercise, in GP1 (n = 9, biceps brachii skinfold thickness < 4 mm) and GP2 (n = 8, biceps brachii skinfold thickness from 4 to 8 mm). Where “set 1” = the irst set of exercise; “set 2” = the second set of exercise; and “set 3” = the third set of exercise. The rest among the sets was 30 seconds.
and skin temperature, but did not evaluate the skin temperature variation rate during the exercise.
A study published in 2012 reported signiicant correlation between thigh skin temperature and thigh skinfold thickness (r = –0.488, p = 0.020) over rectus femoral muscle, in volunteers with a thigh skinfold thickness average of 11.40 (Bandeira et al., 2012). Another research (Savastano et al., 2009) investigated the difference of skin temperature in the abdominal region in two groups (obese and normal weight) and noticed that the correlation (r) between abdominal skin temperature and body fat percentage was 0.545, and the abdominal skin temperature of obese group was lower than in normal-weight group. These results agree with the indings of the present study that was r = –0.513, p = 0.035, between biceps brachii skinfold thickness and biceps skin temperature before set 1.
Figure 4 shows that the control biceps skin temperature tended to decrease while the exercise biceps skin temperature tended to increase, during exercise performance. This response occurred similarly in both groups. Others authors (Fernandes et al., 2014; Formenti et al., 2013) studied the thermal response during aerobic exercises and reported that ROIs which were not directly involved in exercise present a decrease in skin temperature. It occurred due to a cutaneous vasoconstriction relex that redirecting blood low to the active muscles. This relex also was observed in exercise biceps ROI, during the initial stage of exercise (called “stage A” in this study, Figure 3a).
It can be concluded that subcutaneous fat layer acts as a thermal barrier against muscle heat dissipation and that the subjects with lower subcutaneous fat layer has a higher skin temperature variation rate (5.11 × 10⁻³ ± 2.57 × 10⁻³ °C/s) during exercise
than those with higher subcutaneous fat layer (1.88 × 10⁻³ ± 3.60 × 10⁻³ °C/s).
With regard the study limitations, these indings can be generalized to men with reduced subcutaneous fat layer (< 10 mm) and high muscle thickness (> 25 mm), because in others samples, i.e. in women or men with small muscle volume and large subcutaneous fat layer the indings can be different. These indings lead to an alert to the planning of future studies regarding the inclusion of subcutaneous fat layer as a covariable during statistical analysis, since it inluences the speed of heat transfer from the muscle to the skin surface.
Acknowledgements
We would like to thank Brazilian Army and Brazilian Counsel of Technological and Scientiic Development (CNPq) by the Eduardo B. Neves scholarship and inancial support.
References
Bandeira F, Moura MAM, Souza MA, Nohama P, Neves EB. Pode a termografia auxiliar no diagnóstico de lesões musculares em atletas de futebol? Revista Brasileira de Medicina do Esporte. 2012; 18(4):246-51. http://dx.doi. org/10.1590/S1517-86922012000400006.
Bandeira F, Neves EB, Moura MAM, Nohama P. A termografia no apoio ao diagnóstico de lesão muscular no esporte. Revista Brasileira de Medicina do Esporte. 2014; 20(1):59-64. http://dx.doi.org/10.1590/S1517-86922014000100012. Chudecka M, Lubkowska A, Kempińska-Podhorodecka A. Body surface temperature distribution in relation to body composition in obese women. Journal of Thermal Biology. 2014; 43:1-6. http://dx.doi.org/10.1016/j.jtherbio.2014.03.001. PMid:24956951.
Chudecka M, Lubkowska A. The use of thermal imaging to evaluate body temperature changes of athletes during training and a study on the impact of physiological and morphological factors on skin temperature. Human Movement. 2012; 13(1):33-9. http://dx.doi.org/10.2478/v10038-012-0002-9. Fernandes AA, Amorim PRS, Brito CJ, Moura AG, Moreira DG, Costa CMA, Sillero-Quintana M, Marins JCB. Measuring skin temperature before, during and after exercise: a comparison of thermocouples and infrared thermography. Physiological Measurement. 2014; 35(2):189-203. http:// dx.doi.org/10.1088/0967-3334/35/2/189. PMid:24398429. Formenti D, Ludwig N, Gargano M, Gondola M, Dellerma N, Caumo A, Alberti G. Thermal imaging of exercise-associated skin temperature changes in trained and untrained female subjects. Annals of Biomedical Engineering. 2013; 41(4):863-71. http://dx.doi.org/10.1007/s10439-012-0718-x. PMid:23229282.
Foschini D, Prestes J. Respostas hormonais e imunes agudas decorrentes do treinamento de força em Bi-Set. Fitness & Performance Journal. 2007; 6(1):38-44.
Guyton A, Hall J. Tratado de fisiologia médica. 12th ed. Rio de Janeiro: Elsevier; 2011.
Kraemer W, Fry A. Strength testing: development and evaluation of methodology. In: Maud P, Foster C, editors. Physiological assessment of human fitness. Champaign: Human Kinetics; 1995. p. 115-38.
Krueger E, Scheeren EM, Nogueira-Neto GN, Neves EB, Button VLS, Nohama P. Influence of skinfold thickness in mechanomyography features. In: Proceedings of the World Congress on Medical Physics and Biomedical Engineering; 2012 May 26-31; Beijing, China. Heidelberg: Springer; 2013. p. 2030-3.
Merla A, Mattei PA, Di Donato L, Romani GL. Thermal imaging of cutaneous temperature modifications in runners during graded exercise. Annals of Biomedical Engineering. 2010; 38(1):158-63. http://dx.doi.org/10.1007/s10439-009-9809-8. PMid:19798579.
Neves EB, Bandeira F, Ulbricht L, Vilaça-Alves J, Reis VM. Influence of muscle cross-sectional area in skin temperature. In: Proceedings of the 2nd International Conference on Bioimaging – BIOIMAGING 2015 and 8th International Joint Conference on Biomedical Engineering Systems and Technologies – BIOSTEC 2015; 2015 Jan 12-15; Lisboa, Portugal. Heidelberg: Springer; 2015a. p. 64-8.
Neves EB, Moreira TR, Lemos R, Vilaça-Alves J, Rosa C, Reis VM. Using skin temperature and muscle thickness to assess muscle response to strength training. Revista Brasileira de Medicina do Esporte. 2015b; 21(5):350-4.
Neves EB, Moreira TR, Lemos RJCA, Vilaça-Alves J, Reis VM. The thermal response of biceps brachii to strength training. Gazzetta Medica Italiana Archivio per le Scienze Mediche. 2015c; 174. In press.
Neves EB, Vilaça-Alves J, Antunes N, Felisberto IMV, Rosa C, Reis VM. Different responses of the skin temperature to physical exercise: systematic review. In: Proceedings of the 37th Annual International Conference of the IEEE Engineering in Medicine and Biology Society; 2015 Aug 25-29; Milan, Italy. Piscataway: EMBS; 2015d. p. 1307-10. Neves EB, Pino AV, Almeida RMVR, Souza MN. Knee bioelectric impedance assessment in healthy/with osteoarthritis subjects. Physiological Measurement. 2010; 31(2):207-19. http://dx.doi.org/10.1088/0967-3334/31/2/007. PMid:20016115. Neves EB, Reis VM. Fundamentos da termografia para o acompanhamento do treinamento desportivo. Revista Uniandrade. 2014; 15(2):79-86. http://dx.doi.org/10.18024/1519-5694/ revuniandrade.v15n2p79-86.
Neves EB, Ripka WL, Ulbricht L, Stadnik AMW. Comparison of the fat percentage obtained by bioimpedance, ultrasound and skinfolds in young adults. Revista Brasileira de Medicina do Esporte. 2013; 19(5):323-7. http://dx.doi.org/10.1590/ S1517-86922013000500004.
Perin A, Ulbricht L, Ricieri DV, Neves EB. Use of biophotogrammetry for assessment of trunk flexibility. Revista Brasileira de Medicina do Esporte. 2012; 18(3):176-80. http://dx.doi.org/10.1590/S1517-86922012000300008. Razali NM, Wah YB. Power comparisons of shapiro-wilk, kolmogorov-smirnov, lilliefors and anderson-darling tests. Journal of Statistical Modeling and Analytics. 2011; 2(1):21-33. Ripka W, Ricieri D, Ulbricht L, Neves E, Stadnik A, Romaneli E. Biophotogrammetry model of respiratory motion analysis applied to children. In: Proceedings of the 34th Annual International Conference of the IEEE Engineering in Medicine and Biology Society; 2012 Aug 28-Sept 1; San Diego, USA. Piscataway: EMBS; 2012. p. 2404-7. Ruxton GD. The unequal variance t-test is an underused alternative to student’s t-test and the mann-whitney u test. Behavioral Ecology. 2006; 17(4):688-90. http://dx.doi. org/10.1093/beheco/ark016.
Sanches IJ, Gamba HR, Souza MA, Neves EB, Nohama P. Fusão 3D de imagens de MRI/CT e termografia. Revista Brasileira de Engenharia Biomédica. 2013; 29(3):298-308. http://dx.doi.org/10.4322/rbeb.2013.031.
Savastano DM, Gorbach AM, Eden HS, Brady SM, Reynolds JC, Yanovski JA. Adiposity and human regional body temperature. The American Journal of Clinical Nutrition. 2009; 90(5):1124-31. http://dx.doi.org/10.3945/ ajcn.2009.27567. PMid:19740972.
Vacari DA, Ulbricht L, Schneider FK, Neves EB. Principais métodos de diagnóstico postural da coluna lombar. Revista da Educação Física. 2013; 24(2):305-15.
Wang J. Pearson correlation coefficient. In: Dubitzky W, Wolkenhauer O, Cho K-H, Yokota H, editors. Encyclopedia of systems biology. Heidelberg: Springer; 2013. p. 1671.
Authors
Eduardo Borba Neves1,2,3*, Tiago Rafael Moreira1, Rui Jorge Lemos1, José Vilaça-Alves1,4, Claudio Rosa1, Victor Machado Reis1,4
1 Sports Science Department, Universidade de Trás-os-Montes e Alto Douro, Apartado 1013, 5001-801, Vila Real, Portugal.
2 Graduate Program in Biomedical Engineering, Universidade Tecnológica Federal do Paraná – UTFPR, Curitiba, PR, Brazil.
3 Brazilian Army, Centro de Capacitação Física do Exército – CCFEx/FSJ, Brasília, DF, Brazil.