in Eurasian Perch (
Perca fluviatilis
)
Pia Bartels*¤, Philipp E. Hirsch, Richard Svanba¨ck, Peter Eklo¨v
Department of Ecology and Genetics, Limnology, Uppsala University, Uppsala, Sweden
Abstract
Trait combinations that lead to a higher efficiency in resource utilization are important drivers of divergent natural selection and adaptive radiation. However, variation in environmental features might constrain foraging in complex ways and therefore impede the exploitation of critical resources. We tested the effect of water transparency on intra-population divergence in morphology of Eurasian perch (Perca fluviatilis) across seven lakes in central Sweden. Morphological divergence between near-shore littoral and open-water pelagic perch substantially increased with increasing water transparency. Reliance on littoral resources increased strongly with increasing water transparency in littoral populations, whereas littoral reliance was not affected by water transparency in pelagic populations. Despite the similar reliance on pelagic resources in pelagic populations along the water transparency gradient, the utilization of particular pelagic prey items differed with variation in water transparency in pelagic populations. Pelagic perch utilized cladocerans in lakes with high water transparency and copepods in lakes with low water transparency. We suggest that under impaired visual conditions low utilization of littoral resources by littoral perch and utilization of evasive copepods by pelagic perch may lead to changes in morphology. Our findings indicate that visual conditions can affect population divergence in predator populations through their effects on resource utilization.
Citation:Bartels P, Hirsch PE, Svanba¨ck R, Eklo¨v P (2012) Water Transparency Drives Intra-Population Divergence in Eurasian Perch (Perca fluviatilis). PLoS ONE 7(8): e43641. doi:10.1371/journal.pone.0043641
Editor:William J. Etges, University of Arkanas, United States of America ReceivedMarch 8, 2012;AcceptedJuly 23, 2012;PublishedAugust 17, 2012
Copyright:ß2012 Bartels et al. This is an open-access article distributed under the terms of the Creative Commons Attribution License, which permits unrestricted use, distribution, and reproduction in any medium, provided the original author and source are credited.
Funding:This study was financed by grants from the Swedish Research Council for Environment, Agricultural Sciences, and Spatial Planning (FORMAS) to PB and PE, the Swedish Research Council (VR) to PE and RS, the Uppsala Graduate School to PEH, and the Malme´ns Foundation to PB and PEH. The funders had no role in study design, data collection and analysis, decision to publish, or preparation of the manuscript.
Competing Interests:The authors have declared that no competing interests exist. * E-mail: [email protected]
¤ Current address: Department of Ecology and Environmental Science, Umea˚ University, Umea˚, Sweden
Introduction
Differences in habitat and resource use have long been viewed as a major cause of phenotypic divergence within and between species. This is because different environments require adaptations of behavioral, morphological, or life history traits [1] which increase the individuals fitness and may ultimately lead to adaptive radiation and ecological speciation [2]. In particular, the exploitation of different resources is thought to drive population divergence through resource polymorphism [2] leading to a correlation between trophic traits and feeding efficiency on specific resources [3,4]. Trophic polymorphism is common [2] as seen, for example, in the adaptive variation in beak morphology in Darwin’s finches [5] or the feeding morphology in some African cichlids [6].
Aquatic ecosystems are greatly susceptible to environmental change following natural or anthropogenic activities. In particular, water transparency is affected by multiple processes. For instance, elevated sediment loading from the watershed or sediment re-suspension can increase sedimentary turbidity, which is acknowl-edged as a major environmental problem [7]. During eutrophica-tion, turbidity can also increase due to enhanced phytoplankton growth [8]. Increasing brown coloration due to elevated inputs of dissolved organic matter (DOM) can further decrease water transparency and this ‘‘brownification’’ has been progressively observed in lakes in the Northern Hemisphere [9,10]. A decrease in
Changes in water transparency can additionally affect impor-tant properties of aquatic ecosystems that likely influence the exploitation of critical habitats or resources, resulting in variation in phenotypic divergence. Water transparency has repeatedly been shown to affect littoral primary production [19,20]. For instance, eutrophication has been demonstrated to impede benthic energy pathways through enhanced pelagic productivity [21]. Similarly, decreasing light penetration through the water column due to enhanced input of terrestrial organic matter can hamper benthic productivity [22]. Irrespective of the cause of the reduction, decreased benthic productivity likely limits the amount of benthic resources that can be used by fish. Changes in the availability of critical resources due to alterations in habitat productivity might affect resource exploitation, and thus population divergence.
Eurasian perch (Perca fluviatilis) displays a continuous phenotypic variation in relation to habitat and resource use where more streamlined individuals feeding mainly on pelagic resources are found in the pelagic zone and deeper bodied individuals that utilize benthic resources in the littoral zone [23,24]. Moreover, Ljunggren and Sandstro¨m [13] showed that perch forging is strongly affected by water transparency, suggesting that water transparency can indirectly influence morphological divergence through its effect on foraging. Here, we used seven lakes in central Sweden to investigate the effect of water transparency on morphological divergence in perch. Our major objective was to examine whether water transparency affects phenotypic diver-gence in a predatory fish by modifying its foraging behavior. In particular we investigated two hypotheses and predicted that: i) intra-population divergence would be stronger at high water transparency due to the availability of alternate habitats and resources, and ii) intra-population divergence would be low in lakes with low water transparency due to higher similarity of resource use by pelagic and littoral perch.
Methods
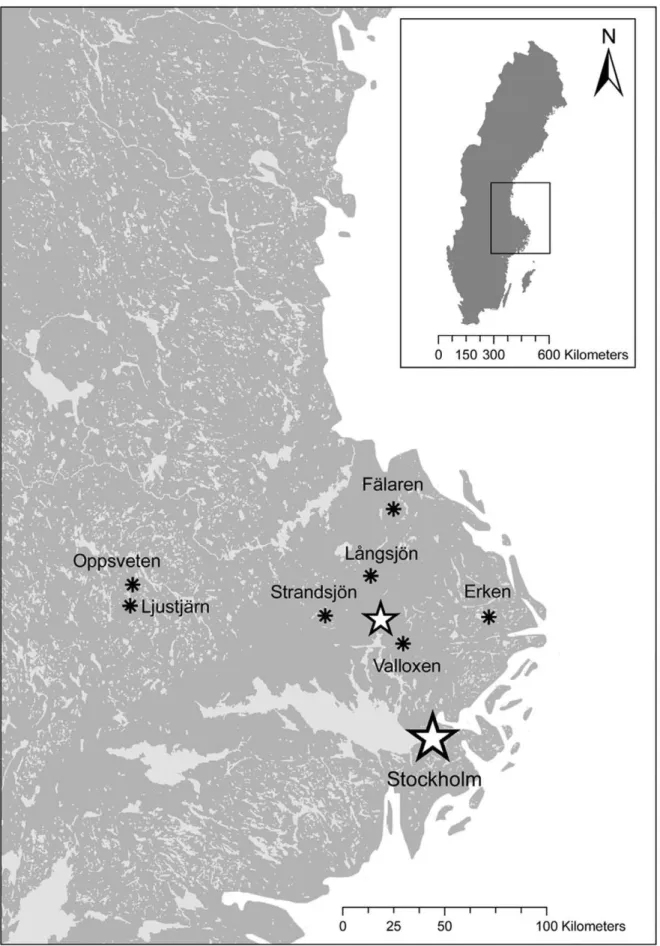
We conducted a field survey in seven Swedish lakes (Figure 1, Table 1). All necessary permits were obtained for the described field study. No specific permissions were required for five lakes since the lakes were not privately owned or protected. The access of two lakes (La˚ngsjo¨n, Valloxen) was situated on private land, and we obtained access permission from the landowner. For each lake, we calculated the shoreline index as an approximation of the littoral zone [25]. Perimeter and area of each lake were estimated using GIS (ArcGis 9.1, ESRI). Our lake survey contained both turbid (n = 1) and brown-colored humic (n = 3) lakes therefore we used water transparency as a comparable measurement for visual conditions among lakes. Water transparency is a measure of how clear or transparent the water is and depends on both watercolor and light scattering. We used Secchi depth as it is one of the most commonly used tools to measure water transparency [26]. We used standardized multi-mesh gill nets (littoral nets: 3061.5 m;
pelagic nets: 27.566 m) to estimate relative biomass and species
composition in the littoral and pelagic habitats of each lake. Fish were measured to the nearest 1 mm (total length), weighed to the nearest 0.1 g, and stored frozen at220uC until further analyses. To estimate the condition of fish, we calculated the Fulton’s condition factor (weight6length23).
Zooplankton were sampled with a 100mm-mesh net (Ø 25 cm) and samples were preserved with Lugol’s solution. In the littoral zone, the net was towed horizontally for approximately 2 m parallel to the shoreline, whereas in the pelagic zone, one vertical tow was made at the deepest point from approximately 1 m above the sediment to the surface. Three samples were taken each in the
littoral and pelagic habitat to account for spatial variability. Zooplankton were counted, measured, and identified. Individuals were categorized into (1) cladocerans, (2) copepods, and (3) other (mainlyChaoborussp. and rotifers). Biomass was calculated using published mass-length relationships [27].
Macrozoobenthos was sampled with a core sampler (Ø 60 mm, UWITECH, Vienna, Austria). Four samples were taken to account for potential spatial variability in the littoral (approx. 1 m depth) and the profundal zone (approx. at maximum depth). Only the upper 5 cm of the sediment were used for analyses. Samples were sieved using a 0.5-mm net, preserved in 70% ethanol and stained with Bengal rose. In the laboratory, macroinvertebrates were counted, measured, and identified to lowest possible taxonomic level. Biomass (dry weight) was calculated using published mass-length relationships [28–30]. The field study did not involve endangered or protected species.
To evaluate the effect of water transparency and lake depth on resource composition, we used permutational multivariate analysis of variance (‘‘perm MANOVA’’; ref [31]) with Secchi depth or maximum lake depth as predictors and littoral and pelagic resource composition, respectively, as response variables.
Morphological Analyses
Perch morphology was analyzed using landmark-based thin-plate spline (TPS) analysis, a geometric morphometrics technique [32]. We used the programs TPS-dig2, TPS-relw, and TPS-regr for all morphological analyses (available at http://life.bio.sunysb. edu/morph/index.html). All fish were thawed and photographed on the left side. Subsequently, we analyzed the morphology using 16 landmarks digitized with TPS-dig2 for each image (Figure 2). Perch morphology was analyzed in the same way as we have described previously [23,33]. In short, we used the digitized landmarks to analyze the relative position of each landmark and variation in body shape using TPS-relw by calculating partial warps and uniform scores for each individual [34]. TPS-relw transforms all specimens to a centroid size to avoid differences in landmarks due to body size. The uniform shape components parameterize all shape variation that is uniform throughout the whole geometry. The partial warps measure non-uniform shape variation that is localized to particular regions of the geometry. The differences in morphology of perch were analyzed among lakes and between littoral and pelagic habitats separately for each lake. The partial warps and uniform scores were analyzed with a discriminant function analysis (DFA). The DFA combines all partial warps and uniform scores for each fish into n-1 functions (morphological indices) that maximally discriminate between the groups where n is the number of classification levels. To compare perch morphology across lakes, we combined the partial warps and uniform scores from all fish in one DFA and based the classification on lakes (n = 7). To compare perch morphology between habitats, we analyzed the partial warps and uniform scores separately for each lake and based the classification in the DFA on habitat (n = 2). TPS-regr was used to visualize the differences in body shape of perch [35]. To test for differences between habitats, we used linear mixed effect models (LME) with the DFA scores as response variable, habitat as fixed effect and lake nested in habitat as random effect.
Figure 1. Map of surveyed lakes.Location of the seven lakes included in the field survey. The small star represents the location of Uppsala. Copyright Lantma¨teriet Ga¨vle (2010): Permission I 2010/0058.
our model. R2Y is comparable to the R2in linear regressions. Q2is a measure of the predictive power of the model (the closer Q2is to R2Y, the higher the predictive power). We used the variable influence on projection (VIP) to estimate the influence of every X-variable on the Y-component (morphological divergence; Table S1). The VIP scores for every X-variable are cumulative across components and weighted according to the amount of Y-variance explained by each component [36]. X-variables with VIP.1 were considered most influential for the models. To evaluate the relationship between morphological divergence and predictors with VIP.1, we used regression models. For each model, we calculated the second-order or small sample Akaike’s information criterion (AICc; ref [37,38]) as an estimation of model fit which corrects for sample size and model complexity [39]. In the model selection, we tested each predictor independently with increasing model complexity (i.e. from a linear to a polynomial model). This was done until AICc reached minimal values. A model was considered more likely whenDAICc$4 [39].
Stable Isotope Analyses
We used stable isotope analyses to estimate the resource utilization from littoral and pelagic habitats. Stable isotopes
integrate resource use over longer time periods (approximately 1.5 months in perch; ref [24]). In addition, pelagic and littoral resources are easily distinguishable in most cases as pelagic resources are more depleted in d13
C than littoral resources. In each lake, we collected snails (Lymnea stagnalis,Radix balthica) from the littoral zone and zooplankton from the pelagic zone in order to obtain a baseline signature ford13
C andd15
N. Zooplankton were collected by vertically towing a 100mm-mesh net (Ø 25 cm) multiple times at the deepest points of each lake, from approximately 1 m above the sediment to the surface. Samples were then filtered on GF/F filters. We were not able to collect zooplankton in one of the lakes. Here, we used mussels (Anodonta
sp.) instead to obtain the pelagic baseline signature. Snails and mussels were kept alive for 48 hours in GF/F filtered lake water to enable gut evacuation and subsequently removed from their shells. Dorsal muscle tissue was sampled from up to 30 littoral and 30 pelagic randomly chosen perch from each lake. All animal tissue was dried (60uC for 48uhours), ground and stored in tin capsules. Muscle tissue from perch was not corrected for lipid content due to its low average C:N ratio [40,41].
Stable isotope analyses were carried out at the University of California, Davis Stable Isotope Facility, California, on a contin-uous-flow isotope ratio mass spectrometer (PDZ Europa 20–20). The results are expressed using the delta (d) notation in % as
d= (Rsample:Rstandard –1)61000, where R =13C:12C or 15N:14N.
Standards used were Pee Dee belemnite (PDB) for d13
C and atmospheric nitrogen for d15
N. A quarter of the samples were analyzed in triplicate and the analytical error was 0.04% and 0.21%ford13C andd15N, respectively.
We used IsoError 1.04 [42] to estimate the contribution of littoral resources to perch diet. IsoError uses linear mixing models to quantify the contribution of two sources (i.e., pelagic and littoral resources) to a mixture (i.e., fish diet). For each lake, we used the lake-specific littoral and pelagic resources to calculate their contribution to perch diet. Prior to the calculations, littoral and pelagic resources were corrected for trophic fractionation using a fractionation factor of 0.47% for d13C [43]. We assumed a trophic position of 2 for snails, mussels, and zooplankton.
Stomach Content Analyses
The stomach content of fish was analyzed under a dissection microscope and the food items were separated into six diet categories, (1) benthos, (2) cladocerans, (3) copepods, (4) pelagic macroinvertebrates, (5) terrestrial prey, and (6) fish. The lengths of 10 prey of each group were measured to the nearest 0.1 mm. In
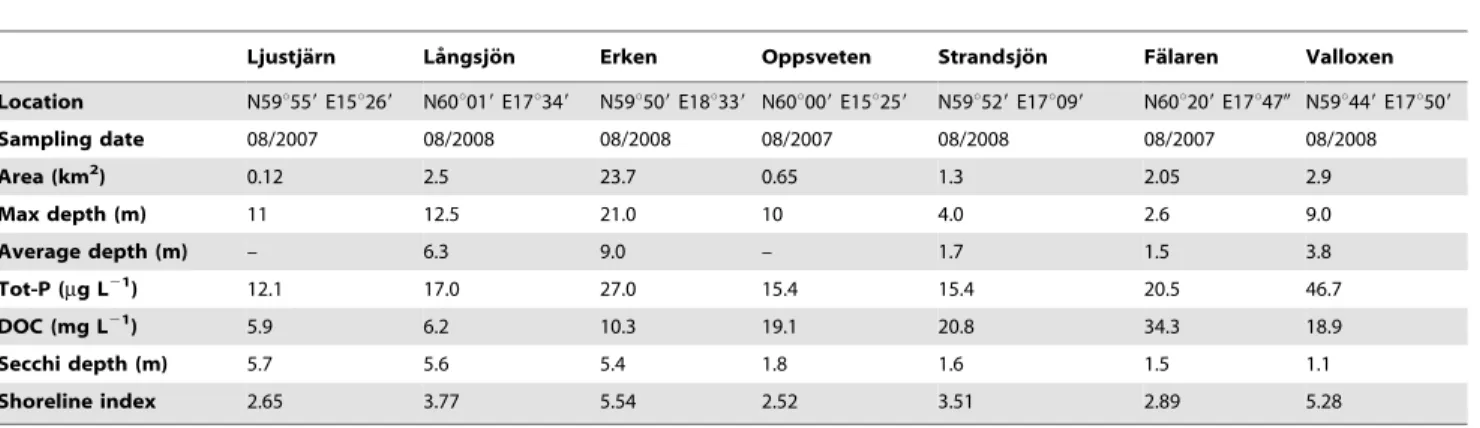
Table 1.Main characteristics of studied lakes in central Sweden.
Ljustja¨rn La˚ngsjo¨n Erken Oppsveten Strandsjo¨n Fa¨laren Valloxen
Location N59u559E15u269 N60u019E17u349 N59u509E18u339 N60u009E15u259 N59u529E17u099 N60u209E17u470 N59u449E17u509
Sampling date 08/2007 08/2008 08/2008 08/2007 08/2008 08/2007 08/2008
Area (km2) 0.12 2.5 23.7 0.65 1.3 2.05 2.9
Max depth (m) 11 12.5 21.0 10 4.0 2.6 9.0
Average depth (m) – 6.3 9.0 – 1.7 1.5 3.8
Tot-P (mg L21) 12.1 17.0 27.0 15.4 15.4 20.5 46.7
DOC (mg L21) 5.9 6.2 10.3 19.1 20.8 34.3 18.9
Secchi depth (m) 5.7 5.6 5.4 1.8 1.6 1.5 1.1
Shoreline index 2.65 3.77 5.54 2.52 3.51 2.89 5.28
Values represent summer measurements from one sampling occasion. doi:10.1371/journal.pone.0043641.t001
Figure 2. Position of landmarks.Location of the 16 landmarks used
in morphological analyses.
groups of ,10 individuals, all prey were measured. Average lengths were then used to calculate biomass (dry weight) for all prey types. Pelagic macroinvertebrates consisted of chironomid pupae andChaoborussp. larvae. Only 23 from a total of 1135 perch contained terrestrial prey or fish in their diet, and therefore these categories were excluded from statistical analyses. The proportion of perch with empty stomachs was only marginally affected by water transparency (generalized linear model: p = 0.09), and therefore perch with empty stomachs were excluded from further diet analyses. To test for differences in littoral resource use between habitats, we used linear mixed effect models (LME) with the contribution of benthos to perch diet as response variable, habitat as fixed effect and lake nested in habitat as random effect. To quantify the diet overlap between littoral and pelagic perch populations, we used Schoener’s similarity index (S) [44]:
S~1{0:5 Xn
i{1
Dpxi{pyiD !
wherepxiis the mean proportion of food categoryiin the diet of
littoral perch,pyiis the mean proportion of food categoryiin the
diet of pelagic perch andnequals the number of food categories. Values ofSapproach 0 for populations that share no prey types and 1 for populations that have completely identical prey utilization. A diet overlap of more than 60% (S .0.6) was considered as a substantial overlap [45].
PLS modeling was done in SIMCA 12.0 (Umetrics AB, Umea˚, Sweden). All other analyses were performed in R 2.15.
Results
Fish communities in all lakes were dominated by roach (Rutilus rutilus) and perch (Table S2). Other common species were bleak (Alburnus alburnus), common bream (Abramis brama), smelt (Osmerus eperlanus), tench (Tinca tinca), white bream (Blicca bjoerkna), rudd (Scardinius erythrophthalmus), ruffe (Gymnocephalus cernuus), northern pike (Esox lucius), and pikeperch (Sander lucioperca).
Resource Availability
Total biomass of benthic and pelagic resources in littoral and pelagic habitats (Table S3) was not affected by water transparency (Pearson correlation: r =20.06 to 0.27, p.0.56). Water trans-parency and lake depth did not affect pelagic and littoral resource composition (perm MANOVA: water transparency: zooplankton: p = 0.11; benthos: p = 0.67; lake depth: zooplankton: p = 0.42; benthos: p = 0.45).
Morphological Analysis
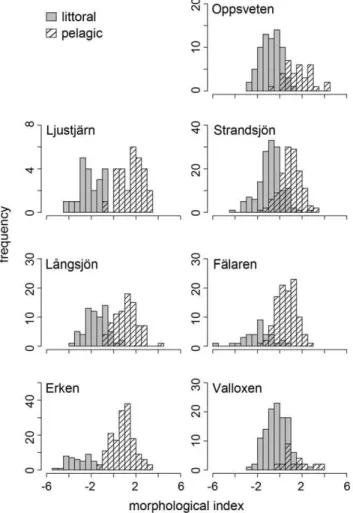
The DFA analysis of body morphology across all lakes revealed 2 significant morphological axes (p,0.05; Figure 3). The score values of the first morphological axis, explaining variation in head morphology, decreased with increasing water transparency (r =20.56, p = 0.19), whereas the score values of the second morphological axis, explaining variation in body depth, increased with increasing water transparency (r = 0.57, p = 0.18). However, none of the correlations were significant, meaning there were no gross morphological differences across lakes.
Perch morphology (DFA scores) differed between littoral and pelagic habitats in all lakes (LME: p,0.001) with generally deeper-bodied perch in the littoral zone, and more streamlined perch occupying the pelagic zone. Morphological divergence between littoral and pelagic perch however, differed between the surveyed lakes (Figure 4). To evaluate which predictors were most
influential on morphological divergence we used PLS analysis. The PLS regression model explained in total 82% of the variance (R2Ycum= 0.82) and the model predictability was moderately high
(Q2cum= 0.43). Based on the VIP scores (VIP.1), the most
important predictors of morphological divergence included, with decreasing importance, the proportion of cladocerans to perch diet, Secchi depth, catch per unit effort (CPUE) of roach in the littoral zone, condition factor, the contribution of copepods to perch diet, piscivore CPUE in the littoral, maximum depth, growth rate, and dissolved organic carbon (Figure S1).
Individual linear regression models revealed that morphological divergence increased with increasing condition factor, contribution of cladocerans to perch diet, growth rate, piscivore CPUE in the littoral, maximum depth, and Secchi depth, whereas it decreased with increasing dissolved organic carbon and CPUE of roach in the littoral (Table 2). The relationship between morphological divergence and contribution of copepods to perch diet was best described with a polynomial function (Table 2). However, only the contribution of cladocerans and copepods to perch diet, CPUE of roach in the littoral, and Secchi depth were significantly correlated with morphological divergence (Table 2), and the AICc suggested no difference in fit between the four models. Water transparency explained most of the variance (70%), whereas contribution of cladocerans and copepods to perch diet and CPUE of roach in the littoral explained 68%, 67%, and 57%, respectively (Table 2).
Stable Isotope Analysis
The reliance on littoral resources inferred from stable isotopes analysis varied among lake ecosystems, ranging between 9.6610.9% and 63.3618%. Generally, littoral reliance for the whole population tended to increase with increasing water transparency (r = 0.70, p = 0.080), whereas the shoreline index and lake depth did not affect littoral reliance (r = 0.18, p = 0.71 and r = 0.45, p = 0.31, respectively). However, in separate analyses, littoral reliance was not affected by water transparency in pelagic populations (range: 10.963.6% to 54.2613.0%, r = 0.52, p = 0.23; Figure 5), whereas littoral populations in-creasingly relied on littoral resources with increasing water transparency (range: 7.769.1% to 72.5617.9%, r = 0.80, p = 0.031; Figure 5).
Stomach Content Analysis
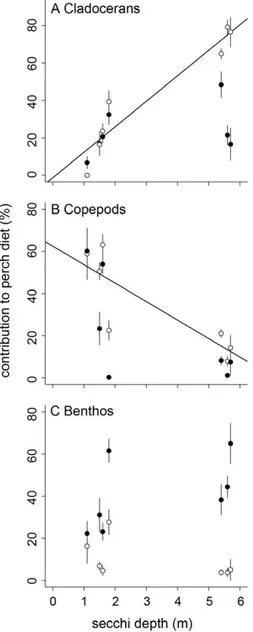
Generally, littoral perch consumed higher proportions of benthic resources than pelagic perch (mean 61 SD: littoral: 38.4643.0; pelagic: 6.6620.4; LME: p,0.01; Figure S2). However, the diet overlap between littoral and pelagic perch varied substantially with variation in water transparency (range: 32–83%) and decreased with increasing water transparency (r =20.78, p = 0.040). The contribution of cladocerans, copepods, and benthos to littoral perch diet was not affected by water transparency (cladocerans: r = 0.42, p = 0.35; copepods: r =20.61, p = 0.15; benthos: r = 0.53, p = 0.22; Figure 6). In contrast, the contribution of cladocerans to pelagic perch diet increased strongly with increasing water transparency (r = 0.90, p = 0.006; Figure 6A), whereas the contribution of copepods decreased with increasing water transparency (r =20.85, p = 0.015; Figure 6B). The contribution of benthos to pelagic perch was not affected by water transparency (r =20.59, p = 0.16; Figure 6C).
Discussion
littoral as additional factors influencing population divergence thus indicating that foraging behavior and interspecific competition also play an important role in population divergence. Water transparency mediates several processes in aquatic ecosystems. In particular, changes in water transparency can affect foraging behavior and competitive interactions. Below we elaborate on potential mechanisms explaining the observed patterns in popu-lation divergence.
Foraging Behavior and Resource Availability
Differences in habitat and resource use are major determinants of population divergence. Different resources may require specific trait adaptations that lead to increased performance such as the variation in beak morphology in Darwin’s finches in response to differences in size and hardness of seeds [5]. In fish, pelagic individuals are usually more streamlined to increase long distance swimming performance and to facilitate feeding on widely dispersed prey. Littoral individuals, on the other hand, tend to be deeper-bodied, optimally adjusted to maneuver in structural complex environments, and to feed on benthic prey [3,4]. If the utilization of critical resources is limited, this might impede the evolution of trait adaptations. Though it has been suggested that benthic foraging is less vision-dependent than pelagic foraging [46], several studies show that low water transparency can impair benthic forging efficiency [47,48]. In our study, littoral perch increased the utilization of littoral resources estimated by stable isotope analysis with increasing water transparency. As the abundance of littoral resources was similar along the water transparency gradient, this suggests that benthic foraging was likely reduced in low water transparency. However, the contribu-tion of littoral resources to perch diet inferred from stomach
content analysis was similar along the water transparency gradient. Stable isotope analyses integrate resource utilization over long term (typically 1.5 months in perch; ref [24]), and are therefore a better estimate of resource use than stomach content analysis. Littoral resource productivity and abundance of littoral prey vary temporarily [49,50], but are typically high in summer. Benthic foraging is likely less affected by low water transparency when resource availability is high, but might be substantially affected at low resource availability. Furthermore, resource availability might be lower in lakes with low water transparency at other times, though we did not assess that. Previous studies reported that decreasing water transparency due to eutrophication or increasing input of terrestrial organic matter can limit littoral productivity due to light limitation, resulting in a higher relative importance of pelagic productivity and reduced littoral reliance of fish [21,22]. It is likely a combination of reduced benthic foraging efficiency and limited littoral resource availability that resulted in decreasing reliance on littoral resources in perch.
The reliance on pelagic resources of pelagic perch was similar across the water transparency gradient, however the acquisition of particular pelagic prey items differed substantially. With increasing water transparency, the consumption of cladocerans increased, whereas the consumption of copepods decreased. Similarly, Estlander et al. [15] reported that selectivity of perch for daphnids decreased in brown-colored water. In low water transparency, prey motion might be more important than size or visibility. Cladocerans generally move slowly whereas copepods are capable of evasive movements [51]. The fast and irregular movements of copepods might make them better detectable when water trans-parency is low and thus more susceptible to perch predation. A previous study reported that bluegill (Lepomis macrochirus)
pre-Figure 3. Morphological variation across lakes.Variation (mean61SD) along the first (MI1) and second (MI 2) morphological axis across all
ferred faster swimming clones ofDaphnia[52], supporting the idea that prey motion increases conspicuousness to fish and thus the effectiveness of prey detection. Limited utilization of littoral resources and differences in diet composition of pelagic prey
resulted in increasing similarity of resource utilization of littoral and pelagic perch with decreasing water transparency, and thus decreasing population divergence.
Interspecific Competition
The competitive interaction between roach and perch has been demonstrated in numerous studies as asymmetric with roach being the superior competitor for zooplankton [53]. Moreover, perch coexisting with roach have been shown to feed on copepods, whereas in the absence of roach, perch mainly fed on cladocerans [54]. Roach abundance in the littoral habitat was similar across the water transparency gradient (Table S4), suggesting that interspecific competition per se did not result in the observed switch of feeding on cladocerans to feeding on copepods in perch. However, water transparency can alter competitive interactions between roach and perch. Estlander et al. [15] showed that selectivity of perch for daphnids decreased with decreasing water transparency, whereas selectivity of roach was not affected by changes in water transparency, suggesting that decreasing water transparency resulted in a competitive advantage of roach.
Figure 4. Morphology of littoral and pelagic perch.Frequency
distribution of perch DFA morphological scores from surveyed lakes. doi:10.1371/journal.pone.0043641.g004
Table 2.Summary of model selection.
Response [y] Predictor [x] Model Direction k df AICc adj. R2 p
Morphological divergence
cf y = a+bx positive 3 4 25.43 0.46 0.057
copep y = a+bx+cx2 – 4 3 23.42 0.67 0.049
clad y = a+bx positive 3 4 21.64 0.68 0.013
log(doc) y = a+bx negative 3 4 27.43 0.28 0.13
log(growth) y = a+bx positive 3 4 27.93 0.22 0.16
roach.lit y = a+bx negative 3 4 23.84 0.57 0.030
log(pisc.lit) y = a+bx positive 3 4 28.70 0.13 0.22
depth y = a+bx positive 3 4 26.42 0.37 0.085
log(secchi) y = a+bx positive 3 4 21.37 0.70 0.012
Given are the predictor and the response variables with VIP.1 in PLS included in each model, the model equations (Model), the direction of the relationship (Direction), number of parameters included in each model (k), degrees of freedom (df), second-order Akaike’s information criterion (AICc) as an estimation of model fit, the adjusted R2and the p-value. cf = condition factor, copep = contribution of copepods to diet, clad = contribution of cladocerans to diet, roach.lit = littoral CPUE of roach,
pisc.lit = littoral CPUE of piscivores. doi:10.1371/journal.pone.0043641.t002
Figure 5. Littoral reliance of littoral and pelagic perch.Littoral
reliance (mean6 1SE) as a function of Secchi depth for littoral and pelagic perch populations. Regression line drawn for littoral perch populations.
Caveat and Future Directions
Our study identified the most important predictors of popula-tion divergence between littoral and pelagic perch. Although we present several potential mechanisms, our study cannot provide the ultimate causes for the observed patterns. For instance, diet composition of perch and interspecific competition played a major role in determining population divergence, however the extent to which each factor contributed to differences in population divergence and potential interactions remain to be investigated. Future studies should explicitly test the underlying mechanisms to disentangle the contribution of each factor to differences in population divergence.
Most studies investigating the effects of water transparency on fish foraging used turbidity, less is known about the effects of variation in watercolor (driven by increased DOM) on fish foraging. The optical characteristics differ substantially between
turbid and brown-colored water. In turbid water, suspended material such as sediment particles or phytoplankton, scatter and attenuate incoming light, independent of wavelength. In contrast, the brown color originating from humic substances selectively absorbs short wavelengths of incoming light and therefore results in a wavelength shift of maximum transmission towards longer wavelengths [55,56]. While watercolor mainly reduces light intensity [57,58], turbidity can change the contrast between an object and the background [59]. A reduction in contrast between prey and its background might limit the detection by a predator even if light levels are sufficient. To our knowledge, only one study compared differences in foraging behavior of fish between turbid and brown-colored water [16]. However the authors found that reaction distance and attack rate were similar in turbid and brown-water treatments, suggesting that turbidity and brown-watercolor have similar effects on foraging behavior. In our study, most lakes with low water transparency were humic lakes, whereas only one lake was potentially more turbid. Future studies should focus on the differences of turbidity and watercolor on fish foraging behavior.
Conclusions
In conclusion, our study shows that water transparency plays an important role in influencing population divergence in an aquatic organism. In aquatic ecosystems, water transparency is greatly impacted by anthropogenic activities, and can be impaired by several factors such as increased turbidity due to eutrophication or high sediment loads, or altered watercolor due to the input of terrestrial organic matter [7,9,60]. Increasing eutrophication has resulted in the loss of a stickleback species pair [61] and has affected mating systems in cichlids where fewer and duller color morphs were found in areas that experienced human-induced increased turbidity [14]. We suggest that changes in water transparency, independent of their cause, can also influence population divergence through their effects on resource utilization.
Supporting Information
Figure S1 VIP scores of PLS analysis identifying the
main factors related to morphological divergence.VIP is normalized, the average squared VIP value is 1. Terms in the model with a VIP.1 are important.
(TIF)
Figure S2 Diet composition (%) of perch stomach
content from A) littoral and B) pelagic fish. Other = Ch-aoborussp., Rotatoria, fish, and terrestrial prey.
(TIF)
Table S1 Variables used in the PLS analysis.
(DOCX)
Table S2 Catch per unit effort (g m22 net) for all
surveyed lakes.
(DOCX)
Table S3 Biomass of pelagic (mg L21) and benthic (mg
m22) resources for all surveyed lakes.
(DOCX)
Table S4 Correlation matrix of predictor variables with
VIP.1.Shown are Pearson’s correlation coefficients. Significance levels *p,0.05, **p,0.01.
(DOCX)
Figure 6. Diet contribution to littoral and pelagic perch.
Contribution (mean61 SE) of resources to perch stomach content as a function of Secchi depth. Open symbols = pelagic perch, solid symbols = littoral perch. Regression line (A, B) shown for pelagic perch populations.
Acknowledgments
We thank J Malmberg, E Geibrink, and M Puffer for help in the field and in the lab and H Peter, W Etges, and one anonymous reviewer for helpful comments on earlier versions of the manuscript.
Author Contributions
Conceived and designed the experiments: PB PEH RS PE. Performed the experiments: PB PEH RS PE. Analyzed the data: PB. Wrote the paper: PB. Contributed to the manuscript writing: PEH RS PE. Contribution of data: PEH RS PE.
References
1. McPhail JD (1984) Ecology and evolution of sympatric sticklebacks (Gasterosteus) -Morphological and genetic evidence for a species pair in Enos Lake, British Columbia. Canadian Journal of Zoology-Revue Canadienne De Zoologie 62: 1402–1408.
2. Smith TB, Skulason S (1996) Evolutionary significance of resource polymorph-isms in fishes, amphibians, and birds. Annual Review of Ecology and Systematics 27: 111–133.
3. Ehlinger TJ, Wilson DS (1988) Complex foraging polymorphism in bluegill sunfish. Proceedings of the National Academy of Sciences of the United States of America 85: 1878–1882.
4. Svanba¨ck R, Eklo¨v P (2004) Morphology in perch affects habitat specific feeding efficiency. Functional Ecology 18: 503–510.
5. Schluter D, Grant PR (1984) Determinants of morphological patterns in communities of Darwin finches. American Naturalist 123: 175–196. 6. Meyer A (1989) Cost of morphological specialization - feeding performance of
the 2 morphs in the tropically polymorphic cichlid fishCichlasoma citrinellum. Oecologia 80: 431–436.
7. Lind OT (2003) Suspended clay’s effect on lake and reservoir limnology. Archiv fu¨r Hydrobiologie Supplement 139: 327–360.
8. Bonsdorff E, Blomqvist EM, Mattila J, Norkko A (1997) Long-term changes and coastal eutrophication. Examples from the Aland Islands and the Archipelago Sea, northern Baltic Sea. Oceanologica Acta 20: 319–329.
9. Hongve D, Riise G, Kristiansen JF (2004) Increased colour and organic acid concentrations in Norwegian forest lakes and drinking water - a result of increased precipitation? Aquatic Sciences 66: 231–238.
10. Monteith DT, Stoddard JL, Evans CD, de Wit HA, Forsius M, et al. (2007) Dissolved organic carbon trends resulting from changes in atmospheric deposition chemistry. Nature 450: 537–U539.
11. Heubel KU, Schlupp I (2006) Turbidity affects association behaviour in male Poecilia latipinna. Journal of Fish Biology 68: 555–568.
12. Ja¨rvenpa¨a¨ M, Lindstro¨m K (2004) Water turbidity by algal blooms causes mating system breakdown in a shallow-water fish, the sand gobyPomatoschistus minutus. Proceedings of the Royal Society of London Series B-Biological Sciences 271: 2361–2365.
13. Ljunggren L, Sandstro¨m A (2007) Influence of visual conditions on foraging and growth of juvenile fishes with dissimilar sensory physiology. Journal of Fish Biology 70: 1319–1334.
14. Seehausen O, vanAlphen JJM, Witte F (1997) Cichlid fish diversity threatened by eutrophication that curbs sexual selection. Science 277: 1808–1811. 15. Estlander S, Nurminen L, Olin M, Vinni M, Immonen S, et al. (2010) Diet shifts
and food selection of perchPerca fluviatilisand roachRutilus rutilusin humic lakes of varying water colour. Journal of Fish Biology 77: 241–256.
16. Jo¨nsson M, Rana˚ker L, Nilsson PA, Bro¨nmark C (2012) Prey-type-dependent foraging of young-of-the-year fish in turbid and humic environments. Ecology of Freshwater Fish 21: 461–468.
17. Carter MW, Shoup DE, Dettmers JM, Wahl DH (2010) Effects of turbidity and cover on prey selectivity of adult smallmouth bass. Transactions of the American Fisheries Society 139: 353–361.
18. Jo¨nsson M, Hylander S, Ranaker L, Nilsson PA, Bro¨nmark C (2011) Foraging success of juvenile pike Esox lucius depends on visual conditions and prey pigmentation. Journal of Fish Biology 79: 290–297.
19. Fahnenstiel GL, Bridgeman TB, Lang GA, McCormick MJ, Nalepa TF (1995) Phytoplankton productivity in Saginaw Bay, Lake Huron: Effects of zebra mussel (Dreissena polymorpha) colonization. Journal of Great Lakes Research 21: 465–475.
20. Lowe RL, Pillsbury RW (1995) Shifts in benthic algal community structure and function following the appearance of zebra mussels (Dreissena polymorpha) in Saginaw Bay, Lake Huron. Journal of Great Lakes Research 21: 558–566. 21. Vadeboncoeur Y, Jeppesen E, Vander Zanden MJ, Schierup HH, Christoffersen
K, et al. (2003) From Greenland to green lakes: Cultural eutrophication and the loss of benthic pathways in lakes. Limnology and Oceanography 48: 1408–1418. 22. Karlsson J, Bystro¨m P, Ask J, Ask P, Persson L, et al. (2009) Light limitation of
nutrient-poor lake ecosystems. Nature 460: 506–U580.
23. Svanba¨ck R, Eklo¨v P, Fransson R, Holmgren K (2008) Intraspecific competition drives multiple species resource polymorphism in fish communities. Oikos 117: 114–124.
24. Quevedo M, Svanba¨ck R, Eklo¨v P (2009) Intrapopulation niche partitioning in a generalist predator limits food web connectivity. Ecology 90: 2263–2274. 25. Kent C, Wong J (1982) An index of littoral-zone complexity and its
measurement. Canadian Journal of Fisheries and Aquatic Sciences 39: 847–853. 26. Borkman DG, Smayda TJ (1998) Long-term trends in water clarity revealed by Secchi-disk measurements in lower Narragansett Bay. ICES Journal of Marine Science 55: 668–679.
27. Botrell HH, Duncan A, Gliwicz ZM, Grygierek E, Herzig A, et al. (1976) A review of some problems in zooplankton production studies. Norwegian Journal of Zoology 24: 419–456.
28. Smock LA (1980) Relationships between body size and biomass of aquatic insects. Freshwater Biology 10: 375–383.
29. Johnston TA, Cunjak RA (1999) Dry mass-length relationships for benthic insects: a review with new data from Catamaran Brook, New Brunswick, Canada. Freshwater Biology 41: 653–674.
30. Baumga¨rtner D, Rothhaupt KO (2003) Predictive length-dry mass regressions for freshwater invertebrates in a pre-alpine lake littoral. International Review of Hydrobiology 88: 453–463.
31. McArdle BH, Anderson MJ (2001) Fitting multivariate models to community data: A comment on distance-based redundancy analysis. Ecology 82: 290–297. 32. Zelditch ML, Swiderski DL, Sheets HD, Fink WL (2004) Geometric morphometrics for biologists. Burlington, Massachusetts, USA: Elsevier Academic Press.
33. Svanba¨ck R, Eklo¨v P (2003) Morphology dependent foraging efficiency in perch: a trade-off for ecological specialization? Oikos 102: 273–284.
34. Rohlf FJ (2005) tpsRelw, relative warps analysis. 1.42 ed. Department of Ecology and Evolution, State University of New York at Stony Brook, New York, USA. 35. Rohlf FJ (2005) tpsRegr, shape regression. 1.31 ed. Department of Ecology and
Evolution, State University of New York at Stony Brook, New York, USA. 36. Eriksson L, Johansson E, Kettaneh-Wold N, Trygg J, Wisktro¨m C, et al. (2006)
Multi- and megavariate data analysis - principles and applications: Umetrics AB. 37. Hurvich CM, Tsai CL (1991) Bias of the corrected AIC criterion for underfitted
regression and time series models. Biometrika 78: 499–509.
38. Sugiura N (1978) Further analysis of the data by Akaike’s information criterion and the finite corrections. Communications in Statistics: Theory and Methods A7: 13–26.
39. Burnham KP, Anderson DR (2002) Model selection and multimodel inference: a practical information-theoretic approach. New York: Springer.
40. Pinnegar JK, Polunin NVC (1999) Differential fractionation of delta C-13 and delta N-15 among fish tissues: implications for the study of trophic interactions. Functional Ecology 13: 225–231.
41. Post DM, Layman CA, Arrington DA, Takimoto G, Quattrochi J, et al. (2007) Getting to the fat of the matter: models, methods and assumptions for dealing with lipids in stable isotope analyses. Oecologia 152: 179–189.
42. Phillips DL, Gregg JW (2001) Uncertainty in source partitioning using stable isotopes. Oecologia 127: 171–179.
43. Post DM (2002) Using stable isotopes to estimate trophic position: Models, methods, and assumptions. Ecology 83: 703–718.
44. Schoener TW (1970) Nonsynchronous spatial overlap of lizards in patchy habitats. Ecology 51: 408–&.
45. Wallace RK (1981) An assessment of diet-overlap indexes. Transactions of the American Fisheries Society 110: 72–76.
46. Uiblein F (1992) Food searching decisions in 4 cyprinid species. Environmental Biology of Fishes 33: 47–52.
47. Gregory RS, Northcote TG (1993) Surface, planktonic, and benthic foraging by juvenile Chinook salmon (Oncorhynchus tshawytscha) in turbid laboratory condi-tions. Canadian Journal of Fisheries and Aquatic Sciences 50: 233–240. 48. Harvey BC, White JL (2008) Use of benthic prey by salmonids under turbid
conditions in a laboratory stream. Transactions of the American Fisheries Society 137: 1756–1763.
49. Aberle N, Wiltshire KH (2006) Seasonality and diversity patterns of microphytobenthos in a mesotrophic lake. Archiv fu¨r Hydrobiologie 167: 447–465.
50. Bohman IM, Herrmann J (2006) The timing of winter-growing shredder species and leaf litter turnover rate in an oligotrophic lake, SE Sweden. Hydrobiologia 556: 99–108.
51. Drenner RW, Strickler JR, Obrien WJ (1978) Capture probability - Role of zooplankter escape in selective feeding of planktivorous fish. Journal of the Fisheries Research Board of Canada 35: 1370–1373.
52. O’Keefe TC, Brewer MC, Dodson SI (1998) Swimming behavior ofDaphnia: its role in determining predation risk. Journal of Plankton Research 20: 973–984. 53. Persson L, Greenberg LA (1990) Juvenile competitive bottlenecks - the perch
(Perca fluviatilis) - roach (Rutilus rutilus) interaction. Ecology 71: 44–56. 54. Persson L (1987) Effects of habitat and season on competitive interactions
between roach (Rutilus rutilus) and perch (Perca fluviatilis). Oecologia 73: 170–177. 55. Kirk JTO (1977) Attenuation of light in natural waters. Australian Journal of
Marine and Freshwater Research 28: 497–508.
56. Lythgoe JN (1979) The ecology of vision. Clarendon Press, Oxford. 57. Davies-Colley RJ, Vant WN (1987) Absorption of light by yellow substance in
58. Morris DP, Zagarese H, Williamson CE, Balseiro EG, Hargreaves BR, et al. (1995) The attentuation of solar UV radiation in lakes and the role of dissolved organic carbon. Limnology and Oceanography 40: 1381–1391.
59. Utne-Palm AC (2002) Visual feeding of fish in a turbid environment: Physical and behavioural aspects. Marine and Freshwater Behaviour and Physiology 35: 111–128.
60. Søndergaard M, Jeppesen E, Lauridsen TL, Skov C, Van Nes EH, et al. (2007) Lake restoration: successes, failures and long-term effects. Journal of Applied Ecology 44: 1095–1105.