Qinling Mountains, China, for the Past 500 Years
Fengmei Yang1,2, Naiang Wang3, Feng Shi4,5*, Fredrik Charpentier Ljungqvist6, Shigong Wang1, Zexin Fan7, Junwei Lu3
1Key Laboratory for Semi-Arid Climate Change of the Ministry of Education, College of Atmospheric Sciences, Lanzhou University, Lanzhou, China,2China Meteorological Administration Training Centre, Beijing, China,3Center for Climate Change and Hydrologic Cycle in Arid Region, College of Earth and Environmental Science, Lanzhou University, Lanzhou, China,4State Key Laboratory of Numerical Modelling for Atmospheric Sciences and Geophysical Fluid Dynamics, Institute of Atmospheric Physics, Chinese Academy of Sciences, Beijing, China,5Key Laboratory of Desert and Desertification, Cold and Arid Regions Environmental and Engineering Research Institute, Chinese Academy of Sciences, Lanzhou, China,6Department of History, Stockholm University, Stockholm, Sweden,7Key Laboratory of Tropical Forest Ecology, Xishuangbanna Tropical Botanical Garden, Chinese Academy of Sciences, Kunming, China
Abstract
A total of 290 tree-ring samples, collected from six sites in the West Qinling Mountains of China, were used to develop six new standard tree-ring chronologies. In addition, 73 proxy records were assembled in collaboration with Chinese and international scholars, from 27 publically available proxy records and 40 tree-ring chronologies that are not available in public datasets. These records were used to reconstruct annual mean temperature variability in the West Qinling Mountains over the past 500 years (AD 1500–1995), using a modified point-by-point regression (hybrid PPR) method. The results demonstrate that the hybrid PPR method successfully integrates the temperature signals from different types of proxies, and that the method preserves a high degree of low-frequency variability. The reconstruction shows greater temperature variability in the West Qinling Mountains than has been found in previous studies. Our temperature reconstruction for this region shows: 1) five distinct cold periods, at approximately AD 1520–1535, AD 1560–1575, AD 1610–1620, AD 1850–1875 and AD 1965–1985, and four warm periods, at approximately AD 1645–1660, AD 1705–1725, AD 1785–1795 and AD 1920– 1945; 2) that in this region, the 20thcentury was not the warmest period of the past 500 years; and 3) that a dominant and persistent oscillation of ca. 64 years is significantly identified in the 1640–1790 period.
Citation:Yang F, Wang N, Shi F, Ljungqvist FC, Wang S et al. (2013) Multi-Proxy Temperature Reconstruction from the West Qinling Mountains, China, for the Past 500 Years. PLoS ONE 8(2): e57638. doi:10.1371/journal.pone.0057638
Editor:Ben Bond-Lamberty, DOE Pacific Northwest National Laboratory, United States of America
ReceivedFebruary 3, 2012;AcceptedJanuary 28, 2013;PublishedFebruary 22, 2013
Copyright:ß2013 Yang et al. This is an open-access article distributed under the terms of the Creative Commons Attribution License, which permits unrestricted use, distribution, and reproduction in any medium, provided the original author and source are credited.
Funding:The study was jointly funded by the CAS Strategic Priority Research Program Grant (XDA05080801), the National Basic Research Program of China (973 Program) (2012CB957804) and the Specialized Research Fund for the Doctoral Program of Higher Education (20090211110025). Fengmei Yang was supported by the Forty-ninth batch of China Postdoctoral Science Foundation (2012T50829) and the China Meteorological Administration Drought Research Fund (IAM201109). Feng Shi was supported by the China Meteorological Administration Drought Research Fund (IAM201213) and the West Light Program for Talent Cultivation of Chinese Academy of Sciences. The funders had no role in study design, data collection and analysis, decision to publish, or preparation of the manuscript.
Competing Interests:The authors have declared that no competing interests exist.
* E-mail: [email protected]
Introduction
Temperature-sensitive proxy data can be used as a primary basis for understanding temperature variations through time. Tree-ring datasets are particularly important natural proxy records used in climatological research, as they provide accurate dating, annual-scale resolution, and are available from locations distributed worldwide [1]. A major focus in dendroclimatology has been the reconstruction of temperatures at a single location using local tree-ring samples [2–15].
Despite the advantages of tree-ring records as temperature proxies, tree-ring chronologies often include less low-frequency information than do other proxies because of the so-called segment-length curse problem [16], which refers to the difficulty of preserving cyclic signals that are longer than the duration of the age of individual trees. Samples from individual trees rarely span time frames longer than a millennium, and are usually much shorter. The standardization process which is used to eliminate the effects of individual tree growth patterns, tends to weaken low-frequency climate signals [17]. Although dating errors of other
proxy types are usually greater than those obtained from tree ring-data, other proxies are often more accurate in preserving low-frequency temperature signals [18]. Therefore, in this study, we employed a hybrid reconstruction method that considers the full spectrum of temperature variability, by separating the variability into high- and low-frequency bandwidths. Every proxy record contains both climate-related information and non-climate-related ‘‘noise’’. In the proxy records of individual trees, the noise can be large and can even dominate the climate signal; however, when averaging a number of proxies, this noise is reduced (assuming that the noise is random). By assembling a large number of proxy records from the same region, we are more likely to extract a common climate-related signal, and the signal is likely to be less strongly affected by the noise inherent in individual proxies.
upper treeline typically respond to temperature, whereas those near the lower treeline respond to precipitation [23]. Furthermore, the complex monsoon system and the thermal forcing of the Tibetan Plateau may strongly influence Asian climate [24]. By using a large number of proxies to rebuild the response function through an ensemble reconstruction approach that averages a large number of ensemble members, the accuracy of the reconstructions may be improved [19].
We developed six new tree-ring chronologies from the West Qinling Mountains, and assembled 67 other proxy records in China. Using a modified point-by-point regression (hybrid-PPR) method, we reconstructed the annual mean temperatures over the past 500 years. Special attention was paid to the reconstruction method, as it differs slightly from those used in previous studies [19,25].
Materials and Methods
he West Qinling Mountains (33u–35uN, 102u–105uE) is situated near the boundary of the East Asia monsoon region, in the transition zone between the Tibetan Plateau and the Loess Plateau of China [26]. A multi-proxy approach is required to accurately reconstruct past climate variability in this region because of the complexity of the climate regime and the variability associated with different climate signals from this area. No specific permits were required for the described field studies. Permission to obtain tree-ring samples was granted by the Bailong River Forestry Bureau to the Lanzhou University research team headed by Dr. Fengmei Yang (first author). The study area belong to the Bailong River Forestry Bureaus This location is not privately owned or protected in any way, and the field studies did not involve endangered or protected species.
1. Instrumental data
We calibrated our temperature reconstructions using three different instrumental surface-air temperature datasets: the CRUTEM3v 5u65ugridded instrumental surface-air temperature data set, which covers the period 1850–2006 (Climatic Research Unit, Norwich, UK; www.cru.uea.ac.uk/cru/data/temperature) [27]; the CRUTS3.1 0.5u60.5u gridded instrumental surface-air temperature dataset, which covers the period 1901–2009 (Climatic Research Unit, Norwich, UK; http://badc.nerc.ac.uk/browse/ badc/cru/data/cru_ts_3.10); and the average of the annual mean measured temperature for the period 1951–2006 obtained from 12 meteorological stations (Baoji, Guangyuan, Hanzhoung, Linxia, Lueyang, Heji, Minxian, Pingwu, Ruoergai, Songpan, Tianshui and Wudu) located in the West Qinling Mountains and the surrounding area (China Meteorological Data Sharing Service System, http://cdc.cma.gov.cn/) (see Figure 1). The quality of the meteorological data is strictly controlled, showing good uniformity and accuracy.
For the CRUTEM3v dataset we used a grid cell centred at 32.5uN and 102.5uE, and for the CRUTS3.1 dataset we used the four grid cells nearest to the West Qinling Mountains. We also used a grid cell centred at 33.75uN 103.75uE, as a correlation analysis between the CRUTS3.1 dataset and the averaged 12-meteorological-station dataset showed this grid cell to have the highest correlation coefficient for the period 1951–1995 (r= 0.85). In Figure 2A, the three instrumental temperature datasets seem similar, but the amplitude of the low-frequency variability differs greatly, as shown in Figure 2B. The amplitude of the temperature variability in the CRUTEM3v data after AD 1966 is clearly greater than is evident in the averaged data of the 12 meteorological stations. Similarly, the amplitude of the
tempera-ture variability in the CRUTS3.1 data after AD 1957 is slightly greater than that observed in the averaged data of the 12 meteorological stations. The variability between the different instrumental datasets is of importance, as the differences have a strong impact on the reconstruction results.
2. Temperature proxy data
The West Qinling Mountains are relatively free from human disturbance and the trees are mostly healthy, thus providing ideal conditions for obtaining for dendroclimatological records from ring samples. During 2009 and 2010, we collected 290 tree-ring samples obtained as increment cores at six sites in the West Qinling Mountains, and from these data, we developed six new multi-centennial tree-ring width chronologies (see Figure 1). The ring widths in the cross-dated samples were measured and the initial dating (and associated errors) of the samples were cross-checked using the quality-control software COFECHA to check the cross-dating and overall quality of the tree-ring chronologies [28]. The ring-width measurement series were detrended by applying a negative exponential curve; some tree-ring width series which did not exhibit negative exponential growth trends were excluded when the chronologies were developed. The chronolo-gies were calculated from the bi-weighted robust means of the raw measurement data using the dendrochronology program library in R (dplR) [29]. The standard version of the six chronologies in which the expressed population signal (EPS) exceeds a threshold value of 0.85 [30] was assessed for coherence using correlation analysis.
In addition to the six new tree-ring chronologies, we collected 67 other multi-proxy records from the surrounding area to use in the reconstruction (see Figure 1 and Table 1), including 21 published tree-ring chronologies were archived in National Climatic Data Center (NCDC) Paleoclimatology (http://www. ncdc.noaa.gov/paleo/paleo.html), 13 of which were shared by Asia 2K regional group, as part of the PAst Global changES (PAGES) 2K Network, and recently were archived in the International Tree-Ring Data Bank (ITRDB; http://www.ncdc. noaa.gov/paleo/treering.html). Two tree-ring chronologies were derived from the Chinese Tree Ring Proxy Dataset (CTRPD; http://cdc.cma.gov.cn/home.do). Moreover, two tree-ring chro-nologies were obtained from the Chinese Tree Ring Data Center (CTRDC; http://ctrdb.ibcas.ac.cn/index.asp). The 28 chronolo-gies are described in 20 peer-reviewed articles [3,6,31–48]. The remaining 14 unpublished tree-ring chronologies came from the co-authors and were firstly used for the multi-proxy temperature reconstruction.
3. Reconstruction methods
The temperature reconstruction method used in this study was a modified PPR method. The PPR is a straightforward principal component regression that has been successfully used to produce high-quality reconstructions of droughts in North America [51], and for generating the North American Drought Atlas [52] and the Monsoon Asia Drought Atlas [19]. The PPR is based on the principle that only proxy records close to the location being reconstructed are good predictors for that location; this premise is particularly important for places with a spatially heterogeneous climate, such as China. The traditional PPR approach uses two variables: search radius and screening probability. The search radius defines the maximum tolerable distance between potential proxy records and the location of the reconstruction. The 450 km search radius was found to be the optimal search radius [53]. The four search radii for the Palmer Drought Severity Index (PDSI) in Asia, 500 km, 1000 km, 2000 km and 3000 km were chosen in that study [19]. The reason for this is the irregular distribution and relatively high noise level of many tree-ring chronologies in China. In this work, search radii of 100, 300, 500 and 1000 km were used for the temperature reconstructions, as smaller search radii are likely to yield a more accurate representation of the local climate information.
The screening probability defines the correlation threshold for including proxy series in the temperature reconstruction. First, all proxies were screened against instrumental data and only those with correlations at or above a 90% confidence level were retained. Because of the high level of noise in much of the proxy data from China, the same weighted model was applied to the records in this study, as was implemented in the creation of the Monsoon Asia Drought Atlas [19].
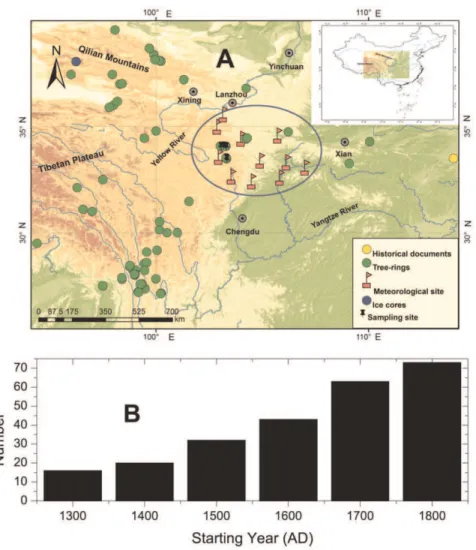
Our approach differs from the traditional PPR approach by incorporating a ‘‘hybrid’’ procedure that separately calibrates information in ‘‘inter-decadal’’ and ‘‘inter-annual’’ bandwidths; inter-decadal bandwidths are those with periods longer than 10 years (including proxies with annual or decadal resolution) and inter-annual bandwidths are those with periods shorter than or equal to 10 years (including those with only annually resolved proxies). This process is derived from the hybrid frequency-domain calibration [50]. The final annual temperature recon-structions were assembled using the two frequency results. Our approach further differs from the traditional PPR in that we used the regularized errors-in-variables (EIV) method to allow for the assimilation of non-tree-ring data, instead of using the traditional principal component regression method. The steps are described in more detail below.
Figure 1. Characteristics of the proxy records. A) Map showing the study area and geographical locations of the 73 proxy records used in this
3.1 Infilling the proxy data. We used a cubic spline to interpolate proxy records with non-annual- to annual-scale resolutions. Proxies that did not extend to AD 1996 were extrapolated to AD 1996 using the regularized expectation maximization (RegEM) algorithm, based on their mutual covari-ance with the other available proxies over the 1800–1996 period [54]. In this study, 18 tree-ring chronologies, two ice-core records (No. 52 and 53 in Table 1) and a Chinese documentary record (No. 51 in Table 1) were extrapolated. Finally, to avoid biases due to different temporal resolutions and interpolation procedures, all records were filtered to retain frequencies of f,0.1 cycles per year in the reconstruction.
3.2 Screening of proxy data. The screening probability in original PPR frame is a method for selecting proxy records for use in the temperature reconstructions at a particular grid point, based on a threshold defined by a certain significance level for correlation [53]. Firstly, every proxy record was required to show a strong correlation (.90% confidence level; n= 45) with the annual temperature of the 12 meteorological stations for the period AD 1951–1995. Because of the high level of noise in the tree-ring chronologies, the same weighted model with the same coefficients was applied in this study as was used in the creation of the Monsoon Asia Drought Atlas [19]. This is expressed as
Pw~P rp
u ð1Þ
wherePw is the weighted proxy data, Pu is the original
un-weighted proxy data in standard normal deviate form, r is the correlation between the tree-ring chronologies and the instrumen-tal temperature data over the calibration period 1951–1995, andp
is some power, 0, 0.5, 0.67, 1, 1.5, 2, used to assign different
weights to each proxy dataset, following the ensemble PPR method [19].
3.3 Splitting of proxy and instrumental data. Following the procedure described in the paper [55], the screened proxy and instrumental data were separated into high- and low-frequency bandwidths using a Butterworth IIR filter with a cut-off frequency of 0.1 cycle per year. The screened proxy records were used to reconstruct temperature in separate high- and low-frequency bandwidths. This frequency split makes it possible to assimilate proxy data series with different temporal resolutions.
3.4 Regressing of proxy data. The regularized EIV temperature reconstruction method [55] was used to reconstruct past temper-ature variability in the two frequency bandwidths, instead of the more traditional principal component regression method. These techniques are described in detail elsewhere [49,54,56–58]. We acknowledge the considerable debate in the literature about the validity of the RegEM/EIV method; however, the method has been utilized in numerous previous studies for reconstructing temperatures on local to global scales [49,55,58–62], and it is also used to reconstruct continental-scale temperature variability by the PAGES 2K network. We considere it to be a feasible method for rebuilding the transfer function. The code for the RegEM/EIV method is availible at http://www.meteo.psu.edu/holocene/ public_html/supplements/Multiproxy
Means07/code/coderecon/. When applying small values of the search radius, the approach used here shares the reconstruction principles that form the basis of the PPR method [53]. Based on the EIV method, the regularized expectation maximization (RegEM) algorithm [49,58] was used to determine a matrix of regression coefficientsBk at grid pointkand model errorsek, as
Figure 2. Comparison of three annual instrumental temperature series from the West Qinling Mountains, in China. A) The three
annual instrumental temperature series (CRUTEM3v, CRUTS3.1, and the annual mean instrumental temperature anomalies, averaged from measurements at 12 local meteorological stations) for the period AD 1901–2006.B) The three instrumental series for the period AD 1951–1995, after low-pass filtering with a Butterworth IIR filter with a cut-off frequency of 0.1 cycles per year.
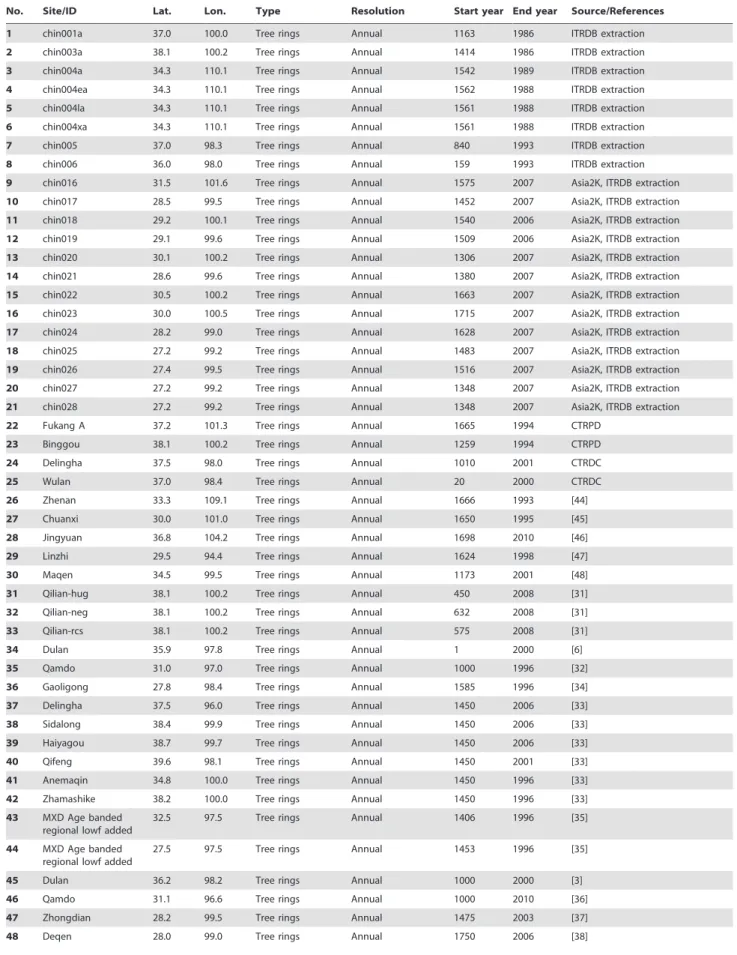
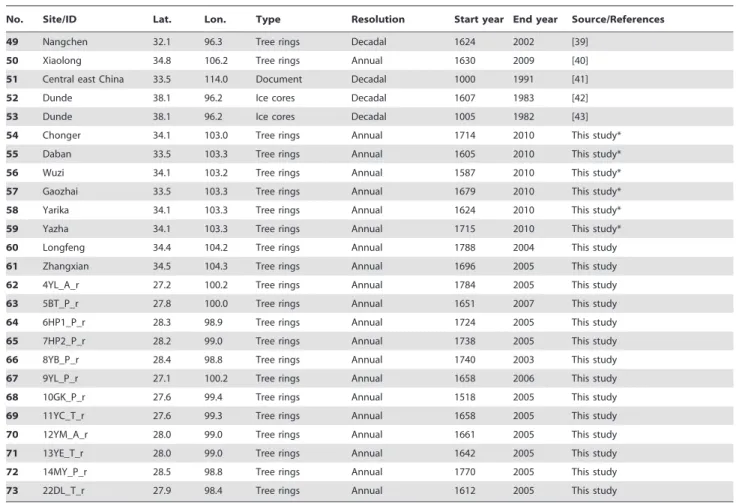
Table 1.List of the 73 proxy series used in this study.
No. Site/ID Lat. Lon. Type Resolution Start year End year Source/References
1 chin001a 37.0 100.0 Tree rings Annual 1163 1986 ITRDB extraction
2 chin003a 38.1 100.2 Tree rings Annual 1414 1986 ITRDB extraction
3 chin004a 34.3 110.1 Tree rings Annual 1542 1989 ITRDB extraction
4 chin004ea 34.3 110.1 Tree rings Annual 1562 1988 ITRDB extraction
5 chin004la 34.3 110.1 Tree rings Annual 1561 1988 ITRDB extraction
6 chin004xa 34.3 110.1 Tree rings Annual 1561 1988 ITRDB extraction
7 chin005 37.0 98.3 Tree rings Annual 840 1993 ITRDB extraction
8 chin006 36.0 98.0 Tree rings Annual 159 1993 ITRDB extraction
9 chin016 31.5 101.6 Tree rings Annual 1575 2007 Asia2K, ITRDB extraction
10 chin017 28.5 99.5 Tree rings Annual 1452 2007 Asia2K, ITRDB extraction
11 chin018 29.2 100.1 Tree rings Annual 1540 2006 Asia2K, ITRDB extraction
12 chin019 29.1 99.6 Tree rings Annual 1509 2006 Asia2K, ITRDB extraction
13 chin020 30.1 100.2 Tree rings Annual 1306 2007 Asia2K, ITRDB extraction
14 chin021 28.6 99.6 Tree rings Annual 1380 2007 Asia2K, ITRDB extraction
15 chin022 30.5 100.2 Tree rings Annual 1663 2007 Asia2K, ITRDB extraction
16 chin023 30.0 100.5 Tree rings Annual 1715 2007 Asia2K, ITRDB extraction
17 chin024 28.2 99.0 Tree rings Annual 1628 2007 Asia2K, ITRDB extraction
18 chin025 27.2 99.2 Tree rings Annual 1483 2007 Asia2K, ITRDB extraction
19 chin026 27.4 99.5 Tree rings Annual 1516 2007 Asia2K, ITRDB extraction
20 chin027 27.2 99.2 Tree rings Annual 1348 2007 Asia2K, ITRDB extraction
21 chin028 27.2 99.2 Tree rings Annual 1348 2007 Asia2K, ITRDB extraction
22 Fukang A 37.2 101.3 Tree rings Annual 1665 1994 CTRPD
23 Binggou 38.1 100.2 Tree rings Annual 1259 1994 CTRPD
24 Delingha 37.5 98.0 Tree rings Annual 1010 2001 CTRDC
25 Wulan 37.0 98.4 Tree rings Annual 20 2000 CTRDC
26 Zhenan 33.3 109.1 Tree rings Annual 1666 1993 [44]
27 Chuanxi 30.0 101.0 Tree rings Annual 1650 1995 [45]
28 Jingyuan 36.8 104.2 Tree rings Annual 1698 2010 [46]
29 Linzhi 29.5 94.4 Tree rings Annual 1624 1998 [47]
30 Maqen 34.5 99.5 Tree rings Annual 1173 2001 [48]
31 Qilian-hug 38.1 100.2 Tree rings Annual 450 2008 [31]
32 Qilian-neg 38.1 100.2 Tree rings Annual 632 2008 [31]
33 Qilian-rcs 38.1 100.2 Tree rings Annual 575 2008 [31]
34 Dulan 35.9 97.8 Tree rings Annual 1 2000 [6]
35 Qamdo 31.0 97.0 Tree rings Annual 1000 1996 [32]
36 Gaoligong 27.8 98.4 Tree rings Annual 1585 1996 [34]
37 Delingha 37.5 96.0 Tree rings Annual 1450 2006 [33]
38 Sidalong 38.4 99.9 Tree rings Annual 1450 2006 [33]
39 Haiyagou 38.7 99.7 Tree rings Annual 1450 2006 [33]
40 Qifeng 39.6 98.1 Tree rings Annual 1450 2001 [33]
41 Anemaqin 34.8 100.0 Tree rings Annual 1450 1996 [33]
42 Zhamashike 38.2 100.0 Tree rings Annual 1450 1996 [33]
43 MXD Age banded regional lowf added
32.5 97.5 Tree rings Annual 1406 1996 [35]
44 MXD Age banded regional lowf added
27.5 97.5 Tree rings Annual 1453 1996 [35]
45 Dulan 36.2 98.2 Tree rings Annual 1000 2000 [3]
46 Qamdo 31.1 96.6 Tree rings Annual 1000 2010 [36]
47 Zhongdian 28.2 99.5 Tree rings Annual 1475 2003 [37]
Trecon,k~Precon,kz(Tcal,kzPcal,k):Bkzek ð2Þ
whereTrecon,kis a row vector giving the predicted temperature
at grid pointk, Tcal,k is a row vector giving the instrumental
temperature during the calibration period,Precon,k is a matrix of
the proxy data (as the predictors),Pcal,kis a matrix of proxy data
during the calibration period [53]; this equation is revised from this paper [49]. As a further safeguard against potentially non-robust results, a minimum of seven predictors is required in implementing the EIV procedure, according to the process described in this paper [55]. This criterion regarding the number of minimum predictors is an empirical constant, which is a compromise between the number of available predictors and the requirement for the model stability. For this reconstruction, the minimum number of predictors is greater than 20.
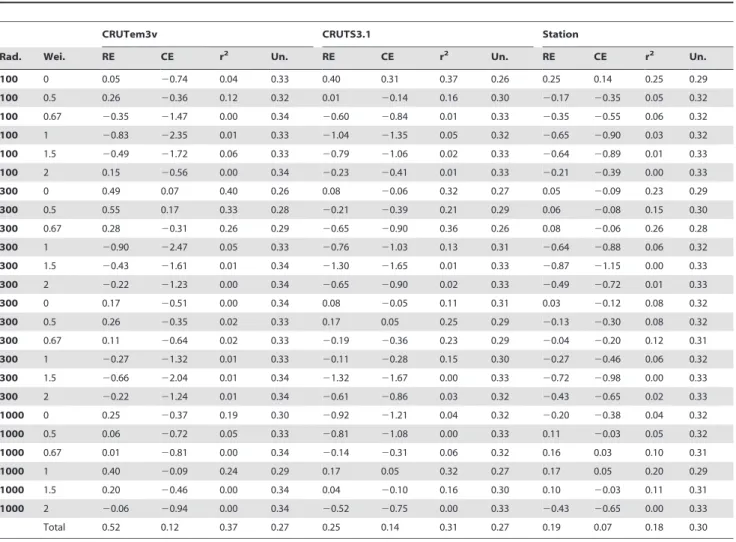
3.5 Validation of reconstruction. The accuracy and skill of the grid-point reconstructions were assessed using a split-period approach [19,55]. Reconstruction models were validated for the period AD 1921–1950, and the fit of the reconstructions was measured by the square of the Pearson product-moment correlation coefficient (r2), the reduction of error (RE), and the coefficient of efficiency (CE) [19]. The uncertainty of the reconstruction is expressed as in the paper [55], the code for this
formula is available at Prof. Mann’s website (www.meteo.psu.edu/ mann/supplements/MultiproxyMeans07/code/codeveri/
calc_error.m), and is expressed by
U~Spffiffiffiffiffiffiffiffiffiffiffi1{r2 ð3Þ
where U is the uncertainty, S is the standard deviation of the instrumental data during the calibration period, and r2 is the squared correlation coefficient, calculated from the data for the verification period.
A wavelet analysis was used to detect cycles in our reconstruc-tion results. The source code for the wavelet analysis is available at this website (http://paos.colorado.edu/research/wavelets/ software.html) [63]. The mother function was set as the Morlet wavelet, which gives a high resolution for the periodicity and includes a complex exponential function modulated by a Gaussian wavelet [63]. A simple red-noise model representing an auto-regressive linear Markov process [64] was chosen as an appropriate background spectrum for determining the 95% confidence levels of the global wavelet power spectrum. The autocorrelation parameter of red noise background is 0.72. Table 1.Cont.
No. Site/ID Lat. Lon. Type Resolution Start year End year Source/References
49 Nangchen 32.1 96.3 Tree rings Decadal 1624 2002 [39]
50 Xiaolong 34.8 106.2 Tree rings Annual 1630 2009 [40]
51 Central east China 33.5 114.0 Document Decadal 1000 1991 [41]
52 Dunde 38.1 96.2 Ice cores Decadal 1607 1983 [42]
53 Dunde 38.1 96.2 Ice cores Decadal 1005 1982 [43]
54 Chonger 34.1 103.0 Tree rings Annual 1714 2010 This study*
55 Daban 33.5 103.3 Tree rings Annual 1605 2010 This study*
56 Wuzi 34.1 103.2 Tree rings Annual 1587 2010 This study*
57 Gaozhai 33.5 103.3 Tree rings Annual 1679 2010 This study*
58 Yarika 34.1 103.3 Tree rings Annual 1624 2010 This study*
59 Yazha 34.1 103.3 Tree rings Annual 1715 2010 This study*
60 Longfeng 34.4 104.2 Tree rings Annual 1788 2004 This study
61 Zhangxian 34.5 104.3 Tree rings Annual 1696 2005 This study
62 4YL_A_r 27.2 100.2 Tree rings Annual 1784 2005 This study
63 5BT_P_r 27.8 100.0 Tree rings Annual 1651 2007 This study
64 6HP1_P_r 28.3 98.9 Tree rings Annual 1724 2005 This study
65 7HP2_P_r 28.2 99.0 Tree rings Annual 1738 2005 This study
66 8YB_P_r 28.4 98.8 Tree rings Annual 1740 2003 This study
67 9YL_P_r 27.1 100.2 Tree rings Annual 1658 2006 This study
68 10GK_P_r 27.6 99.4 Tree rings Annual 1518 2005 This study
69 11YC_T_r 27.6 99.3 Tree rings Annual 1658 2005 This study
70 12YM_A_r 28.0 99.0 Tree rings Annual 1661 2005 This study
71 13YE_T_r 28.0 99.0 Tree rings Annual 1642 2005 This study
72 14MY_P_r 28.5 98.8 Tree rings Annual 1770 2005 This study
73 22DL_T_r 27.9 98.4 Tree rings Annual 1612 2005 This study
*: six new chronologies; ITRDB extraction: the tree ring data are reprocessed from the International Tree-Ring Data Bank (ITRDB), IGBP PAGES/World Data Center for Paleoclimatology, NOAA/NGDC Paleoclimatology Program, Boulder, Colorado (http://www.ncdc.noaa.gov/paleo/treering.html).
Results and Discussion
Reconstruction accuracy as measured byr2, RE and CE are shown in Table 2. We used four search radii (100, 300, 500 and 1000 km), and six weighted cases (powers of 0, 0.5, 0.67, 1, 1.5, and 2), giving 24 ensemble members. Our ensemble includes some members for which RE and CE exceed 0, as these values indicate that these parameters are of value [19]. Estimates of the uncertainty are included in Table 2, as based on equation 3. The CE values are mostly negative, indicating that the results are not well verified. The main reasons for this are the very short duration of the instrumental temperature data in the study area and the restricted ability of proxy data to extract the climate signals; thus, temperature is only one factor affecting tree-ring growth patterns in this region [65].
Figure 3 shows reconstructed temperature anomalies (with respect to AD 1961–1990) for the past 500 years in the West Qinling Mountains in China, calibrated against three different instrumental datasets. The three results show similar trends. Cold excursions relative to from the underlying trend are present during five periods, at approximately AD 1520–1535, AD 1560–1575, AD 1610–1620, AD 1850–1875, and AD 1965–1985. Warm
excursions are present during four periods, at approximately, AD 1645–1660, AD 1705–1725, AD 1785–1795, and AD 1920–1945. The last warm period (AD 1920–1945) is likely to be the regional expression of 20thfirst century global climate warming, the similar example that the Arctic air temperature warming during the AD 1910–1940 period [66].
Our reconstructions show that the 20thcentury was not warmer than other periods in the past 500 years in this region of China. The phases of the three reconstructions are mostly consistent, but the reconstruction that was calibrated against the CRUTEM3v dataset shows larger amplitudes than do the other two recon-structions. It is important to note, however, that the choice of instrumental data has a significant effect on the amplitude of the reconstructed temperature variations during the warm periods in the 18thcentury. For example, for the CRUTEM3v dataset, the instrumental temperature (filtered using a Butterworth IIR filter with a cut-off frequency of 0.1 cycle per year) exhibits a distinctly and larger amplitude than other datasets (Figure 2B). When compared with the long-term means, the 1961–1990 reference period was relatively cold in the West Qinling Mountains, in contrast to most other regions in the Northern Hemisphere. Consequently, the reconstructed temperatures are above the Table 2.Statistical validation of the reconstruction, skill assessments and uncertainty estimates.
CRUTem3v CRUTS3.1 Station
Rad. Wei. RE CE r2 Un. RE CE r2 Un. RE CE r2 Un.
100 0 0.05 20.74 0.04 0.33 0.40 0.31 0.37 0.26 0.25 0.14 0.25 0.29
100 0.5 0.26 20.36 0.12 0.32 0.01 20.14 0.16 0.30 20.17 20.35 0.05 0.32
100 0.67 20.35 21.47 0.00 0.34 20.60 20.84 0.01 0.33 20.35 20.55 0.06 0.32
100 1 20.83 22.35 0.01 0.33 21.04 21.35 0.05 0.32 20.65 20.90 0.03 0.32
100 1.5 20.49 21.72 0.06 0.33 20.79 21.06 0.02 0.33 20.64 20.89 0.01 0.33
100 2 0.15 20.56 0.00 0.34 20.23 20.41 0.01 0.33 20.21 20.39 0.00 0.33
300 0 0.49 0.07 0.40 0.26 0.08 20.06 0.32 0.27 0.05 20.09 0.23 0.29
300 0.5 0.55 0.17 0.33 0.28 20.21 20.39 0.21 0.29 0.06 20.08 0.15 0.30
300 0.67 0.28 20.31 0.26 0.29 20.65 20.90 0.36 0.26 0.08 20.06 0.26 0.28
300 1 20.90 22.47 0.05 0.33 20.76 21.03 0.13 0.31 20.64 20.88 0.06 0.32
300 1.5 20.43 21.61 0.01 0.34 21.30 21.65 0.01 0.33 20.87 21.15 0.00 0.33
300 2 20.22 21.23 0.00 0.34 20.65 20.90 0.02 0.33 20.49 20.72 0.01 0.33
300 0 0.17 20.51 0.00 0.34 0.08 20.05 0.11 0.31 0.03 20.12 0.08 0.32
300 0.5 0.26 20.35 0.02 0.33 0.17 0.05 0.25 0.29 20.13 20.30 0.08 0.32
300 0.67 0.11 20.64 0.02 0.33 20.19 20.36 0.23 0.29 20.04 20.20 0.12 0.31
300 1 20.27 21.32 0.01 0.33 20.11 20.28 0.15 0.30 20.27 20.46 0.06 0.32
300 1.5 20.66 22.04 0.01 0.34 21.32 21.67 0.00 0.33 20.72 20.98 0.00 0.33
300 2 20.22 21.24 0.01 0.34 20.61 20.86 0.03 0.32 20.43 20.65 0.02 0.33
1000 0 0.25 20.37 0.19 0.30 20.92 21.21 0.04 0.32 20.20 20.38 0.04 0.32
1000 0.5 0.06 20.72 0.05 0.33 20.81 21.08 0.00 0.33 0.11 20.03 0.05 0.32
1000 0.67 0.01 20.81 0.00 0.34 20.14 20.31 0.06 0.32 0.16 0.03 0.10 0.31
1000 1 0.40 20.09 0.24 0.29 0.17 0.05 0.32 0.27 0.17 0.05 0.20 0.29
1000 1.5 0.20 20.46 0.00 0.34 0.04 20.10 0.16 0.30 0.10 20.03 0.11 0.31
1000 2 20.06 20.94 0.00 0.34 20.52 20.75 0.00 0.33 20.43 20.65 0.00 0.33
Total 0.52 0.12 0.37 0.27 0.25 0.14 0.31 0.27 0.19 0.07 0.18 0.30
The 24 ensemble members include combinations of four search radii (100 km, 300 km, 500 km and 1000 km) and six weighted cases (using powers of 0, 0.5, 0.67, 1, 1.5 and 2 for weighting).
Rad. = search radii (km); Wei. = Weighted cases. Radi; Un. = uncertainty estimates; Total: we ensembled some parts of the 24 members in which RE and CE exceed 0, as these values of RE and CE exceeding 0 indicate that the reconstruction is reliable.
1961–1990 means for most of the past 500 years, which is the reverse of the situation observed in most other regions, including China as a whole.
Figure 4 compares of our reconstruction with the other results [67]; both studies used the same instrumental data and CRUTEM3v for the past 500 years. Grey lines show the uncertainties. Two reconstructions are presented, using the different proxy datasets. There are only several proxy records in
the study area used in the other reconstruction [67]; however, we used 73 proxy records in this study. The reconstructions show two cold periods at ca. AD 1610–1620 and ca. AD 1965–1985, and two strong warming periods at ca. AD 1645–1660 and ca. AD 1920–1945. Overall, the timing of some of the transition periods from warm to cold conditions in our results coincides with the other results, but the timings of some transition periods do not match. The amplitudes of our reconstruction are larger than those Figure 3. Reconstructed annual mean temperature anomalies (with reference to AD 1961–1990) for the past 500 years in the West
Qinling Mountains, calibrated against three different instrumental datasets.The series were low-pass filtered by a Butterworth IIR filter
with a cut-off frequency of 0.1 cycles per year. doi:10.1371/journal.pone.0057638.g003
Figure 4. Comparison between our reconstruction and the other result[67](using the CRUTEM3v dataset) for the last 500 years.The
[67] for the field temperature reconstruction of corresponding geographical regions (see Figure 4). The differences might be attributed to different methodologies and different proxy data. The PPR method has the advantage, at least in theory, of preserving local signals more accurately than do methods based on empirical orthogonal function regression [67]. In addition, in this study, we have used more local proxy data, which can preserve more distinct local climate variability, than the other result [67]. The use of a great number of local and high-quality proxy records will more realistically reflect the local climate variability in a given area.
A wavelet analysis was used to detect cycles in the reconstruc-tions over the full reconstruction period AD 1500–1995. The results (Figure 5) indicate that a dominant and persistent oscillation of ca. 64 years is present across almost the entire period, and is especially noticeable during ca. AD 1640–1790. This dominant timescale of climatic variability, which has been found in instrumental records [68], other proxy data [69] and simulation results [70], may originate from an internal variability of the ocean-atmosphere system, e.g. the Atlantic multi-decadal oscilla-tion [71].
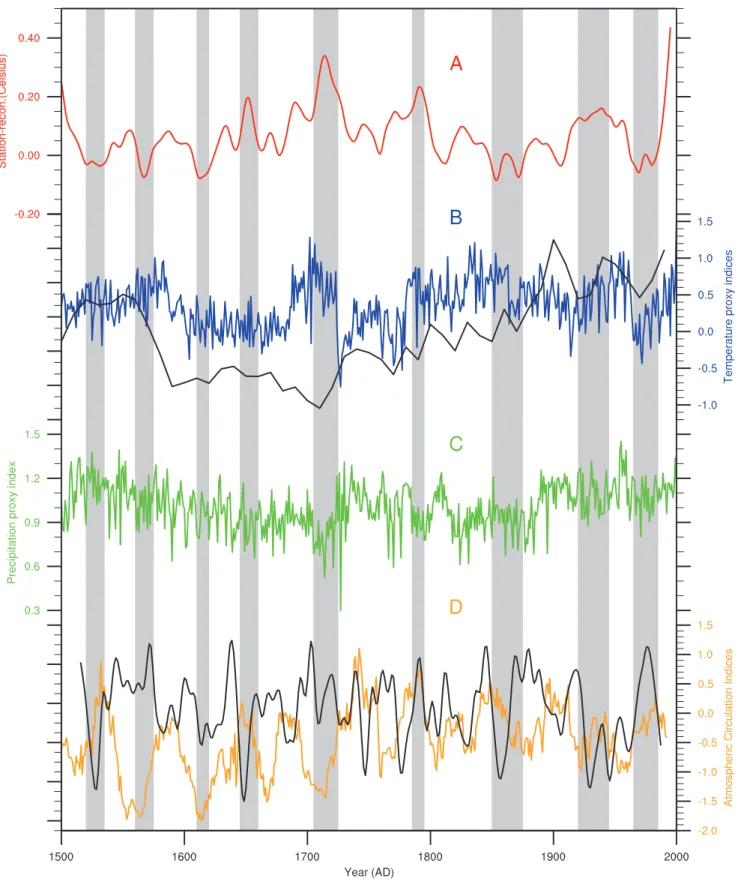
Figure 6 compares between our temperature reconstruction with other reconstructions of temperature [5,36,72], precipitation [33], the El Nin˜o-Southern Oscillation (ENSO) [73], and the Pacific Decadal Oscillation (PDO) [74]. The temperatures reconstructed for Sunan County are representative of the temperature variability for the central Qilian Mountains [5,72]. The Qamdo temperature reconstruction is representative of the temperature variability for the southeast area of the Tibetan Plateau [36]. The precipitation reconstructed for Zhamashike correlates strongly with precipitation in other regions of the Qilian Mountains; this correlation is, significant at the 95% confidence level, indicating that this record is likely to represent a response to
a common precipitation signal [33], and therefore used to represent precipitation variability in the Qilian Mountains. The ENSO variance reconstruction, which denotes the Nin˜o3 region, is based on the North American Drought Atlas [73] and is derived from the tree-ring datasets in Northern America. The PDO index was developed from 17 Asian tree-ring chronologies [74], filtered to retain frequencies off,0.1 cycle per year.
The dominant 1705–1725 warm period (Figure 6) coincides with a cold and dry period in the central Qilian Mountains and a warm period in the southeastern Tibetan Plateau and is related to lowered ENSO variance and raised PDO values. This period coincides with a weakened Asian summer monsoon [40], which is the main source of precipitation in the study area. Moreover, the temperatures during this period are greater than or equal to those in the 20thcentury. These warm periods were evident in the south-eastern Tibetan Plateau [36]. The other three warm periods could be associated with dry periods in the Qilian Mountains and a strengthened Asian summer monsoon. This indicates that the Asian monsoonal dynamics may be a major factor affecting climate variability in the study area, but it is not the only factor. The last warm period occurred during the period AD 1920–1945. A widespread drought event occurred in the 1920s and 1930s in northern China [75,76]; this can be observed in our reconstruc-tion, although the duration of the event may have been longer in the study area, possibly representing divergences between local and regional environmental trends.
According to our reconstructions, the first three cold periods occurred at approximately AD 1520–1535, AD 1560–1575, and AD 1610–1620, all of which all belong to period of the Little Ice Age. The last cold period AD 1610–1620 can also be identified in the central Qilian Mountains and on the Tibetan Plateau, but the other cold periods can not be found (see the Figure 6). These patterns indicate that temperatures exhibited different phases and
Figure 5. Wavelet analysis of our reconstruction.Top panel: surface-air temperature series during the period AD 1500–1995; Bottom panel:
Figure 6. Comparisons among our temperature reconstruction and other reconstructions of temperature, precipitation, the El
Nin˜o-Southern Oscillation and the Pacific Decadal Oscillation. A) Station- reconstructed temperature in the West Qinling Mountains.B)
Reconstructed temperature (blue line) in the Qamdo region of the Tibetan Plateau (blue line), calculated using the tree-ring regional curve standardization (RCS) chronology [36], and the reconstructed temperature (black line), using the tree ring chronology from the middle Qilian Mountains [5,72].C) Reconstructed precipitation and temperature (green line), calculated using the tree-ring chronology from Zhamashike in the Qilian Mountains [33].D) Reconstructed ENSO (orange line), calculated using tree-ring chronology [73], and the reconstructed PDO (black line), calculated from tree-ring chronologies [74], filtered to retain frequencies above a cut-off frequency of 0.1 cycle per year.
amplitudes in different areas during the Little Ice Age. The precipitation in the central Qilian Mountains was high during AD 1520–1535, but dry conditions prevailed during the next two cold periods. This indicates that warm periods and wet periods are not homogeneous in this area.
Temperatures during the second and third cold periods correspond to the relatively low variances of ENSO during the same periods; however, during the first cold period the temper-atures correspond to a high ENSO variance. Moreover, the PDO index compared two lower values and a high value during the same periods. This shows that the temperature in the West Qinling Mountains was affected by multiple factors. The fourth-cold period, which is observed in the reconstruction for the middle of the Qilian Mountains, and the southeastern area of the Tibetan Plateau (Figure 6), may represent a larger scale cold event; precipitation during this time was low. The ENSO variance and the PDO index show two cold phases, with cold periods evident in the PDO and ENSO records during the 1950s and 1960s, as observed in Figure 6; a cold and wet period also occurs during this interval. However, in contrast to the explanation given for the above mentioned cold periods, this cold period may be explained by a stronger Indian summer monsoon [77]. Thus, local climate anomalies such as these serve to illustrate the importance of increasing our understanding of past climate variability, not only at large spatial scales, but also at local and regional levels.
Conclusions
Tree-ring samples from six sites in the West Qinling Mountains of China were used to develop six new tree-ring width chronologies. In combination with 67 other proxy records of various types, the new chronologies were used to reconstruct
temperatures in the West Qinling Mountains from AD 1500 to the present. Our results show that a hybrid-PPR method can effectively assimilate different types of proxy data with different temporal resolutions, and preserve more information about local climate variability than other similar techniques. The reconstruc-tion shows 1) five distinct cold periods, at approximately AD 1520–1535, AD 1560–1575, AD 1610–1620, AD 1850–1875, and AD 1965–1985, and four warm periods, at approximately AD 1645–1660, AD 1705–1725, AD 1785–1795 and AD 1920–1945 during the past 500 years in the West Qinling Mountains; and 2) the 20thcentury was not the warmest period during the past 500 years in the West Qinling Mountains; and 3) there is a dominant and persistent oscillation of ca.64 years during the period AD 1640–1790.
Acknowledgments
The authors thank Prof. Bao Yang, Prof. Jianping Li, Prof. Xuemei Shao and Prof. Jingyun Zheng for their thoughtful and constructive comments; Dr. Ying Hou, Dr. Xuemin Zhang and the Bailong River Forestry Bureau for field assistance. The authors are also grateful to Chun Qin, Shuyuan Kang, Minhui He, Keyan Fang, Achim Bra¨uning, Hongbing Liu, Yu Liu, Qibing Zhang, Paul J. Krusic, Jinbao Li, Jianfeng Peng, Edward R. Cook, Shaowu Wang, Paul R. Sheppard, Xiaohua Gou and other scientists who contributed their proxy data for the study region to the publicly available database.
Author Contributions
Conceived and designed the experiments: FY NW FS FCL SW. Performed the experiments: FY FS. Analyzed the data: FY FS FCL. Contributed reagents/materials/analysis tools: FY FS ZF JL. Wrote the paper: FY FS FCL.
References
1. Bradley R (2011) High-Resolution Paleoclimatology. In: Hughes MK, Swetnam TW, Diaz HF, editors. Dendroclimatology: Progress and Prospects: Springer Netherlands. pp. 3–15.
2. Shao X, Wang S, Zhu H, Xu Y, Liang E, et al. (2009) A 3585-year ring-width dating chronology of Qilian juniper from the northeastern Qinghai-Tibetan Plateau. IAWA Journal 30: 379–394.
3. Liu Y, An Z, Linderholm H, Chen D, Song H, et al. (2009) Annual temperatures during the last 2485 years in the mid-eastern Tibetan Plateau inferred from tree rings. Science in China Series D: Earth Sciences 52: 348–359.
4. Zhang Y, Gou X, Chen F, Tian Q, Yang M, et al. (2009) A 1232-year tree-ring record of climate variability in the Qilian Mountains, northwestern China. IAWA JOURNAL 30: 407–420.
5. Liu X, Shao X, Zhao L, Qin D, Chen T, et al. (2007) Dendroclimatic Temperature Record Derived from Tree-Ring Width and Stable Carbon Isotope Chronologies in the Middle Qilian Mountains, China. Arctic, Antarctic, and Alpine Research 39: 651–657.
6. Zhang QB, Cheng GD, Yao TD, Kang XC, Huang JG (2003) A 2,326-year tree-ring record of climate variability on the northeastern Qinghai-Tibetan Plateau. Geophysical Research Letters 30: doi:10.1029/2003gl017425. 7. Hughes MK (2011) Dendroclimatology in High-Resolution Paleoclimatology.
In: Hughes MK, Swetnam TW, Diaz HF, editors. Dendroclimatology: Progress and Prospects: Springer Netherlands. pp. 17–34.
8. Bradley RS (1999) Paleoclimatology: Reconstructing climates of the Quaternary. London: Academic Press.
9. Fritts H (1976) Tree rings and climate. London: Academic Press.
10. Grudd H (2008) Tornetra¨sk tree-ring width and density AD 500–2004: a test of climatic sensitivity and a new 1500-year reconstruction of north Fennoscandian summers. Climate Dynamics 31: 843–857.
11. Linderholm HW, Gunnarson BE (2005) Summer temperature variability in central Scandinavia during the last 3600 years. Geografiska Annaler: Series A, Physical Geography 87: 231–241.
12. Yang B, Qin C, Bra¨uning A, Burchardt I, Liu J (2011) Rainfall history for the Hexi Corridor in the arid northwest China during the past 620 years derived from tree rings. International Journal of Climatology 31: 1166–1176. 13. Qin C, Yang B, Bra¨uning A, Sonechkin DM, Huang K (2011) Regional extreme
climate events on the northeastern Tibetan Plateau since AD 1450 inferred from tree rings. Global and Planetary Change 75: 143–154.
14. Liu J, Yang B, Qin C (2011) Tree-ring based annual precipitation reconstruction since AD 1480 in south central Tibet. Quaternary International 236: 75–81.
15. Shi F, Yang B, von Gunten L, Qin C, Wang ZY (2012) Ensemble empirical mode decomposition for tree-ring climate reconstructions. Theoretical and Applied Climatology 109: 233–243.
16. Cook ER, Briffa KR, Meko DM, Graybill DA, Funkhouser G (1995) The ’segment length curse’ in long tree-ring chronology development for palaeocli-matic studies. The Holocene 5: 229–237.
17. Briffa KR, Melvin TM (2011) A Closer Look at Regional Curve Standardization of Tree-Ring Records: Justification of the Need, a Warning of Some Pitfalls, and Suggested Improvements in Its Application. In: Hughes MK, Swetnam TW, Diaz HF, editors. Dendroclimatology: Progress and Prospects: Springer Netherlands. pp. 113–145.
18. Moberg A, Sonechkin DM, Holmgren K, Datsenko NM, Karle´n W (2005) Highly variable Northern Hemisphere temperatures reconstructed from low-and high-resolution proxy data. Nature 433: 613–617.
19. Cook ER, Anchukaitis KJ, Buckley BM, D’Arrigo RD, Jacoby GC, et al. (2010) Asian monsoon failure and megadrought during the last millennium. Science 328: 486–489.
20. He M, Yang B, Bra¨uning A, Wang J, Wang Z (2013) Tree-ring-derived millennial precipitation record for the south-central Tibetan Plateau and its possible driving mechanism. The Holocene 23: 34–43.
21. Shi F, Yang B, von Gunten L (2012) Preliminary multiproxy surface air temperature field reconstruction for China over the past millennium. SCIENCE CHINA Earth Sciences 55: 2058–2067.
22. Fang K, Gou X, Chen F, Liu C, Davi N, et al. (2012) Tree-ring based reconstruction of drought variability (1615–2009) in the Kongtong Mountain area, northern China. Global and Planetary Change 80–81: 190–197. 23. Briffa KR, Shishov VV, Melvin TM, Vaganov EA, Grudd H, et al. (2008)
Trends in recent temperature and radial tree growth spanning 2000 years across northwest Eurasia. Philosophical Transactions of the Royal Society B: Biological Sciences 363: 2269–2282.
24. Wu G, Liu Y, He B, Bao Q, Duan A, et al. (2012) Thermal Controls on the Asian Summer Monsoon. Sci Rep 2: doi:10.1038/srep00404.
25. Fang KY, Gou XH, Chen FH, Cook E, Li JB, et al. (2011) Large-Scale Precipitation Variability over Northwest China Inferred from Tree Rings. Journal of Climate 24: 3457–3468.
27. Brohan P, Kennedy J, Harris I, Tett S, Jones P (2006) Uncertainty estimates in regional and global observed temperature changes: a new dataset from 1850. J Geophys Res 111: doi:10.1029/2005JD006548.
28. Holmes RL (1983) Computer-assisted quality control in tree-ring dating and measurement. Tree-ring bulletin 43: 69–78.
29. Bunn AG (2008) A dendrochronology program library in R (dplR). Dendrochronologia 26: 115–124.
30. Wigley TML, Briffa KR, Jones PD (1984) On the average value of correlated time series, with applications in dendroclimatology and hydrometeorology. Journal of Climate and Applied Meteorology 23: 201–213.
31. Yang B, Qin C, Shi F, Sonechkin DM (2012) Tree ring-based annual streamflow reconstruction for the Heihe River in arid northwestern China from AD 575 and its implications for water resource management. The Holocene 22: 773–784. 32. Bra¨uning A, Grießinger J (2006) Late Holocene variations in monsoon intensity
in the Tibetan-Himalayan region-evidence from tree rings. Journal of the Geological Society of India 68: 485–493.
33. Yang B, Qin C, Huang K, Fan ZX, Liu JJ (2010) Spatial and temporal patterns of variations in tree growth over the northeastern Tibetan Plateau during the period AD 1450–2001. The Holocene 20: 1235–1245.
34. Fan Z, Brauning A, Tian Q, Yang B, Cao K (2010) Tree ring recorded May-August temperature variations since AD 1585 in the Gaoligong Mountains, southeastern Tibetan Plateau. Palaeogeography, Palaeoclimatology, Palaeoecol-ogy 296: 94–102.
35. Briffa KR, Osborn TJ, Schweingruber FH, Harris IC, Jones PD, et al. (2001) Low-frequency temperature variations from a northern tree ring density network. Journal of Geophysical Research-Atmospheres 106: 2929–2941. 36. Yang B (2012) Spatial and temporal patterns of climate variations over the
Tibetan plateau during the period 1300–2010. Quaternary Sciences 32: 81–94. 37. Li ZS, Zhang QB, Ma K (2011) Tree-ring reconstruction of summer temperature for AD 1475–2003 in the central Hengduan Mountains, Northwestern Yunnan, China. Climatic Change 110: 455–467.
38. Fan ZX, Brauning A, Yang B, Cao KF (2009) Tree ring density-based summer temperature reconstruction for the central Hengduan Mountains in southern China. Global and Planetary Change 65: 1–11.
39. Liang E, Shao X, Qin N (2008) Tree-ring based summer temperature reconstruction for the source region of the Yangtze River on the Tibetan Plateau. Global and Planetary Change 61: 313–320.
40. Fang K, Gou X, Chen F, Frank D, Liu C, et al. (2012) Precipitation variability during the past 400 years in the Xiaolong Mountain (central China) inferred from tree rings. Climate Dynamics 39: 1697–1707.
41. Wang S, Wen X, Luo Y, Dong W, Zhao Z, et al. (2007) Reconstruction of temperature series of China for the last 1000 years. Chinese Science Bulletin 52: 3272–3280.
42. Thompson LG, Mosley-Thompson E, Brecher H, Davis M, Leon B, et al. (2006) Abrupt tropical climate change: Past and present. Proceedings of the National Academy of Sciences of the United States of America 103: 10536–10543. 43. Thompson L, Mosley–Thompson E, Davis M, Lin P, Henderson K, et al. (2003)
Tropical glacier and ice core evidence of climate change on annual to millennial time scales. Climatic Change 59: 137–155.
44. Liu H, Shao X (2000) Reconstruction of earlyspring temperature at Zhenan from 1755 using tree ring chronology. Acta Meteorologica Sinica 58: 223–234. 45. Shao X, Fan J (1999) Past climate on west Sichuan Plateau as reconstructed from
ring-widths of dragon spruce. Quaternary Sciences 1: 81–89.
46. Kang S, Yang B, Qin C (2012) Recent tree-growth reduction in north central China as a combined result of a weakened monsoon and atmospheric oscillations. Climatic Change 115: 519–536.
47. Liang E, Shao X, Xu Y (2009) Tree-ring evidence of recent abnormal warming on the southeast Tibetan Plateau. Theoretical and Applied Climatology 98: 9– 18.
48. Gou XH, Chen FH, Jacoby G, Cook E, Yang MX, et al. (2007) Rapid tree growth with respect to the last 400 years in response to climate warming, northeastern Tibetan Plateau. International Journal of Climatology 27: 1497– 1503.
49. Mann ME, Rutherford S, Wahl E, Ammann C (2007) Robustness of proxy-based climate field reconstruction methods. J Geophys Res 112: doi:10.1029/ 2006jd008272.
50. Mann ME, Rutherford S, Wahl E, Ammann C (2005) Testing the fidelity of methods used in proxy-based reconstructions of past climate. Journal of Climate 18: 4097–4107.
51. Cook ER, Seager R, Cane MA, Stahle DW (2007) North American drought: Reconstructions, causes, and consequences. Earth-Science Reviews 81: 93–134. 52. Cook E, Woodhouse C, Eakin C, Meko D, Stahle D (2004) Long–term aridity
changes in the western United States. Science 306: 1015–1018.
53. Cook ER, Meko DM, Stahle DW, Cleaveland MK (1999) Drought reconstructions for the continental United States. Journal of Climate 12: 1145–1162.
54. Schneider T (2001) Analysis of incomplete climate data: Estimation of mean values and covariance matrices and imputation of missing values. Journal of Climate 14: 853–871.
55. Mann ME, Zhang ZH, Hughes MK, Bradley RS, Miller SK, et al. (2008) Proxy-based reconstructions of hemispheric and global surface temperature variations over the past two millennia. Proceedings of the National Academy of Sciences of the United States of America 105: 13252–13257.
56. Jones PD, Briffa KR, Osborn TJ, Lough JM, van Ommen TD, et al. (2009) High–resolution palaeoclimatology of the last millennium: a review of current status and future prospects. The Holocene 19: 3–49.
57. Riedwyl N, Kuttel M, Luterbacher J, Wanner H (2009) Comparison of climate field reconstruction techniques: application to Europe. Climate Dynamics 32: 381–395.
58. Rutherford S, Mann ME, Osborn TJ, Bradley RS, Briffa KR, et al. (2005) Proxy-based Northern Hemisphere surface temperature reconstructions: Sensi-tivity to method, predictor network, target season, and target domain. Journal of Climate 18: 2308–2329.
59. Wahl ER, Ammann CM (2007) Robustness of the Mann, Bradley, Hughes reconstruction of Northern Hemisphere surface temperatures: Examination of criticisms based on the nature and processing of proxy climate evidence. Climatic Change 85: 33–69.
60. Smerdon JE, Kaplan A, Zorita E, Gonzalez-Rouco JF, Evans MN (2011) Spatial performance of four climate field reconstruction methods targeting the Common Era. Geophysical Research Letters 38: doi:10.1029/2011gl047372.
61. Smerdon JE, Kaplan A, Chang D, Evans MN, Smerdon JE, et al. (2011) A Pseudoproxy Evaluation of the CCA and RegEM Methods for Reconstructing Climate Fields of the Last Millennium. Journal of Climate 24: 1285–1309. 62. Feng S, Qi H, Wu Q, Mann M (2012) A gridded reconstruction of warm season
precipitation fro Asia spanning the past half Millennium. Journal of Climate: doi:10.1175/JCLI-D-12-00099.1.
63. Torrence C, Compo G (1998) A practical guide to wavelet analysis. Bulletin of the American Meteorological Society 79: 61–78.
64. Gilman DL, Fuglister FJ, Mitchell JM (1963) On the Power Spectrum of ‘‘Red Noise’’. Journal of the Atmospheric Sciences 20: 182–184.
65. Vaganov EA, Anchukaitis KJ, Evans MN (2011) How Well Understood Are the Processes that Create Dendroclimatic Records? A Mechanistic Model of the Climatic Control on Conifer Tree-Ring Growth Dynamics. In: Hughes MK, Swetnam TW, Diaz HF, editors. Dendroclimatology: Progress and Prospects: Springer Netherlands. pp. 37–75.
66. Chylek P, Folland CK, Lesins G, Dubey MK, Wang M (2009) Arctic air temperature change amplification and the Atlantic Multidecadal Oscillation. Geophysical Research Letters 36: doi:10.1029/2009GL038777.
67. Mann ME, Zhang ZH, Rutherford S, Bradley RS, Hughes MK, et al. (2009) Global Signatures and Dynamical Origins of the Little Ice Age and Medieval Climate Anomaly. Science 326: 1256–1260.
68. Schlesinger ME, Ramankutty N (1994) An oscillation in the global climate system of period 65–70 years. Nature 367: 723–726.
69. Wang XC, Zhang QB (2011) Evidence of solar signals in tree rings of Smith fir from Sygera Mountain in southeast Tibet. Journal of Atmospheric and Solar-Terrestrial Physics 73: 1959–1966.
70. Wei W, Lohmann G (2012) Simulated Atlantic Multidecadal Oscillation during the Holocene. Journal of Climate 25: 6989–7002.
71. Ting M, Kushnir Y, Seager R, Li C (2011) Robust features of Atlantic multi-decadal variability and its climate impacts. Geophysical Research Letters 38: doi:10.1029/2011GL048712.
72. Ge QS, Zheng JY, Hao ZX, Shao XM, Wang W-C, et al. (2010) Temperature variation through 2000 years in China: An uncertainty analysis of reconstruction and regional difference. Geophys Res Lett 37: doi:10.1029/2009gl041281. 73. Li J, Xie S-P, Cook ER, Huang G, D’Arrigo R, et al. (2011) Interdecadal
modulation of El Nino amplitude during the past millennium. Nature Clim Change 1: 114–118.
74. D’Arrigo R, Wilson R (2006) On the Asian expression of the PDO. International Journal of Climatology 26: 1607–1617.
75. Liang E, Liu X, Yuan Y, Qin N, Fang X, et al. (2006) The 1920s drought recorded by tree rings and historical documents in the semi-arid and arid areas of northern China. Climatic Change 79: 403–432.
76. Fang KY, Gou XH, Chen FH, Yang MX, Li JB, et al. (2009) Drought variations in the eastern part of northwest China over the past two centuries: evidence from tree rings. Climate Research 38: 129–135.
![Figure 4 compares of our reconstruction with the other results [67]; both studies used the same instrumental data and CRUTEM3v for the past 500 years](https://thumb-eu.123doks.com/thumbv2/123dok_br/16390530.192665/8.918.89.602.93.442/figure-compares-reconstruction-results-studies-instrumental-crutem-years.webp)
![Figure 6 compares between our temperature reconstruction with other reconstructions of temperature [5,36,72], precipitation [33], the El Nin˜o-Southern Oscillation (ENSO) [73], and the Pacific Decadal Oscillation (PDO) [74]](https://thumb-eu.123doks.com/thumbv2/123dok_br/16390530.192665/9.918.92.764.91.490/temperature-reconstruction-reconstructions-temperature-precipitation-southern-oscillation-oscillation.webp)