EURASIAN JOURNAL OF BUSINESS AND
MANAGEMENT
http://www.eurasianpublications.com
B
USINESS AND
E
NTREPRENEURSHIP IN
S
OUTH
C
OASTAL
Z
ONE OF
A
TTICA
R
EGION
,
IN
G
REECE
Agisilaos Economou
Corresponding Author: National Technical University of Athens, Greece. Email: [email protected]
Roido Mitoula
Harokopio University, Greece. Email: [email protected]
Abstract
Purpose of the present paper is to investigate the evolution of the economic situation and particularly employment in Attica region in Greece. It focuses particularly on the southern coastal municipalities in the region and specifically in municipalities of Moshato, Kallithea, Paleo Faliro, Alimos, Elliniko, Voula and Vouliagmeni. Attica is an urbanized region which displays an excellence in the secondary and tertiary sectors of the economy. In addition, it is a center of advanced services with valuable human resources because of higher educational institutions hosted in the region. That means a dynamic development of high technology. The good economic situation of the study area changed in recent years, from 2009 onwards, due to the economic crisis in Greece. The poor fiscal policy resulted in swelling of the external debt of the country, has contributed not only to the economic downturn, but has also affected the welfare of residents. The economic effects are obvious in the private sector, thereby reducing business activities, revenues and lost jobs. All the above have additional effect of increasing intra-regional disparities, such as population disparities, rising unemployment, the population movements for job search and other. The paper elaborates on the economic situation and entrepreneurship in the region over the past 20 years or so including both periods of acne, and those of the last economic downturn. Using documents, tables and graphs, work draws conclusions.
Keywords: Entrepreneurship in Attica, Business in Attica
1. Introduction
15
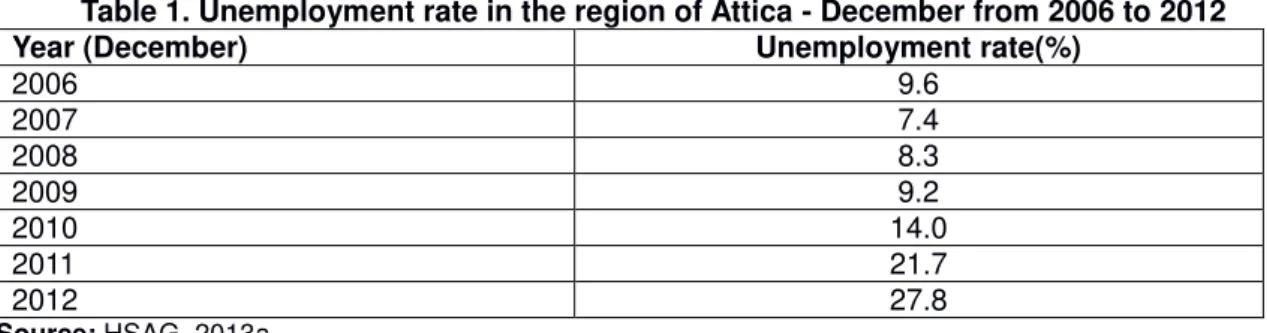
Table 1. Unemployment rate in the region of Attica - December from 2006 to 2012
Year (December) Unemployment rate(%)
2006 9.6
2007 7.4
2008 8.3
2009 9.2
2010 14.0
2011 21.7
2012 27.8
Source: HSAG, 2013a
Regarding the sectors of production that are active in the Attica region, it is noted that: The primary sector of production refers to the branch relating to floriculture, horticulture, vineyards and fishery products, mainly in the areas of Marathon at Mesogea, in islands, and areas which are not displaying tourist development. Meanwhile, traditional crops such as olives and cereals are restricted. At the same time, livestock breeding is showing a downward trend.
The reduction of the primary sector is due to the rapid urbanization of areas with agricultural around them, such as the area of Mesogea and to the increased demand for seasonal residence in the island and coastal areas, such as in the area of Trizinia.
The strengthening of the secondary manufacturing sector is due to rising construction in view of the Olympic Games in 2004 and to the construction activity for housing purposes.
Also, it is noted that while there has been a reduction of employment countrywide in the same period, the Industry in region of Attica, has presented a high growth in its gross production value, in added value and in productivity.
A large part of the industry - handicraft is concentrated on the predefined areas, handicraft park - industrial park, and in the area of the suburban zone which is not part of any urban planning zone (Thriassion Pedio, Parakifisia zone, North Attica, Lavreotiki and other).
Concerning the tertiary sector production, the region of Attica collects 36.2% of enterprises of the total of country. The largest number of firms belong to the branch of wholesale and retail trade and in real estate management. Hotels, restaurants, transport, storage, communication and other service activities follow in smaller percentages (HSAG, 2013b).
2. Gross Domestic Product of the Attica Region
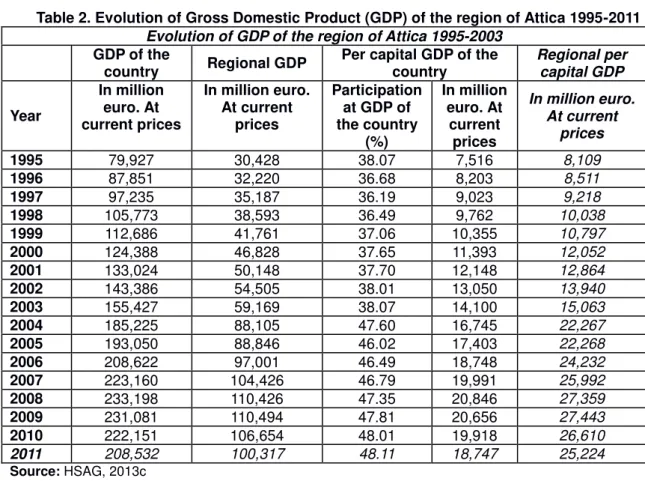
During the period 1995-2003, the region of Attica maintained a higher per capita Gross Domestic Product (GDP) than the national average. It has 40% of the total GDP of the country and maintains its dominant position in the national economy. During this period, the evolution of the Gross Domestic Product of the Region of Attica, shows a high growth rate and convergence towards the average of the European Union. During the period 1995 - 2003 the GDP has increased from 78% of the European Union average to 87%. Also, the region of Attica in 2003 held the 86th place out of 203 European regions regarding innovation performance (EEA, 2002, pp.1-64).
16
Table 2. Evolution of Gross Domestic Product (GDP) of the region of Attica 1995-2011
Evolution of GDP of the region of Attica 1995-2003
GDP of the
country Regional GDP
Per capital GDP of the country Regional per capital GDP Year In million euro. At current prices
In million euro. At current
prices
Participation at GDP of the country (%) In million euro. At current prices
In million euro. At current
prices
1995 79,927 30,428 38.07 7,516 8,109
1996 87,851 32,220 36.68 8,203 8,511
1997 97,235 35,187 36.19 9,023 9,218
1998 105,773 38,593 36.49 9,762 10,038
1999 112,686 41,761 37.06 10,355 10,797
2000 124,388 46,828 37.65 11,393 12,052
2001 133,024 50,148 37.70 12,148 12,864
2002 143,386 54,505 38.01 13,050 13,940
2003 155,427 59,169 38.07 14,100 15,063
2004 185,225 88,105 47.60 16,745 22,267
2005 193,050 88,846 46.02 17,403 22,268
2006 208,622 97,001 46.49 18,748 24,232
2007 223,160 104,426 46.79 19,991 25,992
2008 233,198 110,426 47.35 20,846 27,359
2009 231,081 110,494 47.81 20,656 27,443
2010 222,151 106,654 48.01 19,918 26,610
2011 208,532 100,317 48.11 18,747 25,224
Source: HSAG, 2013c
As said above, the region of Attica despite the reductions of industrial units and employment, is the flagship regarding the concentration of industrial activity in the country.
Generally, the region of Attica presents an extrovert economy given that a large part of the manufacturing production and services of the tertiary sector (tourism), are addressed at international markets and especially at European ones.
Finally, in the region of Attica foreign companies with activities related to transport, insurance, the financial sector and trade are established (MDCITN, 2007, pp.1-298).
Regarding regional spending on research and development, it has the first position in the country followed by the region of Central Macedonia (Table 3).
Table 3. Regional costs for research and development
Regions Gross domestic expenditure on research and development % Enterprises % Public research centres % Higher Educational Institutions % No speculative organizations %
Attica 58.21 76.16 62.39 43.66 78.31
Central
Macedonia 14.52 10.53 10.98 18.78 15.44
Crete 7.58 0.66 17.75 8.06 0.00
Western
Greece 6.94 2.48 2.84 11.92 0.00
Eastern Macedonia & Thrace
2.57 1.22 1.41 4.04 0.00
17
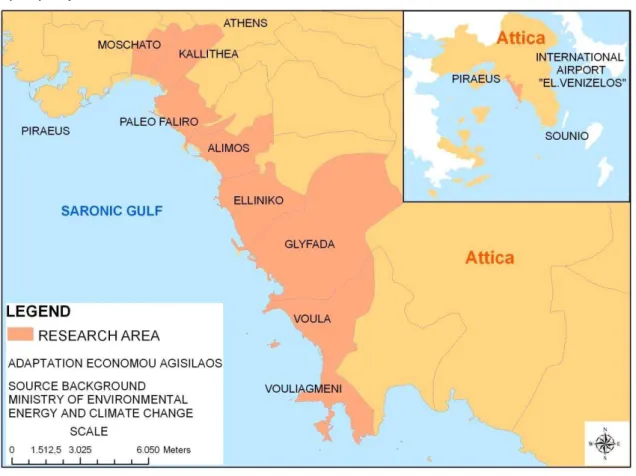
In the following pages, the paper investigates the evolution of the economic situation and particularly employment in the southern coastal municipalities of the Attica region. Specifically at the municipalities: Moschato, Kallithea, Paleo Faliro, Alimos, Elliniko and the municipal districts of Voula and Vouliagmeni (Figure 1).
The good economic situation of the regions changed in recent years, from 2009 and after, due to the economic crisis in Greece. The poor fiscal policy that has a resulted in the swelling of the external debt of the country, has contributed not only to the economic recession, but has also affected the welfare of the residents in the area in which the survey takes place.
The economic effects have been spotted in the private sector as well, resulting in a reduction of business activities, revenues and loss of jobs. This study elaborates the economic situation and entrepreneurship in the municipalities of Moschato, Kallithea, Paleo Faliro, Alimo, Elliniko and the districts of Voula and Vouliagmeni over the last 20 years, including both periods of prosperity and the last economic recession.
Figure 1. Research area
3. Results and Discussion
3.1. Moschato
According to the latest population recording of Greece, in 2011, the municipality of Moschato has 25,133 inhabitants. The development of infrastructure projects in the area has been favoured, due to its proximity to the center of Athens, its beachfront, and also the existence of significant real estate property of the municipality.
18
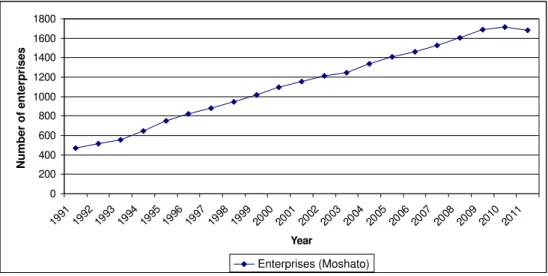
In Moshato, wholesale has the top position in the economy, followed by retail, vehicle commerce, motorcycle maintenance, trade of motor vehicle parts and trade representatives. While other enterprises such as, pharmacies, grocery stores, agricultural irrigation services and garden management, and others, are present in smaller percentages (ICG, 2012).
Taking into accounts the number of enterprises during 1991-2011 it is found that from 1991 to 2010 there was an increase in the number of enterprises, which was succeeded by a slight decline in 2011 due mainly to the impact of the economic crisis that the country has suffered since 2009 (Figure 2).
Figure 2. Number of enterprises in the area of Moschato Source: ICG, 2012
3.2. Kallithea
According to the latest population recording of Greece in 2011, the municipality of Kallithea has 98,951 inhabitants (HSAG, 2013b). In the population growth, an important role was played by the tertiarisation of the area (which started in the 60s) and the presence of a public transport network (PTN), the establishment of industries in many areas as well as the proximity of the area to the areas of Taurus and Moshato where there is secondary sector production.
The largest number of enterprises refers to wholesale and retail trade. They are followed by the branch of industry trade representatives, vehicles trade, vehicles and motorcycles maintenance and vehicle parts trade.
The rest of the enterprises, grocery stores, pharmacies and activities associated with agriculture and others, are present at lower rates (ICG, 2012).
The statistical data of the Commercial Chamber, in the period 1991 - 2011 shows that the number of enterprises has followed an upward trend from 1991 to 2010, in contrast to 2011, when it began to decline due to the current economic situation of the country, which has resulting in the closing of some businesses (Figure 3).
0 200 400 600 800 1000 1200 1400 1600 1800
1991 19921993 1994 19951996 1997 1998 1999 2000 2001 2002 2003 2004 2005 2006 2007 2008 20092010 2011
Year
Number of enter
prises
19
Figure 3. Number of enterprises in the area of Kallithea Source: ICG, 2012
3.3. Paleo Faliro
According to the latest population recording of Greece in 2011, the municipality of Paleo Faliro has 25,133 inhabitants (HSAG, 2013b) The population growth has been strengthened by the quest of residents of the capital city center for a better quality of life. The area of Faliro, due to its seafront and its proximity to the center of Athens, was an ideal location for those who wanted a better quality of life without being too far from the center of the capital city.
The largest number of enterprises refers to wholesale and retail trade. They are followed by the branch of industry trade representatives, vehicles trade, vehicles and motorcycles maintenance and vehicle parts trade.
The rest of the enterprises such as, grocery stores, pharmacies, activities associated with agriculture and others, are present at lower rates.
Paleo Faliro during the last decades showed a significant increase in the number of enterprises up to 2010, while in 2011 the number of enterprises was stable, despite the country's economic recession from 2009 and afterwards (Figure 4).
Figure 4. Number of enterprises in the area of Paleo Faliro Source: ICG, 2012
0 1000 2000 3000 4000 5000 6000 7000 8000
1991 19921993 1994 19951996 1997 1998 1999 2000 2001 2002 2003 2004 2005 2006 2007 2008 20092010 2011
Year
Number of enter
prises
Enterprises (Kallithea)
0 500 1000 1500 2000 2500 3000 3500
1991 1992 1993 1994 1995 1996 1997 1998 1999 2000 2001 2002 2003 2004 2005 2006 2007 2008 2009 2010 2011
Year
Number of enter
prises
20 3.4. Alimos
According to the latest population recording of Greece in 2011, the municipality of Alimos has 41,153 inhabitants (HSAG, 2013b).
In the area of Alimos there are department stores and many financially active companies. A great number of enterprises refer to wholesale and retail trade. They are followed by the branch of commercial representatives, vehicles trade, vehicles and motorcycles maintenance and vehicle parts trade.
The rest of the enterprises, grocery stores, pharmacies, activities associated with agriculture, and others, are present at lower rates (ICG, 2012).
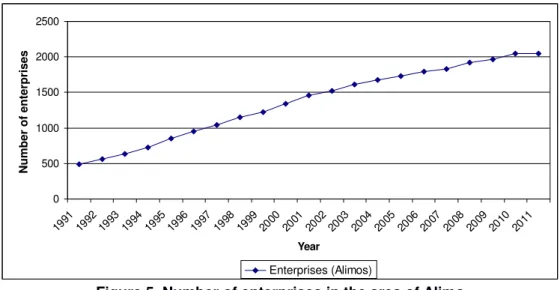
During the last decades, the area of Alimo has presented an increase in the number of enterprises (from 1991-2010), in contrast to 2011, where a stability in the number of enterprises is found, due to the country's economic crisis (Figure 5).
Figure 5. Number of enterprises in the area of Alimo
Source: ICG, 2012
3.5. Elliniko
According to the latest population recording of Greece in 2011, the municipality of Elliniko has 17,200 inhabitants (HSAG, 2013b).
In Elliniko during the period time 1991-2010 the largest number of enterprises refered to wholesale and retail trade, followed by the branch of commercial representatives and vehicle parts trade. These enterprises have shown a sharp decline in 2011.
Also, it was observed that there are no activities associated with agriculture, except for irrigation provision and garden management services (ICG, 2012).
According to the statistical data of the Industrial Chamber of Greece, it is found that during the period 1991-1993 there was a sharp increase in the number of enterprises, which was accompanied by a downward trend the following year. By 2008 the number of companies remained at the same level as in previous years. From 2008 and afterwards, there has been a significant reduction in the number of enterprises up to 2011 (Figure 6). The country's economic recession, the removal of the former airport of "Elliniko" and the non-utilization of the area of the old airport until now, resulted in the closing of many enterprises.
0 500 1000 1500 2000 2500
1991 1992 1993 1994 1995 1996 1997 1998 1999 2000 2001 2002 2003 2004 2005 2006 2007 2008 2009 2010 2011
Year
Number of enter
prises
21
Figure 6. Number of enterprises in the area of Elliniko
Source: ICG, 2012
3.6. Glyfada
According to the latest population recording of 2011, the municipality of Glyfada has 86,393 inhabitants (HSAG, 2013b).
Glyfada has been developed mainly due to its good climate and natural resources (mountains, sea and open space). Also, the population evolution in the area has been strengthened by the operation of the airport of Elliniko, which had contributed to the tourist development of the area and the activities of the tertiary sector.
In Glyfada during the period 1991-2001 an increase of retail had been noted. It was followed by wholesale, while other activities, such as commercial representatives, vehicles trade and vehicles and motorcycles maintenance were present at lower rates. Other activities such as pharmacies, grocery stores, and activities related to agriculture exist at small rates as well (ICG, 2012).
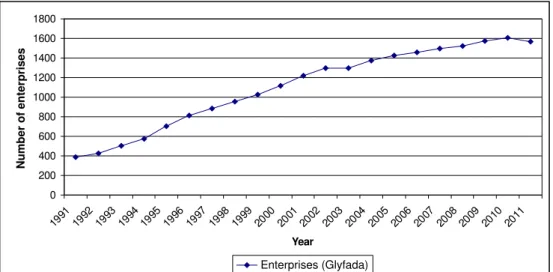
According to the statistical data of the Industrial Chamber of Greece, the enterprises in the area of Glyfada, showed an upward trend during the period 1991-2010. However, in 2011 the number of enterprises began a slight decrease due mainly to the unfavorable economic situation due to the large external debt (Figure 7).
Figure 7. Number of enterprises in the area of Glyfada Source: ICG, 2012
0 20 40 60 80 100 120
1991 1992 1993 1994 1995 1996 1997 1998 1999 2000 2001 2002 2003 2004 2005 2006 2007 2008 2009 2010 2011
Year
Number of enter
prises
Enterprises (Elliniko)
0 200 400 600 800 1000 1200 1400 1600 1800
1991 1992 1993 1994 1995 1996 1997 1998 1999 2000 20012002 2003 2004 2005 2006 2007 2008 2009 2010 2011
Year
Number of enter
prises
22 3.7. Voula
According to the latest population recording of 2011, the municipal district of Voula has 28,314 inhabitants (HSAG, 2013b).
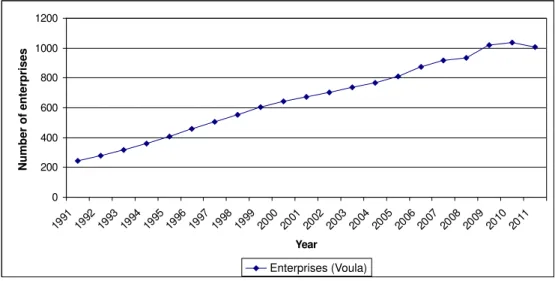
The number of enterprises in the area of Voula showed an upward trend from 1991 to 2009, which was accompanied by a stability in 2010 and a slight decline in 2011 due to the economic recession in the country (Figure 8).
The largest number of enterprises refer to wholesale and retail trade. They are followed by the branch of commercial representatives, vehicles trade, vehicles and motorcycles maintenance and vehicle parts trade.
Other activities such as pharmacies, grocery stores and activities associated with agriculture exist at very low rates (ICG, 2012).
Figure 8. Number of enterprises in the area of Voula Source: ICG, 2012
3.8. Vouliagmeni
According to the latest population recording of 2011, the municipal district of Vouliagmeni has 4,759 inhabitants (HSAG, 2013b).
The largest number of enterprises in the area refer to wholesale and retail trade. They are followed by the branch of commercial representatives while vehicles trade, vehicles and motorcycles maintenance and vehicles accessories trade are found at very low rates. Also, at the same low rates, one finds other activities that are relevant to agricultural crops (citrus, flowers).
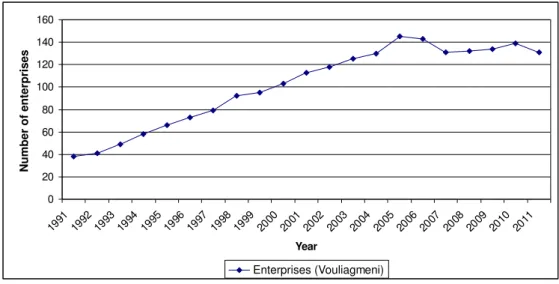
In Vouliagmeni, the upward trend in the number of enterprises from 1991 to 2005 was followed by a slight decline until 2009, then there was a slight increase which was then followed again by a slight decline in 2011 due to the economic recession in the country (Figure 9).
0 200 400 600 800 1000 1200
1991 1992 1993 1994 1995 1996 1997 1998 1999 2000 2001 2002 2003 2004 2005 2006 2007 2008 2009 2010 2011
Year
Number of enter
prises
23
Figure 9. Number of enterprises in the area of Vouliagmeni Source: ICG, 2012
5. Conclusion
The aim of this study was to investigate the economic situation and entrepreneurship in the region over the last 20 years including both periods of prosperity, and those of the last economic recession. The investigation focused on the southern coastal areas of the region and specifically in municipalities Moschato, Kallithea, Paleo Faliro, Alimo, Elliniko and municipalities districts of Voula and Vouliagmeni.
From the presentation and display of the above published data for the survey on the coastal municipalities of the Attica Region, it is found that an increase in the number of enterprises from 1990 and afterwards has occured.
According to the statistical data of the Chamber of Industry, in the coastal region enterprises of the commercial sector dominate, while there are no enterprises of the industrial sector. The highest levels of growth of enterprises, during the last two decades, has been observed in the area of Kallithea followed by Paleo Faliro, Alimos, Muschato, Glyfada, Voula, Vouliagmeni and Elliniko.
The largest percentage of enterprises belong to wholesale and retail trade followed by commercial representatives, vehicles maintenance and trade, while the remaining enterprises (supermarkets, grocery stores, pharmacies, agricultural services regarding irrigation and garden management) are present at lower percentages. It is underlined that the participation in the economy, of enterprises that have to do with agriculture (crops, livestock and poultry farming) which occur in some areas, is small.
These above enterprises have to do with serving the population at a local level, in others words local consumption. Taking this into account, we note that besides giving employment to the local population, they cannot be considered as a lever for general growth.
By observing the graphs, we can see that in all the coastal municipalities of southern Attica which we investigated, a slight decrease in enterprises since the year 2009 has been found. This is due to the economic crisis that the country has been facing lately. However, the municipalities of Alimos and Paleo Faliro, present an economic stability which can be investigated by further survey.
0 20 40 60 80 100 120 140 160
1991 1992 1993 1994 1995 1996 1997 1998 1999 2000 2001 2002 2003 2004 2005 2006 2007 2008 2009 2010 2011
Year
Number of enter
prises
24 References
EEA (European Environment Agency), 2002. Paving the way for EU enlargement - Indicators of transport and environment integration - TERM 2002. Copenhagen: EEA, pp. 1-64. [online] Available at: <http://eea.eu.int>
Eurostat Cronos Database, 2006. Eurostat statistics. [online] Available at:
<http://epp.eurostat.ec.europa.eu/portal/page/portal/statistics/search_database> HSAG (Hellenic Statistical Authority of Greece), 2006. Statistical data: Press release, labour
force survey. Athens: HSAG.
HSAG (Hellenic Statistical Authority of Greece), 2013a. Statistical data: Press release, labour force survey. Athens: HSAG.
HSAG (Hellenic Statistical Authority of Greece), 2013b. Statistical data: Census of population 2011 Greek. Athens: HSAG.
HSAG (Hellenic Statistical Authority of Greece), 2013c. Statistical data: Gross Domestic Product in Greece. Athens: HSAG.
ICG (Hellenic Statistical Authority of Greece), 2012. Statistical data for employment in the area of Attica. Athens: ICG.