The benefits of global scaling in multi-criteria decision analysis
Jamie P. Monat
∗Department of Corporate and Professional Education
Worcester Polytechnic Institute
Abstract
When there are multiple competing objectives in a decision-making process, Multi-Attribute Choice scoring models are excellent tools, permitting the incorporation of both subjective and objective attributes. However, their accuracy de-pends upon the subjective techniques used to construct the attribute scales and their concomitant weights. Conventional techniques using local scales tend to overemphasize small differences in attribute measures, which may yield erroneous conclusions. The Range Sensitivity Principle (RSP) is often invoked to adjust attribute weights when local scales are used. In practice, however, decision makers often do not follow the prescriptions of the Range Sensitivity Principle and under-adjust the weights, resulting in potentially poor decisions. Examples are discussed as is a proposed solution: the use of global scales instead of local scales.
Keywords: decision analysis, multiple criteria analysis, range sensitivity, global scale, local scale, importance weight, swing weight.
1
Introduction
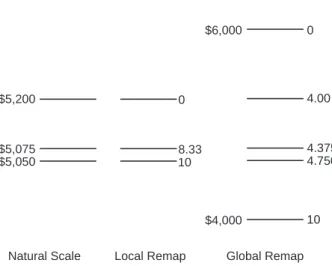
Multi-Attribute Choice scoring model techniques such as the Simple Multi-Attribute Review Technique (SMART) and its improvements (SMARTS, SMARTER) (Edwards & Barron, 1994), MAVT, and MAUT are excellent tools for decision making, permitting the incorporation of both objective and subjective attributes into the decision-making process. They typically require the assignment of a weight to each attribute that is thought relevant in conjunction with the development of some correspond-ing attribute scale. However, their utility depends upon the techniques used both to construct the attribute scales and to determine the proper weights. In Figure 1, several scale choices are shown for an example involving 3 large screen plasma TVs that cost $5,200, $5,075, and $5,050. The scale choices depicted are: Natural Scale, a Lo-cal SLo-cale, and a Global SLo-cale. Definitions are presented below:
Option set. The group of data points for the parameter (e.g., price, style, comfort) currently under consid-eration. In Figure 1, the option set consists of the 3 data points $5,200, $5,075, and $5,050.
Natural scale. The unadulterated values of the parame-ter being measured in their original units (e.g., dol-lars) showing the full range (all values) of samples
∗Address: Department of Corporate and Professional Education,
Worcester Polytechnic Institute, 100 Institute Road, Worcester, MA 01609. Email: [email protected].
in the option set. In Figure 1 the natural scale ranges from $5,050 to $5,200.
Local scale. A remapped scale in which the best value from the natural scale has been remapped to 1, 10, or 100 while the worst value from the natural scale has been remapped to 0. In Figure 1, the natural value of $5,050 has been remapped to 10 on the local scale while the natural value of $5,200 has been remapped to 0 on the local scale.
0
8.33 10
Natural Scale Local Remap Global Remap $5,200
$5,075 $5,050
$6,000
$4,000
4.00
4.375 4.750 0
10
Figure 1: Natural and remapped scales for prices of $5,050; $5,075; and $5,200. For the global remapping the decision-maker established the global extremes as $6,000 (worthy of a score of 0) and $4,000 (worthy of a score of 10).
Global scale. A remapped scale in which the best value from the decision-maker’s experience, aspirations, or imagination(not the best value from the option set) has been remapped to 1, 10, or 100 while the worst value from the decision-maker’s experience, aspirations, or imagination has been remapped to 0. In Figure 1, the natural value of $4,000 has been remapped to 10 on the global scale while the natu-ral value of $6,000 has been remapped to 0 on the global scale. In global scaling, the decision-maker must determine the endpoints of the scale, that is what natural value is worthy of a score of 0 and what natural value is worthy of a score of 10. Unlike some definitions, this definition of Global Scale does not includeallpossible values of the parameter but only the range bounded by extremes corresponding to the decision-maker’s perception of values of 0 and 10. Intermediate values are interpolated.
Global extremes. The natural values corresponding to the global scale extremes. In Figure 1 the Global Extremes are $4,000 and $6,000.
Multiattribute value function. A mathematical expres-sion that combines attribute ratings from 2 or more categories or attributes (such as price, style, and comfort) with category importances or weights to ar-rive at a single number that represents the net value of a choice under consideration.
Category weight. A scaling constant that indicates the importance or weight of a particular category or at-tribute relative to the total multiatat-tribute value func-tion. Category weights are indicated by the kis in
the following equation for the additive multiattribute value function v of option a:
v(a) = n X
i=1
kivi(a)
where the vis represent the single-attribute value
functions for attribute i of option a. The index i varies from 1 to n, the total number of attributes con-sidered.
Importance weight. A category weight based on the decision-maker’s perception of how important the category is relative to other categories under consid-eration.
Swing weight. A category weight based on the decision-maker’s perception of how important the category’s swing in values(from worst to best) is relative to the swings in values for other categories under consid-eration.
Weight correction due to scale. An adjustment in cat-egory weight based upon the range r of a new or local scale relative to the range R of an origi-nal or global scale. For linear value functions the ideal correction factor is simply the ratio r/R so that (ideal normalized new weight) = (normalized origi-nal weight)(r/R).
Range Sensitivity Index, RSI. The RSI (Von Nitzsch & Weber, 1993) indicates the accuracy of the weight correction due to scale and is equal to 1.0 when the weights are adjusted optimally and equal to 0 when no weight adjustment is made. The farther the RSI is from 1.0, the poorer the correction (see Appendix).
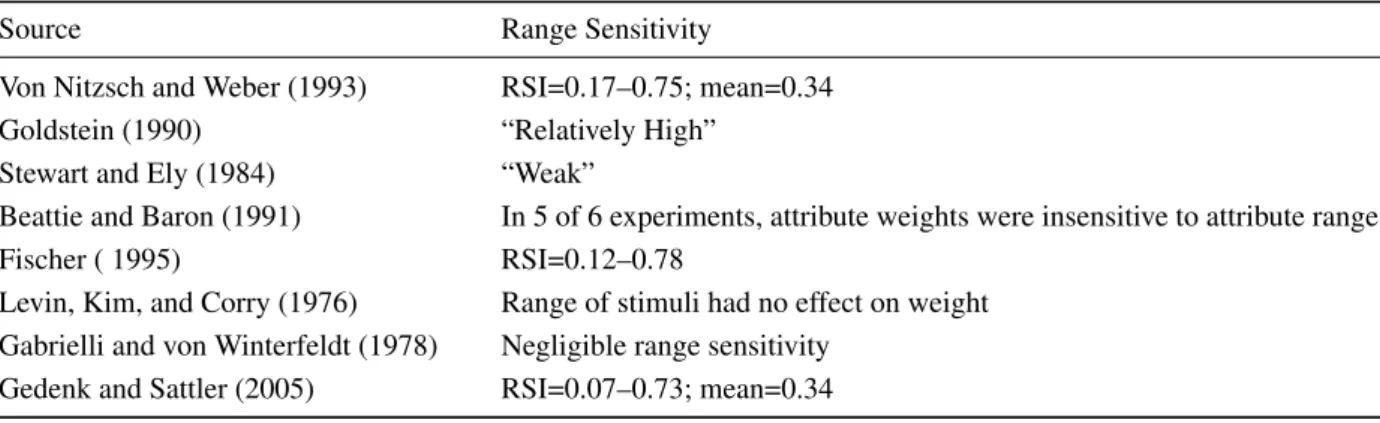
Weights and scales are not independent and the elici-tation techniques used must yield the appropriate math-ematical relationship between the two. This has proven problematic. Those techniques advocated by Keeny and Raiffa (1976), by Clemen and Reilly (2001), by Good-win and Wright (2001), and by many others, which are based on the use oflocal scales, tend to amplify small dif-ferences in attributes measured on natural scales, which may lead to erroneous conclusions. Attempts to mitigate the errors introduced by using local scales in conjunc-tion with importance weights often focus on the Range Sensitivity Principle (RSP) which mandates that the cate-gory weights applied to each criterion should be adjusted so that they are proportional to the ranges of the alterna-tives for that criterion: small ranges should yield corre-spondingly small weights, and vice versa. However, peo-ple have trouble adequately adjusting the weights; every study reported in the literature indicates that the Range Sensitivity Principle is violated, often significantly, with Range Sensitivity Indexes rarely approaching 1.0 (ideal) and often well below 0.30 (Von Nitzsch & Weber, 1993; Fischer, 1995; Beattie & Baron, 1991; Yeung & Soman, 2005; Gedenk & Sattler, 2005); see Table 1.Thus, when local scales were used, category weights were often ad-justed substantially less than that mandated by the Range Sensitivity Principle.
hu-Table 1: Literature values for range sensitivity (RSI = range sensitivity index; ideal RSI=1.0)
Source Range Sensitivity
Von Nitzsch and Weber (1993) RSI=0.17–0.75; mean=0.34
Goldstein (1990) “Relatively High”
Stewart and Ely (1984) “Weak”
Beattie and Baron (1991) In 5 of 6 experiments, attribute weights were insensitive to attribute range.
Fischer ( 1995) RSI=0.12–0.78
Levin, Kim, and Corry (1976) Range of stimuli had no effect on weight Gabrielli and von Winterfeldt (1978) Negligible range sensitivity
Gedenk and Sattler (2005) RSI=0.07–0.73; mean=0.34
man psychology and that is not prone to errors due to low RSIs. Global Scaling satisfies these requirements and im-proves the utility of the existing normative model.
This research makes several contributions to the field of MCDA:
1. It demonstrates that conventional normative meth-ods mandating local scales can lead to decision errors in certain situations.
2. It prescribes a modification (global scaling) that re-duces these errors.
3. It demonstrates the proper procedure for construct-ing global scales.
4. It demonstrates the advantages of global scaling ex-perimentally.
2
Theoretical
Basic multi-attribute choice scoring models require 4 steps: 1) the construction of a complete attribute tree, 2) the scoring of alternatives using subjective or objec-tive scales, 3) the weighting or assignment of relaobjec-tive importance of the various attributes, and 4) the integra-tion of these values into one net score for each candi-date. In step 2, when local scales are used, differences in objective attribute values are typically transformed to use the full range of the attribute scale (typically 0–1, 0– 10, or 0–100). Thus the poorest choice among the lo-cal option choices available, not among the entire uni-verseof choices, would get a score of 0 and the best, 100. This forced transformation may over-emphasize the im-portance of small differences in attribute values and con-sequently lead to wrong conclusions. There does not ap-pear to be a strong theoretical basis for local scales and their use has been based primarily on calculational con-venience, on reducing the chance of an incorrect assump-tion of preferential independence by virtue of the smaller range, or on the argument that it facilitates decision-making by amplifying small differences (Hämäläinen,
2002; Fischer, 1995). Unfortunately, this amplification can lead to the wrong conclusion.
2.1
Relevant literature
There is substantial literature showing that the use of local scales precludes the use of importance weights in MCDA (see for example Goodwin & Wright, 2004) because importance weights will assign inappropriate weights to specific criteria when the range of values for that criterion is small, and vice-versa. The conventional prescriptive solution to this problem is an adjustment in the weights per the Range Sensitivity Principle via tech-niques such as swing weighting. In practice, though, decision makers typically under-adjust weights signifi-cantly. Because the methodology is fairly robust, this under-adjustment often does not affect the final outcome. In certain circumstances, however, the use of local scales leads to the wrong conclusion. Local scaling appears to be accepted as standard operating procedure for MCDA while global scaling is infrequently mentioned in the lit-erature.
Four groups of researchers who do discuss global scal-ing are Bana e Costa, Lourenço, Chagas, and Bana e Costa (2008), Botta and Bahill (2007), Trainor and Par-nell (2008), and Hämäläinen (2002). Bana e Costa et al. used global scaling (based not upon selection of extreme values but instead based upon identification of “good” and “neutral” values) in conjunction with swing weight-ing. They used ordinal pair-wise comparisons instead of cardinal comparisons and then used a computer pro-gram to translate into numbers. Botta and Bahill also described global scaling based upon legally imposed ex-treme values, maximum/minimum constraints imposed by customers, or the “highest and lowest values ever ex-pected”; they also used swing weights.
required to operate a rocket system. They also used swing weighting. Hämäläinen discussed “actual,”, “ac-ceptable,” “available,” and “theoretically feasible” ranges which suggest global scales. We are unaware of re-searchers who used global scaling in conjunction with importance weights and we question the wisdom of us-ing swus-ing weights with global scales inasmuch as do-ing so appears to address scale range issues twice: once when assigning values based on global scales and again when assigning swing weights. If global scaling accu-rately maps relative values of the various choices then the use of importance weights should be all that is nec-essary for proper preference elicitation. Other than Bana e Costa et al., Botta and Bahill, Trainor and Parnell et al., and Hämäläinen, there is little literature discussing global scaling.
In other relevant discussions, several references (Bel-ton & Stewart, 2002; Weber & Borcherding, 1993) ad-monish the practitioner to ensure that his selection of at-tribute weights is consistent with whichever scale is cho-sen. Some references (Belton & Stewart, 2002) state that local scales are fine for “roughing out” problems or for quick answers. Others (Gustaffson, 2000) note that linking attribute weights to the value scales may prove difficult. And, there are warnings that the use of local scales makes it difficult to subsequently add new choices whose values fall outside the range of the local scale. But nowhere does the literature discuss the outright decision errors that may accrue from local scaling and many re-searchers continue to use it as standard operating proce-dure (see e.g., Moshkovich et al., 2002; Roberts & Good-win, 2002; and Phillips & Bana e Costa, 2007).
Several researchers have investigated the Range Sen-sitivity Principle and the effects of range on category weights. In 1976 Levin, Kim, and Corry studied the im-pact of stimulus range on weight using college students to assess student performance as a function of mid-term and final exam grades. They varied the reported range of test scores and found that weights did not vary with stimulus range. In unpublished work, Gabrielli and von Winterfeldt (1978) found negligible sensitivity of crite-ria weight to critecrite-ria range. Stewart and Ely (1984) used swing weighting to assess various pollution control re-sults and found that the range sensitivity principle was violated significantly. They hypothesized that “The fail-ure to meet the range-sensitivity requirement suggests that the elicited weights represented general values or at-titudes toward the criteria, not specific tradeoffs among them.”
Goldstein (1990) studied local vs global interpretations of importance by examining graduate students’ prefer-ence for a variety of apartments as the range of rents varied from wide to narrow. He speculates that people may prefer global importance weights because they better
communicate “the structure of their preferences to other people” without depending on a local context. His ex-perimental results indicated that subjects adjust weights as attribute ranges vary, but he did not calculate a RSI or determine if weights varied per the normative model. He concluded that people do not maintain global interpreta-tions of importance.
Conversely, Beattie and Baron (1991) conducted a se-ries of experiments in which subjects were asked to assess weights while provided varying degrees of information about attribute ranges. In their study, 5 out of 6 experi-ments showed no range sensitivity. The 6th showed
sub-stantial range sensitivity in a situation involving arbitrary scales of leadership and interpersonal skills that were in-tentionally constructed so that respondents could not re-late them to any prior experience or knowledge. Beattie and Baron state, “In this case the surrounding stimuli are clearly relevant in making the value judgment, and thus it seems entirely reasonable to take them into account.” They note that the respondents’ judgments were “not en-tirely determined by the range of the attributes” and spec-ulate that some anchoring on the mean value of each di-mension was displayed. Beattie and Baron concluded that their data supported the concept of “true weight,” or weight that is invariant with context and they specu-lated that there is a moral basis for this. They focused on weight elicitation methods but did not address opti-mal scaling when using true weights. They also observed that decision makers experienced significant difficulty in making tradeoffs.
Von Nitzsch and Weber (1993) developed a Range Sensitivity Index (RSI) to measure the empirically ob-served adjustment of weights relative to the adjustment prescribed by the normative model. They found that the empirically observed adjustments were typically half those mandated by the model. They did not explore the decision errors that may accrue as a result. Weber and Borcherding (1993) reviewed the previous work of Von Nitzsch and Weber (1993), Fischer (1990), Beattie and Baron (1991) and others and concluded that in each study decision makers do not take range adequately into ac-count when adjusting weights. They then draw the sur-prising (and in my opinion unfounded) conclusion that analysts should not use weighting methods that rely on importance judgments. They further concluded that there exists evidence for both local and global interpretations of attribute weight, but they do not propose an explana-tion for the disparate data. Mellers and Cooke (1994) also found invariance of attribute weight with range, but a sensitivity of scale factors to range.
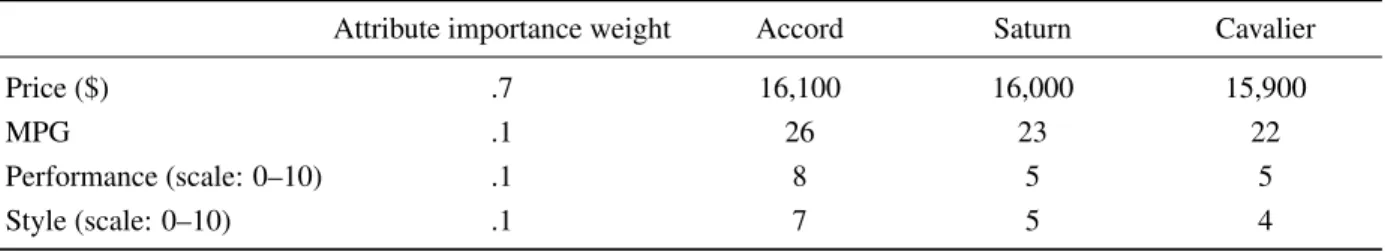
Table 2: Automobile attributes for Example 1.
Attribute importance weight Accord Saturn Cavalier
Price ($) .7 16,100 16,000 15,900
MPG .1 26 23 22
Performance (scale: 0–10) .1 8 5 5
Style (scale: 0–10) .1 7 5 4
Table 3: Automobile attributes adjusted to 0–10 scale.
Attribute importance weight Accord Saturn Cavalier
Price ($) .7 16,100→0 16,000→5 15,900→10
MPG .1 26→10 23→2.5 22→0
Performance (scale: 0–10) .1 8→10 5→0 5→0
Style (scale: 0–10) .1 7→10 5→3.33 4→0
Tradeoff methods yielded the highest range sensitiv-ity (0.63<RSI<0.78), swing-weighting yielded interme-diate range sensitivity (RSI=0.62), and direct impor-tance weighting yielded the lowest range sensitivity (RSI=0.12). Fischer explained the differences in terms of avalue comparison hypothesis: “The greater the degree to which a weight assessment task requires cross attribute comparisons of values or value differences, the more sen-sitive the evoked weights will be to the range of attribute values in the local decision context.” Fischer also posited that “...intuitive perceptions of attribute importance are independent of the range of outcomes in the local con-text or that people provide their own implicit concon-text.” Yet Fischer argued in favor of local scales: “A local de-scription is often the most natural because the range of outcomes in the local context may be so small relative to the global context that the local outcomes may appear in-distinguishable.” He further developed the Range Sensi-tivity Principle which argues that attribute weights should vary in proportion to their ranges. Despite Fischer’s ob-servation that perceptions of weight are independent of attribute range, and despite experimental determinations of RSIs that are between 22% and 88% below the opti-mum of 1.0, since swing weighting and direct trade-off weighting yielded RSIs closer to 1.0, he concluded that they both are preferable to importance weighting. How-ever Fischer did not assess the benefits of using direct importance weighting in conjunction with a global scale.
Highhouse et al., (1999) found a significant impact of salary range on job choice. However they did not break their assessment procedure into weighting factors and attribute ratings. Pöyhönen and Hämäläinen (2001) compared several multiattribute weighting techniques but
could not determine a clear winner. They were unable to determine whether or not decision makers adequately adjust category weights for attribute range. Yeung and Soman (2005) evaluated range sensitivity as a function of attribute evaluability. They determined that greater evalu-ability led to greater sensitivity to range. They did not calculate RSIs or determine if their data fit the normative model.
The inevitable conclusion from all the literature is that normal people do not and cannot adequately adjust cri-teria weights for attribute range per the RSP. There are also substantial experimental and field data supporting the concept of global, true, or importance weights that people are reluctant to change. These data therefore sug-gest that local scaling in conjunction with swing weight-ing is inconsistent with human psychology. However, the literature does not discuss the decision errors that may be caused by the violations of the prescriptive model. Sev-eral examples illustrate these points.
2.2
Examples
Table 4: Weights corrected using Range Sensitivity Principle, RSP (RSI=Range Sensitivity Index; Ideally RSI=1.0)
Uncorrected global weights
Weights ideally adjusted per rsp to yield a RSI=1.0
Weights that would yield a RSI=0.62
Price .7 .179 .507
MPG .1 .205 .132
Performance .1 .308 .181
Style .1 .308 .181
To demonstrate possible errors, Table 2 has been set up to include one attribute (price) that is weighted heavily and whose alternative values are very close. Using local scaling, the next step is to adjust the subjective scores to maximize the differences among alternatives, transform-ing the range of each attribute to a full 0–10 range on a localscale (Table 3):
If no correction for range is made (viz RSI = 0), then applying the weights to the scores and summing yields a net weighted score of 0.3 for the Accord, 4.083 for the Saturn, and 7.0 for the Cavalier, and the Cavalier is se-lected as the best choice for this individual. Clearly, this conclusion does not make sense. The Cavalier is dom-inated by both the Saturn and the Accord in every cat-egory except price. Price is very important to the pur-chaser; however, the difference in prices of the 3 cars is insignificant (+/- 0.6%) and it is unlikely that any reason-able person would choose the Cavalier. Yet, because no range correction was made, the negligible differences in price have been assigned inappropriate significance. This is the crux of the problem when importance weights + local scales are used with no range correction.
In theory, this type of error is mitigated by the Range Sensitivity Principle (RSP) which mandates that the cat-egory weights be adjusted depending upon the range, and various techniques (such as swing weighting) are used for this. Typical literature values for RSI average be-tween 0.2 and 0.4 (recall that ideal RSI=1.0) indicat-ing substantial adjustment. But do these under-adjustments/low real-world RSIs significantly affect de-cision analysis conclusions, and if so, how high must the RSI be to ensure accuracy? The following calculations show that it must be surprisingly high; >0.62. If the un-corrected importance weights are adjusted for range ac-cording to the RSP following the method of Von Nitzsch and Weber (1993; see Appendix) using a global range for price of $8,000, one obtains Table 4.
The middle column of this table list the weights ideally adjusted to yield a Range Sensitivity Index (RSI) of 1.0. The last column of this table lists the weights arbitrarily adjusted to yield a RSI of 0.62. Certainly, using the ideal values corresponding to RSI=1.0 (middle column) would
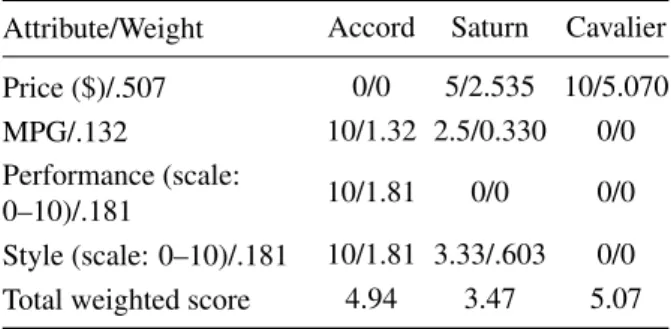
Table 5: Net scores with weights corrected using RSI=0.62.
Attribute/Weight Accord Saturn Cavalier
Price ($)/.507 0/0 5/2.535 10/5.070
MPG/.132 10/1.32 2.5/0.330 0/0
Performance (scale:
0–10)/.181 10/1.81 0/0 0/0
Style (scale: 0–10)/.181 10/1.81 3.33/.603 0/0 Total weighted score 4.94 3.47 5.07
yield the correct decision, that is, the Accord is the best car. People almost never adjust the weights to this ideal degree. Using the more realistic adjusted weight values corresponding to RSI=0.62 yields Table 5.
This indicates that the Cavalier is again selected as the best car, showing that even with RSIs as high as 0.62 the wrong conclusion may be drawn. Thus, in this caseRSIs must be greater than 0.62 to ensure accurate conclusions when the choices among a heavily-weighted attribute are close in value. RSIs are rarely this high. This result underscores the potential weakness of local scaling tech-niques that rely upon the range sensitivity principal.
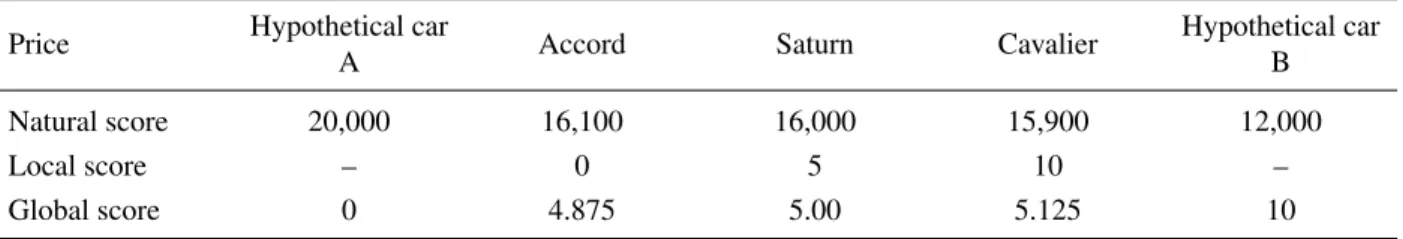
Table 6: Automobile attributes using global scales.
Price Hypothetical car
A Accord Saturn Cavalier
Hypothetical car B
Natural score 20,000 16,100 16,000 15,900 12,000
Local score – 0 5 10 –
Global score 0 4.875 5.00 5.125 10
linear interpolation.1 (Note that “global” in this context
refers to the locus of the decision-maker’s experiences, imagination, or aspirations, not the locus ofallpossible values.) Doing so yields Table 6.
The use of the global scale provides new scores that are much better indicators of the subjective values of the 3 prices than were the old scores. Doing this for MPG as well (using 12 mpg and 35 mpg as the extremes of the global MPG scale) and applying these new global scores to the summary table yields Table 7.
Now the Accord is clearly the best choice. In this case, the small differences in car price are weighted appropri-ately, not artificially inflated to emphasize small differ-ences. The Accord is clearly the superior car, dominating the other cars in every area except price, for which all 3 cars have functionally identical values. This adjustment to the subjective rating technique prevented the wrong conclusion from being drawn.
The determination of both the extreme values of a global scale and the swing weights for a local scale is subjective. Experiments are needed to determine if it is easier for people to properly assess global scale extremes than to assess trade-offs among attributes for local scales.
The above examples show that:
1. Using a Range Sensitivity Index (RSI) of 0 can pro-vide the wrong answer when local scales are used.
2. Using a RSI as high as 0.62 in SMART can similarly provide the wrong answer.
3. Using Global Scaling and Importance Weights which are not a function of attribute range provides the correct answer.
Decision-makers rarely adjust category weights suffi-ciently to compensate for differences in attribute ranges, and people tend to rate alternatives based upon some in-tuitive concept of global (not local) scales in conjunc-tion with importance weights that remain fixed. (Inter-estingly, Von Nitzsch & Weber (1993) found that weights elicited according to some concept of an “intuitive range” were not better predictors of decision-makers’ prefer-ences. However, they did not elicit global extremes for
1For simplicity, linear value functions are assumed. Just as for local
scales, standard methods may be used to accommodate non-linear value functions (see, e.g., Clemen & Reilly (2001), Keeney & Raiffa (1976), or Trainor and Parnell (2008)).
Table 7: Net scores using global scales.
Attribute/Weight Accord Saturn Cavalier
Price ($)/.718 4.875/3.500 5/3.590 5.125/3.680 MPG/.051 6.1/0.31 4.8/0.24 4.31/0.22 Performance
(scale: 0–10)/.131 10/1.3 0/0 0/0 Style (scale:
0–10)/.096 10/0.96 3.33/0.32 0/0 Total weighted
score 6.07 4.150 3.900
attribute scales. Thus their “intuitive ranges” were in fact local ranges.)
2.3
Global scales
Several types of global scale may be inferred.
Experiential Global Scale. An experiential global scale is based upon an individual’s personal experience with or knowledge of a particular subject. The knowl-edge may derive from what the individual has experi-enced, read, seen, or heard. The price of a dozen eggs is a good example: an individual might develop an expe-riential global scale for a dozen eggs with global extreme values of 80¢ and $3.50 based upon personal experience with egg prices or based upon a newspaper article or TV show that listed the prices for eggs in various countries. The extreme values thus represent prices that the individ-ual believes actindivid-ually exist (or existed). A maxim for this type of global scale might be “The best and worst prices I know of.”
Aspirational Global Scale. An aspirational global scale is based upon the best and worst values that an indi-vidual believes he or she could realistically achieve, that is values that are within his means or capability. Aspira-tional global scale-based automobile prices, for example, might be $12,000 and $90,000, meaning that this individ-ual believes he could never find a new car for less than $12,000 and that the maximum he could afford for one is $90,000. A suitable maxim might be “The best and worst prices I could ever hope to achieve.”
Universal Global Scale. A universal global scale is based upon the best and worst values conceivable. For eggs, for example, these values might be $0 and $10 tril-lion. Because they do not typically reflect personal values or experience and because the differences among real-world choices are usually miniscule when using them, universal global scales are not particularly useful in de-cision analysis. A maxim for this type of scale could be “The best and worst prices that could hypothetically exist anywhere in the universe.”
Constrained Global Scale. A constrained global scale is based upon extreme values that are specified. The specifications may be legal values (e.g., a 1-pound box of cereal must weigh between 0.950 and 1.050 pounds), customer constraints (e.g., the kitchen island length must be between 66 and 74 inches), specified component cost (e.g., the flux capacitor shall have a minimum manufac-tured cost of 79¢ and a maximum cost of $2.83), etc. A suitable maxim might be “The best and worst prices al-lowed.” Note that in this case the most desirable value might be in the middle of the range and the least desir-able values might be the 2 extremes.
There are undoubtedly other types of global scale as well. People use different types of global scale depending upon the situation (see “experiments” section). If an in-dividual has reasonable experience in the topic, she may use an experiential global scale. For example, in decid-ing if $1.20 is a good price for a dozen eggs, a person might invoke her past experience with egg prices. On the other hand, when confronted with hypothetical or spec-ulative issues for which the individual has little direct or referential experience, she may use an aspirational global scale. For example, the question “Which is more impor-tant to you: saving lives or saving money, and how many times?” may elicit a response based on how many lives the individual feels she may ultimately have the ability to save and how much money she may have the ability to save within her lifetime. Most people do not have direct experience trading off saving money for saving lives.
Global scales are not necessarily fixed, but may vary over time. In 1973, a colleague thought that 40¢ and 15¢ were terrible and excellent prices for a gallon of gasoline and those values represented the extremes of his experi-ential global scale. Today his extreme values are $4.00
and $1.25 and they are changing weekly as the price of crude oil fluctuates. The global scale ranges may either swell over time (as with gasoline) or shrink. In 1980 an-other colleague thought that 25% and 5% were excellent and poor annual salary increases. Today, her experiential global extremes are 8% and 0%.
Our feelings and perceptions of “good” and “bad” change as we experience new things, as we learn more, and as the world changes around us. We cannot use a 1970s global scale to decide today which are good and bad prices or quality levels for cars. As individuals’ per-ceptions of “good,” “bad,” and “mediocre” change, so do their global scales. This is another potential advan-tage of global scales over local scales. Global scales can change over time to reflect changes in perceived values; local scales cannot.
Global scales may be influenced by the prominence effect (Tversky, Sattath, & Slovic, 1988) and by cogni-tive biases such as representacogni-tiveness, availability, and anchoring. These are topics for future research.
Global Scale Construction.Global scales may be con-structed by asking the decision-maker to select an at-tribute value from the natural scale that he would describe as “excellent” or worth a score of 10 and another at-tribute value that he would describe as “terrible” or worth a score of 0. The analyst need not specify whether the decision-maker should use an experiential, aspirational, or other type of global scale; but he may describe these types of global scale if it helps the decision-maker. Non-linear value functions may be accommodated by asking the decision-maker to first fix extreme values of 0 and 10 and then to fix several intermediate values between 0 and 10. It is not necessary to select the extreme values in or-der to adequately specify a global scale. Bana e costa et al. (2008) used global scaling based not upon selection of extreme values but instead based upon identification of a “good” value (set =100) and a “neutral” value (set =0.) Values of actual choices may then be <0 and >100.
3
Experiments
No experiments were conducted to demonstrate that the Range Sensitivity Index is invariably too low because am-ple literature shows this (Table 1). However, four experi-ments were conducted to:
1. determine if global scaling is a natural, intuitive ap-proach that is readily embraced by decision-makers and that provides appropriate answers;
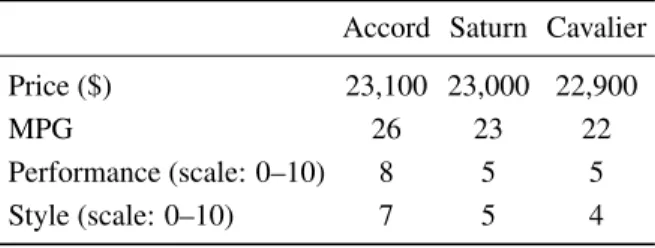
Table 8: Attribute data for experiment.
Accord Saturn Cavalier
Price ($) 23,100 23,000 22,900
MPG 26 23 22
Performance (scale: 0–10) 8 5 5
Style (scale: 0–10) 7 5 4
the choices among a heavily-weighted attribute are close in value.
These experiments were intentionally constructed to focus on situations where local scaling may be deficient: situations wherein several alternatives are rated closely in one attribute (e.g., price) and that attribute has a relatively high weight. For the first experiment, the data presented in Table 8 reflecting the attributes of 3 cars were pre-sented to 42 individual makers. The decision-makers were graduate students and staff at Worcester Polytechnic Institute, Worcester, MA in the summer and fall of 2007.
The decision-makers were informed that both the ob-jective and subob-jective ratings had been determined by experts from a national consumer testing organization. Importance weights and global scales were used in a SMART-type analysis. The ratings for Performance and Style were left as-is, as they already reflect use of a global scale. For price ratings, the decision-makers were each asked to imagine a hypothetical car A with a price that they would regard as very poor for the type of car they are considering (i.e., a regular production family sedan), and a price that was excessively high based on their ex-perience and knowledge of automobile prices. They were told that this high-price limit did not need to include any of the 3 current choices, but could come from their own personal experience with cars. They were then asked to imagine a price for a hypothetical car B that they would regard as excellent, one that was quite low, again, based upon their personal experience and knowledge. These extreme prices were then mapped to 0 and 10. The rat-ing values of the 3 cars actually under consideration were then determined by interpolation.
Global scale ratings for MPG were determined simi-larly: each respondent was asked to imagine a MPG fig-ure that they viewed as very poor; this value was mapped to a rating value of 0. The respondents were also asked to imagine, based on their own personal experience, an MPG value that they viewed as excellent, and that value was mapped to 10. The actual ratings of MPG for the 3 cars under consideration were then determined by inter-polation.
Typical results for price and MPG global scale ex-tremes (determined by averaging all responses and then rounding) are depicted in Table 9, which also shows the ratings for all 4 attributes of all 3 cars based uponglobal scales.
Next, importance weights were elicited from each decision-maker. Decision-makers were first instructed to disregard data for this particular example and just con-sider the 4 attributes: price, mpg, performance, and style. They were then instructed to rank the 4 attributes in order of importance, from most important to least important. Next, they were asked to assign their most important at-tribute a weight of 100. Then, they were asked to assign relative importance weights to the remaining 3 attributes, relative to the 100 of their most important attribute. For example, if they felt that their second most important at-tribute were half as important as their most important attribute, they should assign it a weight of 50. The 3rd
and 4thattributes were assigned weights similarly and the
weights were then normalized to sum to 100. Note that this assignation of importance weights does not take into account the ranges of values of the 3 cars under consid-eration. 100% of the respondents were able to determine importance weights in this manner. For each candidate car, the rating for each attribute was multiplied by the im-portance weight of that attribute, and the results summed over all 4 attributes to yield a net score.
Table 9: Typical experimental results.
Hypothetical Car A Accord Saturn Cavalier Hypothetical Car B
Price ($) 31,000 23,100 23,000 22,900 18,000
Price Global Score 0 6.077 6.154 6.231 10
MPG 18 26 23 22 36
MPG global score 0 4.444 2.778 2.222 10
Performance global score 0 8 5 5 10
Style global score 0 7 5 4 10
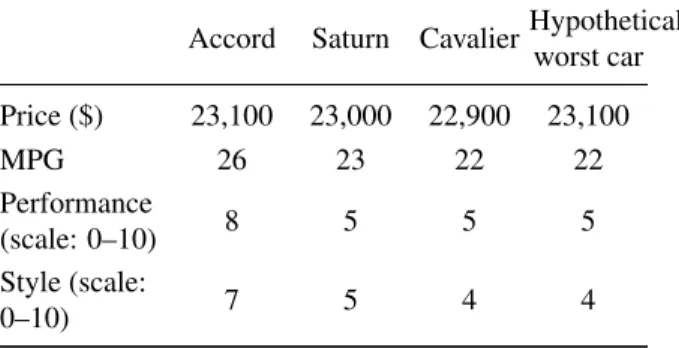
Table 10: Hypothetical worst car for swing weighting ex-periment.
Accord Saturn CavalierHypothetical worst car
Price ($) 23,100 23,000 22,900 23,100
MPG 26 23 22 22
Performance
(scale: 0–10) 8 5 5 5
Style (scale:
0–10) 7 5 4 4
$18,018.90, Hypothetical Worst MPG ranged from 5.0 to 22.0 with a mean of 17.6, and Hypothetical Best MPG ranged from 26.0 to 60.0 with a mean of 35.5.) Global scaling with importance weights provided excellent re-sults in this instance and appears to be a natural, intuitive approach that is readily embraced by decision-makers.
For comparison, swing weights were also elicited, fol-lowing the method of Goodwin and Wright (2004). The decision-makers were asked to imagine a hypothetical car with the worst values for each attribute, as shown in Table 10.
They were then asked if they could choose one of the 4 attributes and change it to itsbestlevel as shown in Table 10, which would they choose? After this, the decision-makers were asked which attribute they would next choose to move to its best level, etc, until all 4 at-tributes had been ranked. The most important attribute was then assigned a weight of 100. Respondents were next asked to compare for the second most important at-tribute a swing from its worst value to its best value with a similar swing for the most important attribute and to weight that relative to the weight of 100 for the most important attribute. For example, if the decision-maker rated style as most important (weight=100) and perfor-mance as second most important, the question would be, “How important is a swing in performance from 5 to 8 relative to a swing in style from 4 to 7?” This was
then repeated for the remaining 2 attributes to determine swing weights, which were then normalized so that they summed to 100.
The swing weighting + local scale results were not as good as the importance weighting + global scale results. For swing weighting, 41 (98%) of the decision-makers chose the Accord (vs 100% for importance weighting). This difference is not statistically significant at α<.10. However 6 (14%) preferred the Cavalier to the Saturn (vs 0% for importance weighting (significant atα<.013 using Fisher’s exact test)) which is inconsistent with our expec-tations and knowledge of the 3 cars. In addition, 67% of the decision makers preferred importance weighting to swing weighting (21% preferred swing weighting and 12% established no preference.) Of those who preferred importance weighting, typical comments mentioned that importance weighting was “more intuitive,” “less confus-ing,” “more straightforward,” and “easier to work with” than swing weighting. Thus, relative to swing weighting + local scaling, importance weighting + global scaling provided results that more closely matched our expecta-tions regarding the “correct” decisions and was rated as easier to work with by the majority of respondents.
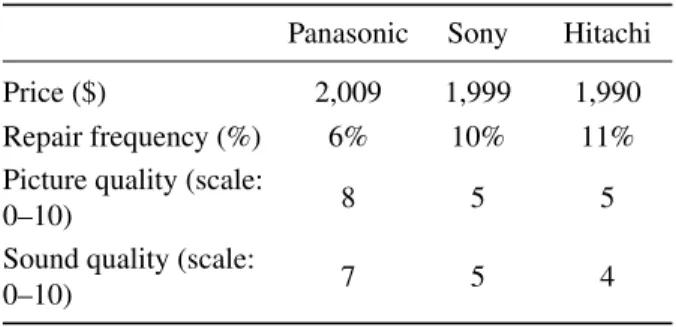
Two more similar experiments were conducted in 2009 using plasma TVs and electric guitars as the items to be considered for purchase (see Tables 11 and 12). These experiments were constructed with the hope that the re-spondents would be more knowledgeable about some items (TVs) than others (electric guitars) and that their approaches to constructing global scales would therefore vary with their comfort level. The mathematical structure of the TV and guitar experiments was identical to that of the car experiment: the first choice dominated the other 2 choices in all areas except the financial parameter (for which all 3 choices agreed within 1%) and the second choice dominated the third choice in all areas except fi-nancial (for which the 2nd and 3rdchoices agreed within
0.5%).
Table 11: Plasma TV experiment.
Panasonic Sony Hitachi
Price ($) 2,009 1,999 1,990
Repair frequency (%) 6% 10% 11%
Picture quality (scale:
0–10) 8 5 5
Sound quality (scale:
0–10) 7 5 4
Table 12: Electric guitar experiment.
Fender Gibson Rickenbacker
Price ($) 505 495 515
Sound quality (1–10
scale) 7 6 9
Construction Quality
(1–10 scale) 7 7 9
Warranty (months) 24 12 36
the elicited swing weights of the other parameters. When this is not so, one would expect local scaling and global scaling to yield similar results.
The results of these experiments are summarized in Ta-ble 13.
The “Ideal” results column represents results that should obtain based upon dominance or near-dominance. The Global Scaling + Importance Weight technique never yielded poorer results than the Local Scaling + Swing Weight technique and yielded significantly better results in 2 out of 3 experiments at α<0.013 while yielding equivalent results in the electric guitar experiment (for that experiment, very few respondents weighted the price high relative to the other swing weights; thus there was little difference between local and global scaling).
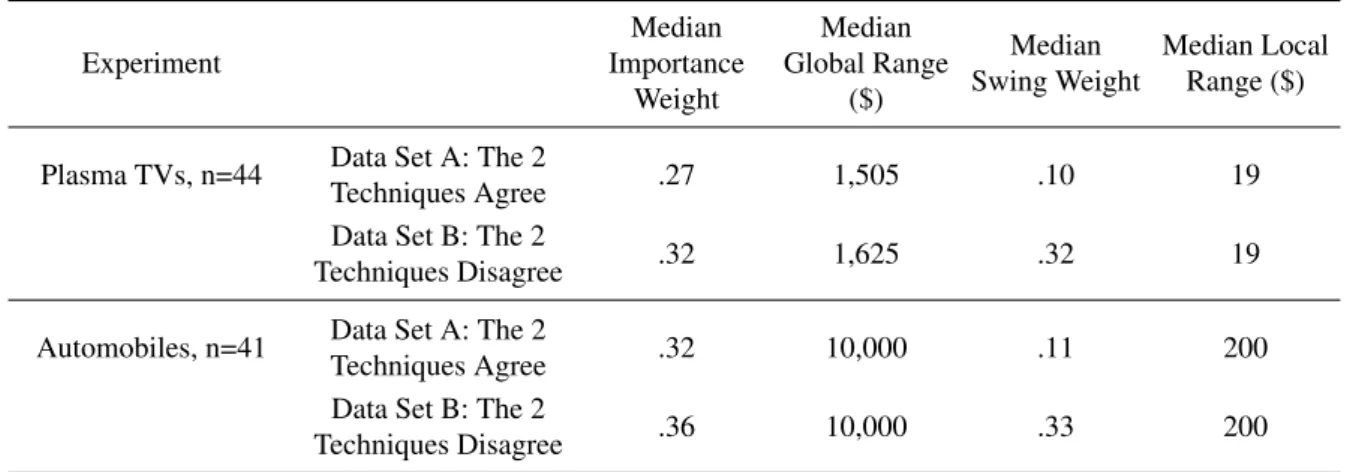
For the automobile and plasma TV experiments, it is helpful to understand the reasons for the poorer results of the swing weighting/local scaling technique. For these experiments, the individual response data were separated into 2 sets: Group A comprised the data for which the 2 techniques (swing weighting + local scales vs impor-tance weighting + global scales) agreed (that is, indicated the same preferences) and Group B comprised the data for which they differed. Table 14 shows the median im-portance weight, global scale range, swing weight, and local scale range for price broken out by data sets A and B:
Recall that the Importance Weight + Global Range technique gave the ideal answer 100% of the time so where the 2 techniques disagree it is the local scale/swing
weighting technique that is suspect. Note that there are no significant differences in global ranges for groups A and B so the benefit does not derive from broader global ranges, nor are the differences in importance weights sig-nificant. However, there is a dramatic difference between the data sets in the elicited swing weights: when local scaling yields the correct preference, the swing weights are low but when local scaling indicates the wrong pref-erence, the swing weights are high. This indicates that the local scaling errors are caused by inadequate reduction of swing weights for the small local scales used.
These experiments support the superiority of Global Scaling + Importance Weights over Local Scaling + Swing Weights when several alternatives are rated closely in one attribute (e.g., price) and that attribute has a rela-tively high weight. Further, for these experiments, >61% of respondents rated the Importance Weighting technique as more straightforward and more intuitive than the swing weighting technique. Although user preference may not be a good indicator of the superiority of any one tech-nique, in this case the lower comfort level with swing weighting suggests that it is harder to use and may ex-plain the poorer results associated with it.
3.1
Global scale construction and
correla-tion with subject matter familiarity
An attempt was made to determine how individuals con-struct global scales. For the last 2 experiments, respon-dents were asked to rate their familiarity with the subject matter on a scale from 1 (I am not familiar at all) to 4 (I am an expert on these items). For the electric guitar experiment, average respondent familiarity was 1.6 and for plasma TVs average familiarity was 2.5. Respondents were also asked what basis they used to determine their global scale extreme values. Choices were:
1. Items you actually owned, used, or experienced
2. Items you read about, heard about, or saw some-where
3. Items you imagine must exist somewhere
4. Items you imagine could be built or developed somewhere
5. Items you think are within your capability to own
6. Other
Table 13: Summary of experiment results.
Experiment Preferences Global
scaling results
Local scaling results
“Ideal” Results
Automobiles % preferring Accord over the others: 100% 97.6% 100%
% preferring Saturn over Cavalier: 100% 85.7% 100%
Plasma TVs % preferring Panasonic over the Others: 100% 100% 100%
% preferring Sony over Hitachi: 100% 76.7% 100%
Electric Guitars % preferring Rickenbacker over the others: 100% 100% 100%
% preferring Fender over Gibson: 97.6% 95.1% 100%
Table 14: Comparison of experimental results for price broken out by data for which the 2 scaling methods (swing weighting + local scales vs importance weighting + global scales) agreed and disagreed.
Experiment
Median Importance
Weight
Median Global Range
($)
Median Swing Weight
Median Local Range ($)
Plasma TVs, n=44 Data Set A: The 2
Techniques Agree .27 1,505 .10 19
Data Set B: The 2
Techniques Disagree .32 1,625 .32 19
Automobiles, n=41 Data Set A: The 2
Techniques Agree .32 10,000 .11 200
Data Set B: The 2
Techniques Disagree .36 10,000 .33 200
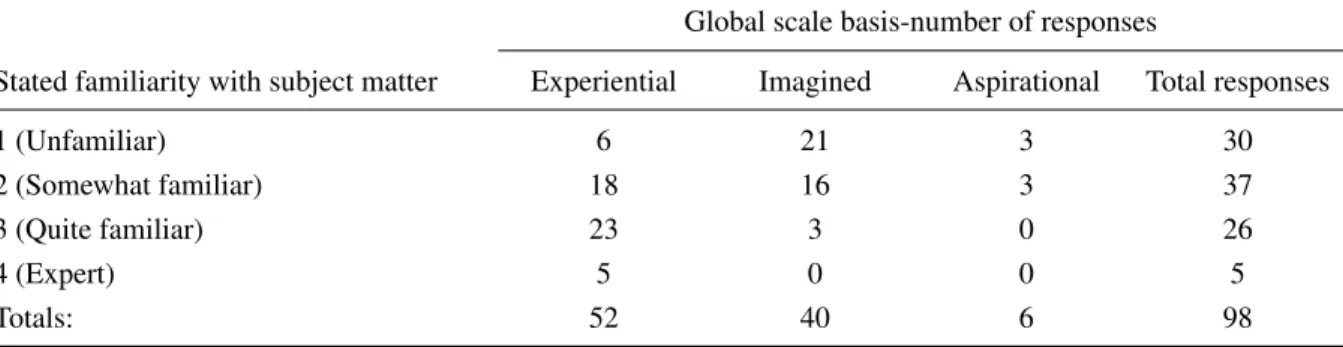
cited “other.” For each level of familiarity (1–4) the num-ber of respondents that based their global scales on expe-rience, imagination, or aspiration was tallied. The results are tabulated in Table 15 and plotted in Figure 2, which shows the number of respondents who used each type of global scale as a function of respondents’ familiarity with the subject matter.
The results indicate that experiential and imagined global scales are much more common than aspirational scales (53% of responses indicated experience as the ba-sis for their global scales; 41% indicated imagination as the basis, and 6% indicated aspiration). Results also show that as familiarity with subject matter increases from 1 (unfamiliar) to 4 (expert), respondents (not surprisingly) tend to favor experiential vs imagined global scales. Thus there is a strong correlation between familiarity with sub-ject matter and the basis used for constructing global scales.
Interestingly, several respondents used acombination of bases to determine their global scale extremes: one basis (e.g., experiential) for their low extreme and another (e.g., aspirational) for their high extreme. The frequency
Less Familiarity More
1 2 3 4
Fraction of
total responses
0.0 0.2 0.4 0.6 0.8 1.0
Experiential
Imagined
Aspirational
Figure 2: Type of global scale vs respondent familiarity with subject matter
Table 15: Basis used for global scales as a function of respondents’ stated familiarity with the subject matter
Global scale basis-number of responses
Stated familiarity with subject matter Experiential Imagined Aspirational Total responses
1 (Unfamiliar) 6 21 3 30
2 (Somewhat familiar) 18 16 3 37
3 (Quite familiar) 23 3 0 26
4 (Expert) 5 0 0 5
Totals: 52 40 6 98
for the TV experiment (2.5 average familiarity). There was no apparent consistency regarding which basis was used for best or worst extreme values. Why and when individuals use a combination of psychological bases to construct global scales are topics of future research.
These experiments demonstrate that people can con-struct explicit global scales when appropriately prompted and that experiential and imagined global scales are the most common. They further suggest that when respon-dents are familiar with the subject matter they tend to use experiential global scales; as familiarity decreases re-spondents rely more upon imagined global scales. Fi-nally, instead of being based on any single factor, global scale construction is sometimes based on a combination of experience, imagination, and aspiration.
4
Discussion
Certainly there must be a mathematical relationship be-tween attribute weight and attribute range for normative decision-making. Logical choices would be either local scales in conjunction with local weights that vary in pro-portion to the scale ranges, or global scales that corre-spond to global or importance weights. In the local model the difficulty is in accurately assessing tradeoffs of weight vs. range among categories, while in the global model the difficulty is in accurately identifying the extreme values of the global scales and meaningful importance weights. The preferred model should be the one that yields better decisions. In the 3 experiments conducted for this article, the global model performed better than the local model in 2 experiments and as well as the local model in 1 experi-ment.
4.1
The psychological cause of errors with
local scaling and swing weighting
Arguably, the better a decision theory reflects human psy-chology, the better will be the results. The remapping of natural scale ratings to local values of 0 (worst) and 10
(best) seems to be inconsistent with the way people think. When asked to rate 2 alternatives on a scale of 0–10, most people provide results that are intermediate to the extremes of 0 and 10 demonstrating that they are thinking globally; that is, they have reference data that are outside the scope of the current choices and they evaluate alter-natives within the larger, global scale of choices. (An-other potential explanation is the psychological tendency to avoid extreme values, as noted in Parducci’s [1965] range-frequency theory). However, the current data do not support that explanation: in independent experiments in which 42 subjects were asked to rate the food quality of 2 restaurants on 0–10 scales (without guidance regarding local or global scales), 88% of respondents explained that they developed their ratings by comparing the 2 restau-rants to other restaurestau-rants with which they were familiar. When this experiment was repeated using cars instead of restaurants, 93% said that they rated the car quality based on either their personal knowledge of the quality of carsnotincluded in the choices or based on what they hadheard or read aboutcarsnotincluded in the current choices. These experiments indicate that, when asked to evaluate alternatives, individuals naturally tend to think globally, not locally, and bring their life experience to bear on the decision.
Swing Weighting (Goodwin & Wright, 2004; Belton & Stewart, 2002; Von Winterfeldt & Edwards, 1986) relies upon the oft-violated Range Sensitivity Principle (RSP) to elicit category weights. Although Gedenk and Sat-tler (2005) found no demographic explanation for the fre-quent violation of the RSP, there could be several reasons.
Second, the literature suggests that decision-makers tend to interpret category weights as intrinsic values that should not vary with the situation. Gabrielli and von Winterfeldt (1978) concluded that “people possess im-plicit notions of attribute importance that are indepen-dent of the specific decision context and that depend in-stead on a globally defined set of plausible alternatives and attribute ranges”. Similarly, Stewart and Ely (1984) concluded, “The failure to meet the range-sensitivity re-quirement suggests that the elicited weights represented general values or attitudes toward the criteria, not spe-cific tradeoffs among them.” If the importance of var-ious criteria changes depending upon the ranges, it im-plies that individuals have situational (vs. fixed) values. This has a negative connotation that most people resist. Therefore changing the weights forces an individual to admit socially unacceptable thinking. This manifests as RSIs<<1.0.
Third, swing weighting creates psychological conflict in decision makers: categories that are thought impor-tant for a decision may be assigned negligible weight. Analysts view criteria weights not as indicators of fun-damental importance, but as decision-making tools that are free to vary if that facilitates decision-making. (Gold-stein, 1990, calls these “paramorphic weights.”) We be-lieve that this distinction creates dissonance and confu-sion in some deciconfu-sion-makers and that this dissonance results in failure of the RSP and concomitant poor de-cisions. For example, Schoner, Wedley, and Choo (1992) argue that safety in bridge design becomesunimportant as different designs exceed a safety standard by greater and greater amounts. This is accurate only from an an-alyst’s perspective. Safety remains vitally important to the decision-maker; it is small differences in safety that become unimportant, especially as all options measure farther and farther from a standard. This important psy-chological (and political/sociological) distinction is not violated so long as global scales (instead of local scales) are used.
These speculative reasons for failure of the Range Sen-sitivity Principle must be validated with further experi-ments. In any case, a decision technique that embraces natural human thought processes (viza tendency to think globally when rating alternatives and a preference to weight criteria using invariant importance weights) will likely yield better results than one that does not, as evi-denced by the above experiments.
4.2
The psychological basis for global
scal-ing
As we go through life, we accumulate knowledge in many areas: price of groceries, price of gas, entertainment
qual-ity of movies, gas mileage of various cars, restaurant food quality, comfort of sofas. We then subconsciously construct and internalize global scales based upon this knowledge such that it is easy for us to render an ab-solute judgment on a new datum by locating it on our internal global scale. Blumenthal (1977) explains that “. . . absolute judgment. . . involves the relation between a single stimulus and some information held in short term memory about some former comparison stimuli or about some previously experienced measurement scale. . . .” In-deed, we make absolute judgments all the time: most people would rate a price of $12 for a box of cereal as very poor and a price of $5,000 for a new car as very good. We are able to do this because we carry with us the former comparison stimuli within which we assess price; we carry with us global price scales for cereal and cars. Those global scales include price endpoints representing extremes that we would value as 0 or 10 on a 10-point scale. The extreme values are often not explicitly stated or even acknowledged; however they exist implicitly. It is the analyst’s job to expose them. The need for contextu-alization is so strong that even when we don’t have direct experience with a subject, we construct global scales via imagination or aspiration. It seems that we humansmust frame our situations to deal with the world.
In a typical decision analysis situation, one may ask the decision-maker to use all her knowledge and history to determine to what natural value (not necessarily among the current option set) she would assign a value of 0 and to what natural value she would assign a value of 10 (see Figure 1.)
People make such subjective assessments frequently; every time they rate something on a scale of 0–10. The principal task of the analyst is to ensure that the ex-treme values selected really do represent what the deci-sion maker views as worth ratings of 0 and 10. The ac-curacy with which this is possible must be confirmed by experiment.
Along with the exposition of the decision-maker’s per-tinent global scales, meaningful importance weights must be elicited. The use of importance weights is often criti-cized because of lack of clarity: when a decision-maker says that saving lives is 10x as important as saving money, the factor of 10 seems arbitrary without an understanding of the ranges of lives and money under consideration. But we speculate (and plan on verifying) that individualsdo consider ranges (albeit subconsciously) when articulating relative importance.
she will then address the question within the context of her own aspirational global scales for saving lives and saving money. For example, she may feel that it might be within her realm of influence to somehow save be-tween 1 life and 1000 lives; and these are the lives of “typical” people like herself. Similarly, she might feel that it is within her power realistically to save between $10,000 and $100,000. This entire contextualization pro-cess may occur within a split second or perhaps only sub-consciously. Within the context of those global scales, she would be entirely justified to then state that saving lives is 10x as important as saving money. The global scales are rarely (if ever) elicited and their existence in our subconscious has not been validated, despite their logic. However, if we challenge a statement like “saving lives is 10x as important as saving money” by using out-landish figures such as trillions of dollars in exchange for the life of a mass murderer, the decision-maker is likely to say, “Well, I didn’t mean for people likethat or dol-lar amounts like that,” which means thatsomeranges of people and moneywerein the decision-maker’s mind, al-beit subconsciously. Thus, everyday statements of rela-tive importance imply the existence of concomitant sub-conscious global scales.
Similarly, when someone says that automobile perfor-mance is twice as important as style, it is not arbitrary; it is with the subconscious awareness of experiential global scales for both style and performance for that class of car. In other words, based on personal experience, that person has subconscious benchmarks in mind for supe-rior (and atrocious) style and performance — and these benchmarks represent the extremes of the global scales. Within the context of those global scales for performance and style, the individual may fairly state that one is twice as important as the other.
Thusthe existence of implicit global scales in every individual’s mind allows us to make valid statements of relative importance such as “Automobile performance is twice as important as style” or “Saving lives is 10x as important as saving money”.Such statements are mean-ingful provided that we can determine the implicit global scales on which they are based.
The hypothesis that most individuals articulate impor-tance weights based on the existence of subconscious per-sonal global scales must be validated by future work. However, this model helps explain the reluctance of decision-makers to vary category weights once articu-lated and the concomitant errors associated with swing weighting. And, although the psychological underpin-nings remain to be validated, in this study we have demonstrated that, in certain situations, global scaling + importance weighting potentially provides better results than local scaling + swing weighting.
5
Conclusion
Multi-attribute choice scoring model techniques are sub-ject to errors from the subsub-jective rating techniques used to construct attribute scales when local scales (instead of global scales) are used. The Range Sensitivity Principle does not adequately address scale ranges in determining appropriate category weights.
The situation may be avoided by using global scales instead of local scales — it appears easier for decision-makers to accurately assess extreme values of global scales in conjunction with fixed (importance) weights than to accurately make tradeoffs among different cate-gories using local scales. Analysts should therefore focus on eliciting importance weights in conjunction with the extreme values of global scales inasmuch as they are con-sistent with psychological perceptions of value and im-portance.
Future work should examine the benefits (or lack thereof) of using global scales in conjunction with swing weights. Additional work should explore the construc-tion of global scales, including a study of the influence of cognitive biases, the correlation of types of global scale with subject matter familiarity, and the reasons that in-dividuals sometimes use combinations of psychological bases to determine global scale extremes.
References
Bana e Costa, C., Lourenço, J., Chagas, M., & Bana e Costa, J. (2008). Development of reusable bid evalu-ation models for the Portuguese electric transmission company,Decision Analysis,5, 22–42
Beattie, J., & Baron, J. (1991). Investigating the effect of stimulus range on attribute weight. Journal of Ex-perimental Psychology: Human Perception and Per-formance, 17, 571–585
Belton, V., & Stewart, T. (2002). Multiple criteria de-cision analysis, an integrated approach. Kluwer Aca-demic Publishers: Boston
Blumenthal, A. (1977). The process of cognition. Prentice-Hall Inc.: Englewood Cliffs, NJ
Botta, R., & Bahill, A. (2007). A prioritization process, Engineering Management Journal, 19, 20–27
Clemen, R., & Reilly, T. (2001). Making hard decisions with decision tools.Duxbury: Pacific Grove, CA, 140– 142 and 606–614
Fischer, G. W. (1990). Range sensitivity of attribute weights in multiattribute value models. Presented at TIMS/ORSA Joint National Meeting, Philadelphia, PA.
Fischer, G. (1995). Range sensitivity of attribute weights in multiattribute value models.Organizational Behav-ior and Human Decision Processes,62, 252–266 Gabrielli, W. F., & von Winterfeldt, D. (1978). Are
at-tribute weights sensitive to the range of atat-tribute values in multiattribute utility measurement? Unpublished manuscript, Social Science Research Institute, Univer-sity of Southern California, Defense Technical Infor-mation Center Accession Number ADA073366, Deci-sions and Designs Inc., McLean, VA
Gedenk, K., & Sattler, H. (2005). Range effects in mea-suring attribute importance, Research Papers on Mar-keting and Retailing. No. 20. University of Hamburg. Goldstein, W. M. (1990). Judgments of relative
impor-tance in decision making: Global vs local interpreta-tions of subjective weight. Organizational Behavior and Human Decision Processes, 59, 1–26
Goodwin, P., & Wright, G. (2001). Enhancing strategy evaluation in scenario planning: a role for decision analysis.Journal of Management Studies, 38,1–16 Goodwin, P., & Wright, G. (2004).Decision analysis for
management judgment. Wiley: Chichester, England, 27–54
Gustaffson, J. (2000). Risk management in Finnish biopharmaceutical companies. Master’s Thesis, De-partment of Enginering Physics and Mathematics. Helsinki University of Technology
Hämäläinen, R. P., project director, “Value tree analy-sis,” www.MCDA.hut.fi/value_tree/theory/theory.pdf, Helsinki University of Technology, Systems Analysis Laboratory, April 30, 2002; accessed 23 December 2008, 35
Highhouse, S., Luong, A., & Sarkar-Barney, S. (1999). Research design, measurement, and effects of attribute range on job choice: More than meets the eye, Organi-zational Research Methods, 2,37–48
Keeny, R., & Raiffa, H. (1976). Decisions with multiple objectives.Wiley: New York
Levin, I. P., Kim, K. J., & Corry, F. A. (1976). Invari-ance of the weight parameters in information integra-tion.Memory & Cognition, 4, 43–47
Mellers, B., & Cooke, A. (1994). Trade-offs depend on attribute range, Journal of Experimental Psychology: Human Perception and Performance,20, 1055–1067 Moshkovich, H. M., Mechitov, A. I., & Olson, D. L.
(2002). Ordinal judgments in multiattribute decision
analysis. European Journal of Operational Research, 137, 625–641.
Noonan, F. (2004). Graduate Course MG541,Operations Risk Management, Module 5: “Multi-attribute choice,” Worcester Polytechnic Institute: Management Depart-ment
Parducci, A. (1965). Category judgment: a range-frequency model.Psychological Review,72, 407–418
Phillips, L. D., & Bana e Costa, C. A. (2007). Trans-parent prioritization, budgeting and resource allocation with multi- criteria decision analysis and decision con-ferencing.Annals of Operations Research, 154, 51–68.
Pöyhönen, M., & Hämäläinen, R. (2001). On the conver-gence of multiattribute weighting methods. European Journal of Operational Research, 129,569–585
Roberts, R., & Goodwin, P. (2002). Weight approxima-tions in multi-attribute decision models. Journal of Multi-Criteria Decision Analysis, 11, 291–303.
Schoner, B., Wedley, W., & Choo, E. (1992). A rejoinder to Forman on AHP, with emphasis on the requirements of composite ratio scales*.Decision Science, 23,509– 517
Stewart, T. R. & Ely, D. W. (1984). Range-sensitivity: A necessary condition and a test for the validity of weights. Unpublished manuscript. National Center for Atmospheric Research, Boulder, CO
Trainor, T., & Parnell, G. S. (2008), Problem defini-tion, in Parnell, G.S., Driscoll, P.J., and Henderson, D. L., Eds.,Decision making in systems engineering and management,Wiley:Hoboken, 295–297
Tversky, A., Sattath, S., & Slovic, P. (1988). Contingent weighting in judgment and choice. Psychological Re-view, 95, 371–384
Von Nitzsch, R., & Weber, M. (1993). The effect of at-tribute ranges on weights in multiatat-tribute utility mea-surements.Management Science, 39,937–943
Von Winterfeldt, D., & Edwards, W. (1986). Decision analysis and behavioral research, Cambridge Univer-sity Press: Cambridge
Weber, M., & Borcherding, K. (1993). Behavioral influ-ences on weight judgments in multiattribute decision making. European Journal of Operational Research, 67,1–12
Appendix: Calculation of range
sen-sitivity index (RSI) and optimal local
weights
Definitions
λi = local (or corrected for range) weight of characteris-tici.
γi = uncorrected importance weight of characteristici.
′ indicates empirical value.
∗ indicates ideal (optimal) value.
ri = local (or new) range of values for characteristic i.
Ri = global (or original) range of values for characteris-tic i.
mi =λ∗i/(1−λ∗i) γi/(1−γi)
mempi = λ′
i/(1−λ′i)
γi/(1−γi)
RSIi = Range Sensitivity Index = m emp
i −1
mi−1
Equations
From Fischer’s (1995) equation (9) it may be shown that for linear value functions,
λ∗
i =
γiri
Ri
Pn
i=1γi
ri
Ri
This equation may be used to calculate ideal local weights as a function of ranges and importance weights.
From Von Nitzsch and Weber’s (1993) definition of RSI one may show that
RSIi =
λ′
i
1−λ′
i −
γi
1−γi
λ∗
i
1−λ∗
i −
γi
1−γi