Combined with IFN-
c
Production Reflect
Mycobacterium
tuberculosis
Infection and Disease
Yang Yu1., Yan Zhang1., Shizong Hu1, Dongdong Jin1, Xinchun Chen2, Qi Jin1*, Haiying Liu1*
1MOH Key Laboratory of Systems Biology of Pathogens, Institute of Pathogen Biology, Chinese Academy of Medical Sciences & Peking Union Medical College, Beijing, China,2Shenzhen-Hong Kong Institute of Infectious Disease, Shenzhen Third People’s Hospital, Guangdong Medical College, Shenzhen, China
Abstract
Background: IFN-c is presently the only soluble immunological marker used to help diagnose latent Mycobacterium tuberculosis (M.tb) infection. However, IFN-c is not available to distinguish latent from active TB infection. Moreover, extrapulmonary tuberculosis, such as tuberculous pleurisy, cannot be properly diagnosed by IFN-crelease assay. As a result, other disease- or infection-related immunological biomarkers that would be more effective need to be screened and identified.
Methodology:A panel of 41 soluble immunological molecules (17 cytokines and 24 chemokines) was tested using Luminex liquid array-based multiplexed immunoassays. Samples, including plasma and pleural effusions, from healthy donors (HD, n = 12) or patients with latent tuberculosis infection (LTBI, n = 20), pulmonary tuberculosis (TB, n = 12), tuberculous pleurisy (TP, n = 15) or lung cancer (LC, n = 15) were collected and screened for soluble markers. Peripheral blood mononuclear cells (PBMCs) and pleural fluid mononuclear cells (PFMCs) were also isolated to investigate antigen-specific immune factors.
Principal Findings: For the 41 examined factors, our results indicated that three patterns were closely associated with infection and disease. (1) Significantly elevated plasma levels of IL-2, IP-10, CXCL11 and CXCL12 were present in both patients with tuberculosis and in a sub-group participant with latent tuberculosis infection who showed a higher level of IFN-c producing cells by ELISPOT assay compared with other latently infected individuals. (2) IL-6 and IL-9 were only significantly increased in plasma from active TB patients, and the two factors were consistently highly secreted afterM.tb
antigen stimulation. (3) When patients developed tuberculous pleurisy, CCL1, CCL21 and IL-6 were specifically increased in the pleural effusions. In particular, these three factors were consistently highly secreted by pleural fluid mononuclear cells following M.tb-specific antigen stimulation. In conclusion, our data imply that the specific secretion of soluble immunological factors, in addition to IFN-c, may be used to evaluateM.tbinfection and tuberculosis disease.
Citation:Yu Y, Zhang Y, Hu S, Jin D, Chen X, et al. (2012) Different Patterns of Cytokines and Chemokines Combined with IFN-cProduction ReflectMycobacterium tuberculosisInfection and Disease. PLoS ONE 7(9): e44944. doi:10.1371/journal.pone.0044944
Editor:Sunil K. Ahuja, South Texas Veterans Health Care System and University Health Science Center San Antonio, United States of America ReceivedNovember 23, 2011;AcceptedAugust 14, 2012;PublishedSeptember 13, 2012
Copyright:ß2012 Yu et al. This is an open-access article distributed under the terms of the Creative Commons Attribution License, which permits unrestricted
use, distribution, and reproduction in any medium, provided the original author and source are credited.
Funding:This work is sponsored by the National Eleven-fifth Mega-Scientific Project on the ‘‘prevention and treatment of AIDS, viral hepatitis and other infectious diseases’’ (2008ZX10003-012, 2012ZX10003-002) and the National Natural Science Foundation of China PR (81000716, 81171533), and Basic R&D expenses were provided by Institute of Pathogen Biology (2010IPB103), Chinese Academy of Medical Sciences. The funders had no role in the study design, data collection and analysis, decision to publish, or preparation of the manuscript.
Competing Interests:The authors have declared that no competing interests exist. * E-mail: [email protected] (HYL); [email protected] (QJ)
.These authors contributed equally to this work.
Introduction
Tuberculosis is a global infectious disease that is mainly caused by Mycobacterium tuberculosis (M.tb). Approximately 30% of the world’s population is affected byM.tbinfection, which causes 1.7 million deaths every year. According to the 2009 WHO report on tuberculosis, there were an estimated 9.4 million incident cases of TB globally, which was equivalent to 137 cases per 100,000 people [1,2]. Although several immunological methods are currently used to diagnose latent tuberculosis infection and support a TB diagnosis, including the tuberculin skin test or interferon-crelease assay, these assays are not conclusive and still require sophisticated technology for appropriate and effective diagnoses [3,4,5]. For example, it is difficult to diagnose tuberculous pleuritis [6].
Microbiological tests are still the current gold standard to diagnose active TB but have the disadvantage of being insensitive or time-consuming. The complicated pathogenesis ofM.tbinfection and limited knowledge on the mechanisms of host defense against this pathogen hinder the development of novel TB diagnostic tools and therapies.
In addition to IFN-c, there may be several cytokines and chemokines that have been investigated as potential biomarkers for M.tbinfection and disease. For example, IL-4, IL-6, IL-10, CXCL10, CXCL8 and CCL8 levels are closely linked to active TB. It has also been suggested that distinct cytokine expression profiles in CD4+
T cells are associated with the bacterial loads characteristic of different infection states [11,12]. Therefore, different multiplex immunological biomarker patterns may exist for either the different stages of latent tuberculosis infection (LTBI) or for different forms of tuberculosis. In this study, we attempted to identify characteristic profiles of cytokines or chemokines during M.tb infection and disease that may be important for new and more precise diagnostic methods.
Multi-cytokine/2chemokine measurements were performed using Luminex liquid array-based multiplexed immunoassays, which have been broadly applied for their sensitivity and ease of use. This technology has also been used in basic research to identify a number of disease biomarkers [13,14,15]. Therefore, we performed a comprehensive screen of 41 soluble immunological biomarkers, including 17 cytokines and 24 chemokines, to evaluate immunological biomarker profiles in the plasma or pleural effusions from patients with pulmonary TB and tuberculous pleurisy, as well as in plasma samples from latent tuberculosis infected persons. Our data demonstrated the presence of diverse biomarker profiles in latently infected individuals and TB patients. We also showed that the local immune environment of pleural effusions includes biomarkers that differ from those found in the peripheral blood. These results could be useful to better un-derstand the immunopathology and immunoprotection of M.tb infection and disease. These data also indicated potential host immune biomarkers for novel diagnostic use.
Materials and Methods
Patients and Samples
All clinical samples were collected from Shenzhen Third People’s Hospital, China and Beijing Chest Hospital-Beijing Tuberculosis and Thoracic Tumor Research Institute, China. The diagnosis of pulmonary tuberculosis and tuberculous pleurisy was based on signs and symptoms, roentgenographic findings (chest X-ray and/or HRCT) consistent with TB and positive sputum bacterial examination ([16]). Clinical samples from untreated or less than one week treated pulmonary tuberculosis and tuberculous pleurisy patients were collected. Tuberculin skin test and a previously established M. tuberculosis–specific IFN-c enzyme-linked immunospot (ELISPOT) [10] were performed on all recruited participants [17,18]. Our study includes five clinical groups: (1) healthy donors (n = 12) without M.tb infection or contact history, (2) untreated pulmonary tuberculosis patients
(n = 12), (3) latent tuberculosis infection individuals (n = 20), (4) tuberculous pleurisy patients (n = 15), and (5) lung adenocarcino-ma patients (n = 15). The latent tuberculosis infection individuals were further separated into two groups based on the ELISPOT spot-forming cell (SFCs) counts ofM.tbantigen stimulated wells: lower spot-forming cells (SFCs) counts (LTB1, n = 10, 30–80 SFCs) or higher SFCs counts (LTB2, n = 10, 110–400 SFCs). All subjects were over 18 years of age, sero-negative for HIV and HBV and did not have any autoimmune diseases (Table 1). HIV-infected individuals were excluded with an HIV antibody de-tection ELISA kit (WANTAI Biological Pharmacy Enterprise, China), and CD4+ T cell counts were analyzed on a flow
cytometer using Expo32 software (Beckman Coulter, CA, USA). This work was approved by and conducted under the guidelines of the Ethical Committee of the Shenzhen–Hong Kong Institute of Infectious Disease, Shenzhen Third People’s Hospital. Written informed consent was obtained from all participants.
For the plasma collection, EDTA was used as an anticoagulant. After collecting blood, the plasma was removed by centrifugation, and PBMCs were isolated by Ficoll density gradient tion. PFMCs were obtained from the pleural fluid by centrifuga-tion at 300 g for 5 min. The viability of both PBMCs and PFMCs was analyzed by Trypan Blue staining as described in publication [19]. The cell viability was greater than 90% in each sample.
Multi-cytokine/Chemokine Measurements
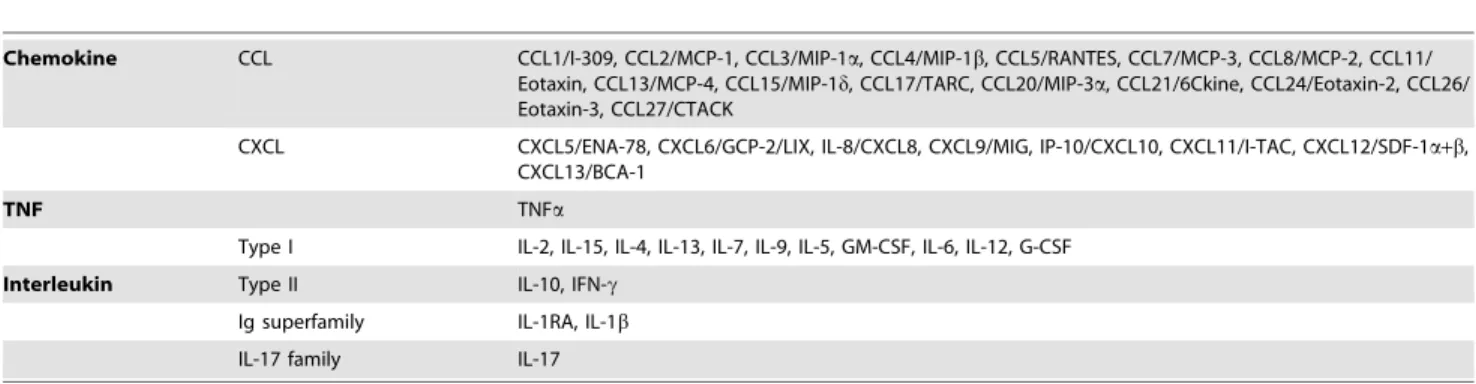
In total, 41 soluble immunological molecules were tested (Table 2). A panel of 17 cytokines was measured using the Bio-Plex Pro Cytokine Assay, 17-Bio-Plex Group I kit (Bio-Rad Laboratories, USA). Chemokine detection was performed using a Human Cytokine/Chemokine Panel (MPXHCYTO-60K, MPXHCYP2-62K and MPXHCYP3-63K, Millipore, USA). Assays were performed according to the manufacturers’ instruc-tions. Data were collected and analyzed using Luminex xPO-NENT software (Luminex Corporation, USA). A five-parameter regression formula was used to calculate the sample concentration from the standard curves. The Human Cytokine Quality Controls 1 and 2 included in the kit were used as low and high concentration quality controls.
PBMCs and PFMCs Stimulation in vitro
Forin vitrocell stimulation, either antigens were extracted from the bacterial strain H37Rv (Prof. Z D Zhang kindly provided) or purified ESAT-6 protein (kindly provided by Professor X CH Chen) was used. The H37Rv bacteria were inactivated by heating to 65uC for 20 minutes, and the bacterial cells were lysed by sonication in an ice-water bath. The total protein concentration of the H37Rv lysate was quantified by a Bradford assay.
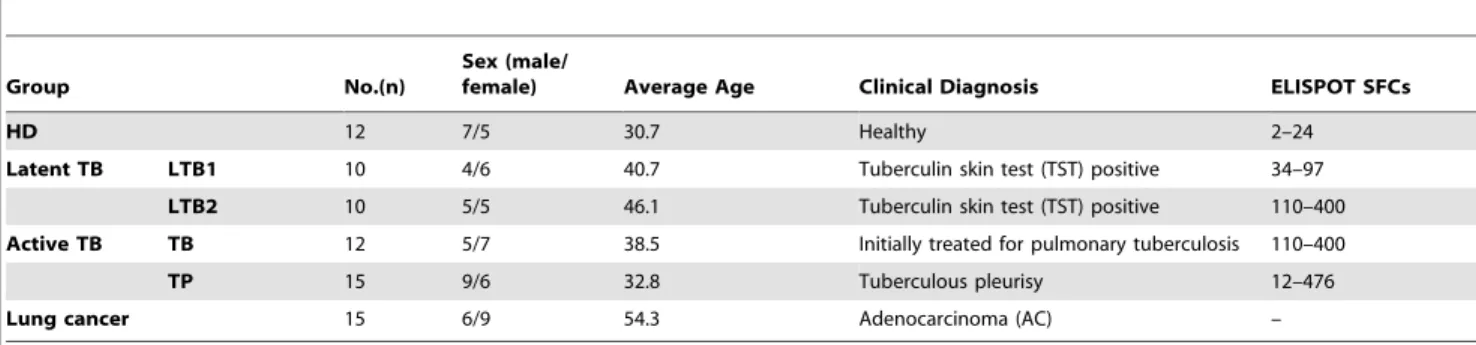
Table 1.Demographic Information.
Group No.(n)
Sex (male/
female) Average Age Clinical Diagnosis ELISPOT SFCs
HD 12 7/5 30.7 Healthy 2–24
Latent TB LTB1 10 4/6 40.7 Tuberculin skin test (TST) positive 34–97
LTB2 10 5/5 46.1 Tuberculin skin test (TST) positive 110–400
Active TB TB 12 5/7 38.5 Initially treated for pulmonary tuberculosis 110–400
TP 15 9/6 32.8 Tuberculous pleurisy 12–476
Lung cancer 15 6/9 54.3 Adenocarcinoma (AC) –
PBMCs from all participates were collected by Ficoll centrifu-gation using a published protocol [20,21]. PFMCs from tubercu-lous pleurisy and cancer patients were collected by centrifugation. The cells were plated at a density of 56105cells/well in 96-well plates with or without H37Rv lysate or ESAT-6 antigen at a final concentration of 10mg/ml. Un-stimulated cells and cells treated with an anti-CD3/CD28 polyclonal cocktail (1mg/ml) were used as negative and positive controls, respectively. After 72 hours incubation in a 37uC, 5% CO2incubator, the culture supernatants
were collected by centrifugation and used for multi-cytokine/ chemokine measurements. [22,23,24,25].
Data Analysis
GraphPad Prism 5 (GraphPad software) was used to generate plots and perform statistical analyses on the data. The statistical analysis was completed using SPSS. First, the data were analyzed by a one-way analysis of variance (ANOVA). When the variance between samples was equal, a Tukey’s HSD or LSD post-hoc test was performed. When the variance was not equal, the Tambane or Dunnett T3 method was used to determine whether there were significant differences between two groups. All the data are presented as the mean6SEM, and a difference with p,0.05 was considered to be significant. The correlation coefficient was assessed using Pearson’s two-tailed correlation test.
Results
1. Individuals with Latent Tuberculosis Infection and a Pattern of Enhanced IFN-cSecretion Showed Significant IL-2, IP-10, CXCL11 and CXCL12 Expression
An M. tuberculosis–specific IFN-c enzyme-linked immunospot (ELISPOT) assay is helpful to differentiate between individuals with LTBI and truly healthy individuals but cannot distinguish between latent infection and active TB [10,17,18]. We found that LTBI individuals had variable ELISPOT SFC values, and some of them even displayed an M.tb antigen-specific ELISPOT SFC counts as high as those observed in TB patients. As a result, a more comprehensive analysis is needed to screen for new biomarkers.
In our study, LTBI donors were separated into two groups as suggested by apparent differences observed using the IFN-c ELISPOT test. One cluster of donors had low-level responses by ELISPOT assay, yielding SFCs counts between 30 and 80 (designated LTB1). In contrast, the other cluster of donors yielded SFCs counts between 110 and 400 (designated LTB2). Not all of the molecules tested were equivalently expressed in these two groups of donors. The cytokine interleukin-2 and the chemokines IP-10, CXCL11 and CXCL12 were significantly higher in the
LTB2 group, as demonstrated by their high ELISPOT results. A Comparison Index was used to demonstrate the significant differences (Figure 1, A and B). The Comparison Index is defined as the ratio of the concentration of a cytokine/chemokine in the LTB2 (or TB) group to that observed in the LTB1 group. As such, a ratio above 1 signifies that the concentration of the cytokine/ chemokine in the LTB2 (or TB) group was higher than the concentration of the cytokine/chemokine in the LTB1 group. The differences between LTB2 and LTB1 were only significant for IL-2, IP-10, CXCL11 and CXCL12. Moreover, the levels of IP-10, CXCL11 and CXCL12 expression in LTB2 plasma were not significantly different from the levels found in pulmonary tuberculosis patients but were much higher than the levels detected in the healthy control group (Figure 1C). These data may suggest that an individual with latent tuberculosis infection who has a high value on the ELISPOT assay may exhibit a similar immune response to an active pulmonary tuberculosis patient, this phenomena is consistent with our previous microarray analysis on CD4+
T cells (data have been published in reference [26]).
2. Overlapping Cytokine/Chemokine Expression Patterns were Observed in Patients with Active Tuberculosis and Tuberculous Pleurisy
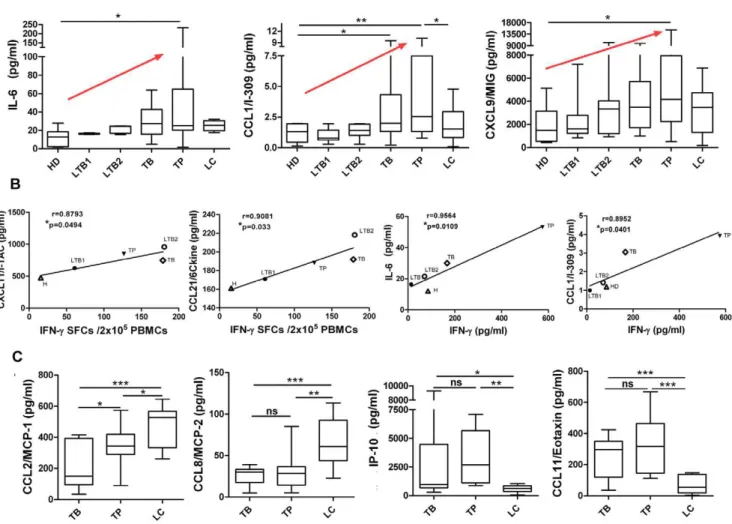
Figure 2A shows that the expression of IL-6, CCL1 and CXCL9 in plasma was increased in active pulmonary tuberculosis and tuberculous pleurisy patients compared with healthy controls. Because elevated IFN-c is considered to be a marker of M.tb infection, we further analyzed the correlation coefficient of different groups with IFN-cSFCs or IFN-cplasma concentration, as shown in Figure 2B. A significant positive linear correlation with IFN-c SFCs was observed for CXCL11 and CCL21, whereas a significant correlation with IFN-c plasma concentration was found for IL-6 and CCL1.
Lung cancer patients were used to model a different type of lung disease as a control. Patients with tuberculous pleurisy were also analyzed separately from the pulmonary tuberculosis patients. We found that CCL8, CCL11 and IP-10 did not significantly differ between pulmonary tuberculosis and tuberculous pleurisy patients. However, these three chemokines were significantly different in these TB groups compared with the lung cancer control group. Specifically, the plasma CCL8 levels in lung cancer patients were much higher than the levels observed in either pulmonary tuberculosis patients or tuberculous pleurisy (TP) patients. In contrast, CCL11 and IP-10 levels in lung cancer patients were much lower than the levels detected in TB and TP groups (Figure 2C). Figure 2C illustrates a similar expression pattern for CCL2 and CCL8, except that a significant difference between TB
Table 2.Classification of examined cytokines and chemokines.
Chemokine CCL CCL1/I-309, CCL2/MCP-1, CCL3/MIP-1a, CCL4/MIP-1b, CCL5/RANTES, CCL7/MCP-3, CCL8/MCP-2, CCL11/ Eotaxin, CCL13/MCP-4, CCL15/MIP-1d, CCL17/TARC, CCL20/MIP-3a, CCL21/6Ckine, CCL24/Eotaxin-2, CCL26/ Eotaxin-3, CCL27/CTACK
CXCL CXCL5/ENA-78, CXCL6/GCP-2/LIX, IL-8/CXCL8, CXCL9/MIG, IP-10/CXCL10, CXCL11/I-TAC, CXCL12/SDF-1a+b, CXCL13/BCA-1
TNF TNFa
Type I IL-2, IL-15, IL-4, IL-13, IL-7, IL-9, IL-5, GM-CSF, IL-6, IL-12, G-CSF
Interleukin Type II IL-10, IFN-c
Ig superfamily IL-1RA, IL-1b
IL-17 family IL-17
and TP patients was also noted. Based on these results, we may surmise that CCL11 and IP-10 are specifically increased in plasma from pulmonary tuberculosis and tuberculous pleurisy patients, while CCL8 and CCL2 are specifically decreased when compared with lung cancer controls. These results strongly indicate a specific chemokine pattern in the plasma of pulmonary tuberculosis patients and tuberculous pleurisy that is distinct from the pattern observed in lung cancer patients.
3. Elevated IL-6 and IL-9 in the Periphery of Active Pulmonary Tuberculosis Patients were Antigen Specific
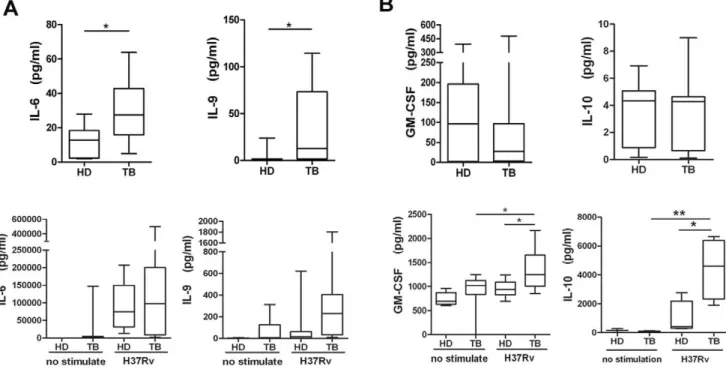
Compared with healthy donors, the peripheral blood plasma of pulmonary tuberculosis patients contained significantly higher levels of IL-6 and IL-9 (Figure 3A). To evaluate the possible causes of increased cytokine levels, peripheral blood mononuclear cells (PBMCs) from either HDs or pulmonary tuberculosis patients were collected and stimulated in vitro with the H37Rv-derived Mycobacterium tuberculosis antigen. Un-stimulated and polyclonal
Figure 1. Characterization of cytokine/chemokine expression in LTBI high IFN-cor low IFN-cgroups. A and B:The Comparison Index was calculated for each cytokine and chemokine by dividing the concentration of the cytokine/chemokine in the LTBI high IFN-c(LTB2) or active pulmonary tuberculosis (TB) group by the concentration of the cytokine/chemokine in the LTBI low IFN-c group (LTB1). LTBI individuals were separated into two groups based onM.tb-specific ELISPOT spot-forming cells counts: lower SFCs counts (LTB1, n = 10, 30–80 SFCs) and higher SFCs counts (LTB2, n = 10, 110–400 SFCs) by M.tbantigen-specific IFN-cELISPOT assay (ESAT-6 protein or ESAT-6/CFP-10-derived peptide pools as stimulants). A value greater than 1 indicates that the concentration of the cytokine/chemokine in the LTB2 or TB group was higher than that of LTB1 group. An asterisk indicates that a significant difference was observed between the two groups. ‘‘.HD’’ means both the LTB1 and TB were higher than healthy donor group (HD).C:Expression levels of 4 molecules (IL-2, IP-10, CXCL11 and CXCL12) that differ significantly between the LTB1 and LTB2 groups are shown. Horizontal bars represent median values, boxes represent the interquartile range (25–75%) and whiskers represent the highest and the lowest values. Horizontal lines indicate a statistically significant difference between groups. *p,0.05.
doi:10.1371/journal.pone.0044944.g001
Figure 2. Differences in cytokine/chemokine expression among distinct clinical groups. A:IL-6, CCL1 and CXCL9 levels in plasma from healthy donors, LTB1 and LTB2 individuals, active TB patients, tuberculous pleurisy patients and lung cancer patients. A red arrow indicates an upward trend.B:Correlation analysis between CXCL11 and CCL21 concentrations in the HD, LTB1, LTB2, TB and TP groups and the IFN-cELISPOT SFC values; and the correlation analysis between IL-6 and CCL1 concentrations and IFN-cplasma concentration. The correlation coefficients were assessed using Pearson’s two-tailed correlation test.C:CCL2, CCL8, IP-10 and CCL11 levels in active pulmonary TB, tuberculous pleurisy and lung cancer patients. Horizontal bars represent median values, boxes represent the interquartile range (25–75%) and whiskers represent the highest and the lowest values. Horizontal lines indicate a statistically significant difference between groups. *p,0.05; **p,0.005.
anti-CD3/CD28-stimulated cells were used as negative and positive controls, respectively. The ability of M.tb antigens to increase the production of these cytokines was assessed. We found that either specific antigen could stimulate PBMCs from pulmo-nary tuberculosis patients to produce higher levels of IL-6 and IL-9 than PBMCs from HDs. These data suggest that high levels of IL-6 and IL-9 may be released following stimulation byM.tb. Finally, we determined that GM-CSF and IL-10 levels increased markedly after antigen stimulation in vitro although no differences were detected in plasma samples (Figure 3B). Higher expression levels of several chemokines, including CCL-8, CXCL13, CXCL12, CCL1 and CCL21, were only induced in PBMCs after stimulation with anM.tb-specific antigen (either H37Rv lysate or purified ESAT-6 protein) (Figure S3). Our data also showed a consistent antigen-related secretion pattern following either H37Rv lysate or purified ESAT-6 protein stimulation.
4. Pleural Effusions from Patients with Tuberculous Pleurisy Exhibited a Different Antigen-specific Cytokine/ Chemokine Secretion Pattern Compared with those from Lung Cancer Patients
Tuberculous pleurisy usually develops soon after an initial infection. In tuberculous pleurisy, the amount of fluid in the pleural space increases dramatically following the bacterial invasion of the space. The pleural effusions contain cells, primarily lymphocytes, and extracellular proteins, including cytokines and chemokines, which may reflect a local immune response. Our data shown that G-CSF, IL-6 and IL-13 levels were significantly higher in tuberculous pleurisy pleural effusions (TPF) compared with plasma from TB or TP patients. Furthermore, the expression of these cytokines was distinctly increased compared with the pleural
effusions from lung cancer patients (CPF) (Figure 4A), suggesting that enhanced expression of these three cytokines could be tuberculosis specific. UsingM.tbantigen to stimulate PFMCs from TP patientsin vitro resulted in increased expression of cytokines, particularly IL-6, which showed a significant change after stimulation (Figure 4A). These data may suggest that infiltrating lymphocytes were the source of increased cytokine production in the pleural effusions.
IL-4 and IL-15 expression levels were increasedin vitroby the antigenic stimulation of PFMCs; they also exhibited a unique expression pattern in the pleural effusions of TP patients, as shown in Figure 4B. Therefore, the PFMCs from tuberculous pleurisy patients have the ability to produce IL-4 and IL-15 when stimulated withM.tb.
To further understand the local inflammatory situation, expression of chemokines was detected. CCL1, CCL21, IP-10, CCL8 and CXCL9 levels were much higher in pleural effusions from patients with TP compared with lung cancer patients. Similarly, stimulation of PFMCs with antigen increased their expression of chemokinesin vitro(Figure 4C). CXCL12 was highly expressed in the TP pleural effusions but not after stimulation, which may result from the kinetics of cytokine production or from a separate production pathway. (Figure 4C).
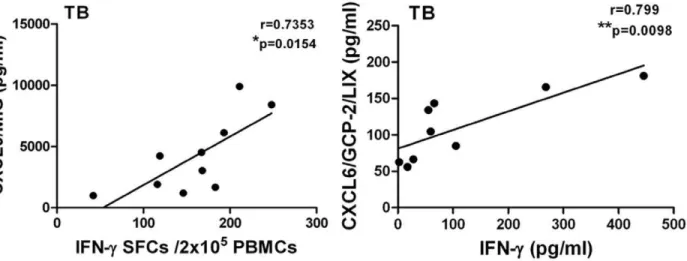
5. The TB Disease-related Cytokine/Chemokine Secretion Pattern was Correlated with Antigen-specific IFN-c Secretion
IFN-cis the only soluble immunological marker currently used for helping identifyM.tbinfection. However, IFN-cis not useful to distinguish latent from active disease. Other cytokines and chemokines whose expressions are correlated with IFN-cmay be
Figure 3. Comparison of cytokine expression in plasma orin vitroafterM.tbantigen-specific stimulation of PBMCs. A:Data for IL-6 and IL-9 levels in pulmonary tuberculosis patients (TB) and HDs are shown. PBMCs from healthy donors and TB patients were collected forM.tb
antigen-specific stimulationin vitro. The IL-6 and IL-9 expression levels in stimulated cell cultures are shown in the panels below.B:GM-CSF and IL-10 levels in plasma from TB patients and healthy donors or in PBMCs following antigen-specific stimulated cell culture. Horizontal bars represent median values, boxes represent the interquartile range (25–75%) and whiskers represent the highest and the lowest values. Horizontal lines indicate a statistically significant difference between groups. *p,0.05; **p,0.005.
useful to characterize M.tb infection and disease. Therefore, we further analyzed the correlation between the concentrations of cytokines and chemokines in plasma from active pulmonary tuberculosis or tuberculous pleurisy patients and the number of IFN-c spot-forming cells in an ELISPOT assay or the IFN-c concentration in plasma. These results showed that the expression of IL-1RA, IL-5, IL-7 and IL-13 in plasma from both pulmonary tuberculosis and tuberculous pleurisy patients significantly corre-lated with their IFN-cexpression (Table 3, 4). Figure 5 shows that significant correlations were found only in the TB group, for whom CXCL9 was correlated with IFN-cSFCs and CXCL6 was correlated with IFN-cplasma concentration.
Discussion
Few reports have been published that examine the detection of a large number of immune biomarkers and compare them across TB-related diseases and latency. We performed a comprehensive screen of 41 soluble immunological biomarkers, including 17 cytokines and 24 chemokines in samples from different groups. The demographic data for the patients included in this study are shown in a supporting table (Table S1). Our results showed that potentially informative immune markers have different expression in patients with latent tuberculosis infection, active pulmonary TB and tuberculous pleurisy. Although T-cell based IFN-c release assays (IGRAs) were developed to assess IFN-cproduction and to demonstrate sensitization toM.tbantigens afterin vitrostimulation with M.tb-specific immunodominant antigens, IGRAs cannot distinguish active TB from latency [9]. A majority of patients with a positive IGRA will not progress to active TB, and these individuals may not need preventive therapy [27]. According to published reports [28,29,30], Pai et al believed that IGRA testing results exhibit dynamic variability [27], revealing underlying
phenotypic differences that may predict different disease out-comes. Therefore, a single IGRA test may never predict the infection progression; rather, it is possible for the IGRA test, in combination with other complementary markers, to provide a more accurate diagnosis or prediction of disease. We analyzed the correlation of multiple soluble immune molecules with M.tb antigen specific IFN-cSFCs by ELISPOT or IFN-c concentra-tions in plasma. Cytokine/chemokine assays showing significant correlation with IFN-cmay identify a potential biomarker for use in combination with IFN-c to distinguish latency and active disease clinically (shown in Figure 5; LTBI-related data not shown).
In our study, an analysis of two groups of latent TB-infected subjects (identified based onM.tbantigen specific IGRA result) was performed to determine whether they also differed in their plasma cytokine expression levels. For example, this analysis showed that individuals with a high frequency of IFN-c-producing cells had significantly higher expression levels of IL-2, IP-10, CXCL11 and
Figure 4. Comparison of cytokine/chemokine expression in plasma or pleural effusions or in vitro after M.tbantigen-specific stimulation of PFMCs. A.Levels of IL-6, IL-13 and G-CSF in plasma from active pulmonary tuberculosis (TB) and tuberculous pleurisy (TP) patients or the pleural effusions from tuberculous pleurisy (TPF) and lung cancer (CFP) patients. PFMCs from tuberculous pleurisy patients were collected for
M.tbantigen-specific stimulationin vitro. The levels of IL-6, IL-13 and G-CSF in stimulated cell cultures are shown in the panels below.B:IL-4 and IL-15 levels in plasma or pleural effusions (above) and in PFMCs antigen-specific stimulated cell cultures (below).C:Chemokine levels in the plasma or pleural effusions (lines 1 and 3) and in antigen-specific stimulated PFMCs cultures (lines 2 and 4). Horizontal bars represent median values, boxes represent the interquartile range (25–75%) and whiskers represent the highest and the lowest values. Horizontal lines indicate a statistically significant difference between groups. *p,0.05; **p,0.005; *** p,0.0005.
doi:10.1371/journal.pone.0044944.g004
Figure 5. Correlation analysis between CXCL9 and CXCL6 concentrations and IFN-c ELISPOT SFC values or IFN-c plasma concentration.The correlation coefficient was assessed using Pearson’s two-tailed correlation test.
doi:10.1371/journal.pone.0044944.g005
Table 3.Cytokines showing significant correlations with IFN-cin TB plasma.
TB IL-1RA IL-5 IL-13 IL-7 IL-12
(P70) IL-9 IL-2
Pearson r 0.9004 0.7560 0.7915 0.7550 0.6918 0.7625 0.8254 P value
(2-tailed)
0.0002 0.0071 0.0037 0.0072 0.0183 0.0064 0.0018
sig. ** ** ** ** * ** **
CXCL12 in their plasma compared with healthy controls. The latent group with a lower frequency of IFN-c producing cells displayed a pattern similar to that of the active TB patient group. Approximately one-third of the world’s population is infected with M.tb, although only approximately 10% ever develop active tuberculosis. In contrast, the remaining 90% of infected individ-uals maintain a latent state [1,2]. This large group of people is at an increased risk of developing active tuberculosis and becoming infectious. As a result, it is important to identify and monitor this group of individuals and perform intervention therapy promptly. Some researchers have focused on identifying biomarkers for distinguishing LTBI from active TB, generally using gene expression profiles [31,32]. However, other studies distinguish latency based on other immune criteria. For example, it is estimated that 15% of the Chinese population is latently infected, as identified by T-cell-based gamma interferon release assays (IGRAs) [33]. However, clinical diagnosis that relies on IFN-c ELISPOT test may be limited. Our results indicated that LTBI patients had different plasma cytokine and chemokine levels based on a correlation analysis with their M.tb antigen-specific IFN-c producing ability by ELISPOT assay. Therefore, these distinct soluble immunological factors correlate withM.tbantigen-specific IFN-c release assay might be useful to help distinguish latent tuberculosis infection and tuberculosis disease.
Although host immune factors play a pivotal role in the control of M.tb infection, many immunological signatures of disease progress are still unknown [34,35,36,37]. Johannes Nemeth et al. have reported the specific cytokine patterns of pulmonary tuberculosis in central Africa. They detected a pronounced pro-inflammatory cytokine response in patients, with highly signifi-cantly increased levels of IL-6 and TNF-a accompanied by increased TGF-b[38]. Similarly, we found a significant increase in the plasma levels of IL-6 and IL-9 in patients with active pulmonary tuberculosis and tuberculous pleurisy. In addition, IL-6 was specifically increased in pleural effusions from patients with tuberculous pleurisy compared with the pleural effusions of lung cancer patients. IL-6 has been reported to participate in the immunopathogenesis of tuberculosis. IL-6 is required for an initial protective IFN-c response during early M.tb infection. This proinflammatory cytokine is mainly produced by monocytes after various bacterial infections [39]. T. C. Y. Tsao et al. found significantly higher levels of IL-6 in the bronchoalveolar lavage fluid (BALF) from patients with active pulmonary tuberculosis and IL-6 release by alveolar macrophages from TB lesions [40]. Our results also provide evidence for the relationship between IL-6 and untreated active TB, where IL-6 may be produced by monocytes in the peripheral blood or at the local site. It has also been reported that this early response occurs in the lungs and is important for the initial restriction of mycobacterial growth [39]. However, the precise mechanism by which IL-6 mediates protection needs to be further clarified. Increased expression of
IL-9 may contribute to the development of TB, as it is associated with an impaired Th1 immune response in patients with tuberculosis [41,42].
In addition, our results suggested a new tool that could be used in a tuberculous pleurisy diagnostic test. There are several diagnostic methods used in clinics, such as the acid-fast bacilli test of pleural fluid or histological analysis and mycobacterial culture of closed pleural biopsied tissue [43,44]. In addition to these standard methods, other pleural fluid biomarkers have been investigated for their diagnostic potential, including adenosine deaminase (ADA), IFN-cand soluble Fas ligand (sFasL) [45,46]. Herein, we found several unreported cytokines and chemokines were expressed at significantly high levels in tuberculous pleurisy patients. The most noteworthy are a group of soluble molecules that are highly expressed specifically in pleural effusions from tuberculous pleurisy patients but not lung cancer patients. Additionally, expression of these soluble molecules is antigen specific. Our data show that CCL1, CXCL9 and IP-10 were highly expressed in both the periphery and the pleural effusions from tuberculous pleurisy patients. Moreover, among the exam-ined factors, CCL1, CCL21 and IL-6 were markedly increased in pleural effusions from tuberculous pleurisy patients and the supernatants of cultured PFMCs after M.tb-specific antigen stimulation. These findings suggest that these soluble molecules may be useful as a panel of immune biomarkers for the diagnosis of tuberculous pleurisy and helping proper treatment. An intensive study on mechanism underlying antigen-specific immunological factors secretion and immune pathogenesis and protection still needs further understanding, which will undoubtedly improve clinical management.
Chemokines belong to a large family of proteins called chemotactic cytokines and have an average molecular mass of 8–14 kDa. They can mediate the constitutive recruitment of leukocytes from the blood into tissues [47]. Chemokines are generally separated into two families: the CC family functions to attract and activate monocytes/macrophages, lymphocytes, baso-phils, eosinobaso-phils, NK cells and dendritic cells, whereas CXC chemokines mainly attract and activate neutrophils and some activated T cells or NK cells [48]. In this study, we assayed a broad range of CC and CXC chemokines and found that some of them were significantly expressed duringM.tbinfection, including CCL1 and CXCL9, which have not been previously studied. Zahra Hasan et al. showed that the relationship between mycobacterial antigen-induced IFN-c and CXCL9 may play a role in de-termining disease severity in tuberculosis [49]. However, the effects of increased CCL1 production duringM.tbinfection are not yet reported.
Some chemokines have been investigated in the context ofM.tb infection and have been shown to participate in protective and immunopathologic host responses during human tuberculosis [50]. In general, the production of chemokines is essential for the
Table 4.Cytokines showing significant correlations with IFN-cin tuberculous pleurisy plasma.
TP IL-1RA IL-5 IL-13 IL-7 IL-4 IL-10 IL-15 TNF-a IL-1b
Pearson r 0.6188 0.9470 0.9446 0.9465 0.9303 0.7636 0.5995 0.9531 0.9334
P value (2-tailed) 0.0241 ,0.0001 ,0.0001 ,0.0001 ,0.0001 0.0024 0.0303 ,0.0001 ,0.0001
sig. * *** *** *** *** ** * *** ***
recruitment of inflammatory cells at the site of infection and the formation and maintenance of a granuloma. It has been reported that RANTES and MCP-1 are elevated in the bronchoalveolar lavage fluid of tuberculosis patients [51]. MCP-1 is considered to be a potent immunoprophylactic tool for controlling the myco-bacterial colonization of the host [52]. Our data also show that MCP-1 was highly expressed in pleural effusions from patients with tuberculous pleurisy, although its expression level did not differ from a carcinomatous pleural effusions control (Figure S1), suggesting that this maybe not be a unique response to TB. In addition, the level of RANTES in tuberculous pleurisy pleural effusions in our research was decreased significantly compared with that in control plasma (Figure S2). These differences may reflect the unique characteristics of samples from different sources, i.e., pleural effusions rather than bronchoalveolar lavage fluid with no healthy donor comparisons. Furthermore, the CC chemokines IP-10 and MCP-2 are potentially ideal candidate biomarkers because of their induciblein vitroantigen-specific expression, and IP-10 is a potential diagnostic marker for evaluating tuberculous pleurisy [53,54]. CCL21 was reportedly induced in the lungs and secreted within granulomatous lesions after infection with M. tuberculosis [55], and our finding that CCL21 expression was enhanced in tuberculous pleurisy pleural effusions is consistent with this conclusion. For CXCL8, another important CXC chemokine in TB, we also found that it was expressed at high levels in both tuberculous pleurisy pleural effusions and carcino-matous pleural effusions (Figure S1). It has been reported that CXCL8 might be involved in eliciting the initial immune response to mycobacterial antigens by homing and infiltrating Th1 cells and that pleural macrophages might be the major source of this chemokine [56]. CXCL12 levels are also increased specifically in tuberculous pleurisy pleural effusions, although the mechanism and function of this increase have not been demonstrated.
In summary, we characterized varied and antigen-specific cytokine and chemokine patterns in latent tuberculosis infection, active pulmonary tuberculosis and tuberculous pleurisy patients. These results strongly implicate the potential for a combination of different immunological factors with IFN-cto distinguish between latent TB, active pulmonary tuberculosis and tuberculous pleurisy, which may lead to a more accurate diagnosis. Furthermore, panel of immunological factor candidates need to be selected and further evaluated in a larger number of patients in the following study. Those researches will be useful for a better clinical practice and a better understanding of their expression and regulation during M.tbinfection and disease.
Supporting Information
Figure S1 Elevated cytokines/chemokines in pleural effusions from both tuberculous pleurisy and lung cancer patients. Comparison of IL-10, CXCL13, CCL2 and
CXCL8 expression in plasma from active pulmonary tuberculosis and tuberculous pleurisy patients and pleural effusions from tuberculous pleurisy and lung cancer patients. Expression levels were increased in both tuberculous pleurisy pleural effusions and pleural effusions from lung cancer patients. Horizontal bars represent median values, boxes represent the interquartile range (25–75%) and whiskers represent the highest and the lowest values. Horizontal lines indicate a statistically significant difference between groups. *p,0.05; **p,0.005; *** p,0.0005.
(TIF)
Figure S2 Decreased cytokines/chemokines in pleural effusions. IL-2, CXCL5, CCL5 and CCL27 expression in plasma from active pulmonary tuberculosis and tuberculous pleurisy patients or pleural effusions from tuberculous pleurisy and lung cancer patients. These data revealed decreased expression levels in tuberculous pleurisy pleural effusions com-pared with plasma. Horizontal bars represent median values, boxes represent the interquartile range (25–75%) and whiskers represent the highest and the lowest values. Horizontal lines indicate a statistically significant difference between groups. *p,0.05; **p,0.005; *** p,0.0005.
(TIF)
Figure S3 Antigen-specific responses in PBMCs.IL-10, CCL-8, CXCL13, CXCL12, CCL1 and CCL21 were highly expressed by PBMCs from active pulmonary tuberculosis patients after stimulation with either H37Rv lysate or ESAT-6 protein. The data show that both H37Rv lysate and ESAT-6 protein stimulated PBMCs to release antigen-specific cytokines/chemo-kines. Horizontal bars represent median values, boxes represent the interquartile range (25–75%) and whiskers represent the highest and the lowest values. Horizontal lines indicate a statisti-cally significant difference between groups. *p,0.05; **p,0.005; *** p,0.0005.
(TIF)
Table S1 Cytokine/chemokine concentrations in differ-ent groups.
(DOC)
Acknowledgments
We thank Dr. Xinchun Chen, Dr. Mingxia Zhang, Mingfeng Liao (Shenzhen Third People’s Hospital, China) and Dr. Zongde Zhang, Xiaojing Zheng, Shuxiang Gu (Beijing Chest Hospital-Beijing Tuberculosis and Thoracic Tumor Research Institute, China) for their assistance in recruiting patients for this study.
Author Contributions
Conceived and designed the experiments: HYL QJ YY. Performed the experiments: YY YZ SZH. Analyzed the data: YY YZ DDJ. Contributed reagents/materials/analysis tools: XCC. Wrote the paper: YY HYL.
References
1. WHO (2010) Report: Global tuberculosis control. 2. WHO (2008) Report : Stop TB Partnership.
3. Pathan AA, Wilkinson KA, Klenerman P, McShane H, Davidson RN, et al. (2001) Direct ex vivo analysis of antigen-specific IFN-gamma-secreting CD4 T cells in Mycobacterium tuberculosis-infected individuals: associations with clinical disease state and effect of treatment. J Immunol 167: 5217–5225. 4. Sia IG, Wieland ML (2011) Current concepts in the management of
tuberculosis. Mayo Clin Proc 86: 348–361.
5. Warier A, Gunawathi S, Venkatesh, John KR, Bose A (2010) T-cell assay as a diagnostic tool for tuberculosis. Indian Pediatr 47: 90–92.
6. Khatami K (2002) Pleural Tuberculosis. Shiraz E Medical Journal 3: 78–86. 7. Kaufmann SH (2001) How can immunology contribute to the control of
tuberculosis? Nat Rev Immunol 1: 20–30.
8. Maglione PJ, Chan J (2009) How B cells shape the immune response against Mycobacterium tuberculosis. Eur J Immunol 39: 676–686.
9. Ferrara G, Losi M, Fabbri LM, Migliori GB, Richeldi L, et al. (2009) Exploring the immune response against Mycobacterium tuberculosis for a better diagnosis of the infection. Arch Immunol Ther Exp (Warsz) 57: 425–433.
10. Chen X, Yang Q, Zhang M, Graner M, Zhu X, et al. (2009) Diagnosis of active tuberculosis in China using an in-house gamma interferon enzyme-linked immunospot assay. Clin Vaccine Immunol 16: 879–884.
11. Walzl G, Ronacher K, Hanekom W, Scriba TJ, Zumla A (2011) Immunological biomarkers of tuberculosis. Nat Rev Immunol 11: 343–354.
13. Djoba Siawaya JF, Chegou NN, van den Heuvel MM, Diacon AH, Beyers N, et al. (2009) Differential cytokine/chemokines and KL-6 profiles in patients with different forms of tuberculosis. Cytokine 47: 132–136.
14. Nolen BM, Marks JR, Ta’san S, Rand A, Luong TM, et al. (2008) Serum biomarker profiles and response to neoadjuvant chemotherapy for locally advanced breast cancer. Breast Cancer Res 10: R45.
15. Shi M, Bradner J, Hancock AM, Chung KA, Quinn JF, et al. (2011) Cerebrospinal fluid biomarkers for Parkinson disease diagnosis and progression. Ann Neurol 69: 570–580.
16. Chen X, Zhang M, Zhu X, Deng Q, Liu H, et al. (2009) Engagement of Toll-like receptor 2 on CD4(+) T cells facilitates local immune responses in patients with tuberculous pleurisy. J Infect Dis 200: 399–408.
17. Qiu Z, Zhang M, Zhu Y, Zheng F, Lu P, et al. (2012) Multifunctional CD4 T cell responses in patients with active tuberculosis. Sci Rep 2: 216.
18. Chen X, Zhang M, Liao M, Graner MW, Wu C, et al. (2010) Reduced Th17 response in patients with tuberculosis correlates with IL-6R expression on CD4+ T Cells. Am J Respir Crit Care Med 181: 734–742.
19. Louis KS, Siegel AC (2011) Cell viability analysis using trypan blue: manual and automated methods. Methods Mol Biol 740: 7–12.
20. Fuss IJ, Kanof ME, Smith PD, Zola H (2009) Isolation of whole mononuclear cells from peripheral blood and cord blood. Curr Protoc Immunol Chapter 7: Unit7 1.
21. Kanof ME, Smith PD, Zola H (2001) Isolation of whole mononuclear cells from peripheral blood and cord blood. Curr Protoc Immunol Chapter 7: Unit 7 1. 22. Sargentini V, Mariotti S, Carrara S, Gagliardi MC, Teloni R, et al. (2009)
Cytometric detection of antigen-specific IFN-gamma/IL-2 secreting cells in the diagnosis of tuberculosis. BMC Infect Dis 9: 99.
23. Eyerich K, Foerster S, Rombold S, Seidl HP, Behrendt H, et al. (2008) Patients with chronic mucocutaneous candidiasis exhibit reduced production of Th17-associated cytokines IL-17 and IL-22. J Invest Dermatol 128: 2640–2645. 24. Guimar,aes T (2012) Evaluation of the Immune Response of Individuals
Infected with Mycobacterium tuberculosis and Patients with Active Tubercu-losis. ISRN Immunology 2012.
25. Chen X, Zhang M, Liao M, Graner MW, Wu C, et al. (2010) Reduced Th17 response in patients with tuberculosis correlates with IL-6R expression on CD4+ T Cells. Am J Respir Crit Care Med 181: 734–742.
26. Liu K, Zhang Y, Hu S, Yu Y, Yang Q, et al. (2012) Increased Levels of BAFF and APRIL Related to Human Active Pulmonary Tuberculosis. PLoS ONE 7. 27. Pai M (2010) Spectrum of latent tuberculosis - existing tests cannot resolve the
underlying phenotypes. Nat Rev Microbiol 8: 242; author reply 242. 28. Pai M, Joshi R, Dogra S, Mendiratta DK, Narang P, et al. (2006) Serial testing
of health care workers for tuberculosis using interferon-gamma assay. Am J Respir Crit Care Med 174: 349–355.
29. Hill PC, Brookes RH, Fox A, Jackson-Sillah D, Jeffries DJ, et al. (2007) Longitudinal assessment of an ELISPOT test for Mycobacterium tuberculosis infection. PLoS Med 4: e192.
30. Ewer K, Millington KA, Deeks JJ, Alvarez L, Bryant G, et al. (2006) Dynamic antigen-specific T-cell responses after point-source exposure to Mycobacterium tuberculosis. Am J Respir Crit Care Med 174: 831–839.
31. Lu C, Wu J, Wang H, Wang S, Diao N, et al. (2011) Novel biomarkers distinguishing active tuberculosis from latent infection identified by gene expression profile of peripheral blood mononuclear cells. PLoS One 6: e24290. 32. Wu B, Huang C, Kato-Maeda M, Hopewell PC, Daley CL, et al. (2007) Messenger RNA expression of IL-8, FOXP3, and IL-12beta differentiates latent tuberculosis infection from disease. J Immunol 178: 3688–3694.
33. Zhang S, Shao L, Mo L, Chen J, Wang F, et al. (2010) Evaluation of gamma interferon release assays using Mycobacterium tuberculosis antigens for diagnosis of latent and active tuberculosis in Mycobacterium bovis BCG-vaccinated populations. Clin Vaccine Immunol 17: 1985–1990.
34. Cooper AM (2009) Cell-mediated immune responses in tuberculosis. Annu Rev Immunol 27: 393–422.
35. Dheda K, Schwander SK, Zhu B, van Zyl-Smit RN, Zhang Y (2010) The immunology of tuberculosis: from bench to bedside. Respirology 15: 433–450. 36. Wilkinson KA, Wilkinson RJ (2010) Polyfunctional T cells in human
tuberculosis. Eur J Immunol 40: 2139–2142.
37. Marais BJ, Raviglione MC, Donald PR, Harries AD, Kritski AL, et al. (2010) Scale-up of services and research priorities for diagnosis, management, and control of tuberculosis: a call to action. Lancet 375: 2179–2191.
38. Nemeth J, Winkler HM, Boeck L, Adegnika AA, Clement E, et al. (2011) Specific cytokine patterns of pulmonary tuberculosis in Central Africa. Clin Immunol 138: 50–59.
39. Saunders BM, Frank AA, Orme IM, Cooper AM (2000) Interleukin-6 induces early gamma interferon production in the infected lung but is not required for generation of specific immunity to Mycobacterium tuberculosis infection. Infect Immun 68: 3322–3326.
40. Tsao TC, Hong J, Huang C, Yang P, Liao SK, et al. (1999) Increased TNF-alpha, IL-1 beta and IL-6 levels in the bronchoalveolar lavage fluid with the upregulation of their mRNA in macrophages lavaged from patients with active pulmonary tuberculosis. Tuber Lung Dis 79: 279–285.
41. Wu B, Huang C, Kato-Maeda M, Hopewell PC, Daley CL, et al. (2008) IL-9 is associated with an impaired Th1 immune response in patients with tuberculosis. Clin Immunol 126: 202–210.
42. Herrera MT, Torres M, Nevels D, Perez-Redondo CN, Ellner JJ, et al. (2009) Compartmentalized bronchoalveolar IFN-gamma and IL-12 response in human pulmonary tuberculosis. Tuberculosis (Edinb) 89: 38–47.
43. Seibert AF, Haynes J Jr, Middleton R, Bass JB Jr (1991) Tuberculous pleural effusion. Twenty-year experience. Chest 99: 883–886.
44. Villegas MV, Labrada LA, Saravia NG (2000) Evaluation of polymerase chain reaction, adenosine deaminase, and interferon-gamma in pleural fluid for the differential diagnosis of pleural tuberculosis. Chest 118: 1355–1364. 45. McGrath EE, Anderson PB (2010) Diagnostic tests for tuberculous pleural
effusion. Eur J Clin Microbiol Infect Dis 29: 1187–1193.
46. Wu SH, Li CT, Lin CH, Chu JJ, Cheng ML, et al. (2010) Soluble Fas ligand is another good diagnostic marker for tuberculous pleurisy. Diagn Microbiol Infect Dis 68: 395–400.
47. Yoshie O, Imai T, Nomiyama H (2001) Chemokines in immunity. Adv Immunol 78: 57–110.
48. Zlotnik A, Yoshie O (2000) Chemokines: a new classification system and their role in immunity. Immunity 12: 121–127.
49. Hasan Z, Jamil B, Ashraf M, Islam M, Yusuf MS, et al. (2009) ESAT6-induced IFNgamma and CXCL9 can differentiate severity of tuberculosis. PLoS One 4: e5158.
50. Jo EK, Park JK, Dockrell HM (2003) Dynamics of cytokine generation in patients with active pulmonary tuberculosis. Curr Opin Infect Dis 16: 205–210. 51. Kurashima K, Mukaida N, Fujimura M, Yasui M, Nakazumi Y, et al. (1997) Elevated chemokine levels in bronchoalveolar lavage fluid of tuberculosis patients. Am J Respir Crit Care Med 155: 1474–1477.
52. Mohammed KA, Nasreen N, Ward MJ, Mubarak KK, Rodriguez-Panadero F, et al. (1998) Mycobacterium-mediated chemokine expression in pleural mesothelial cells: role of C-C chemokines in tuberculous pleurisy. J Infect Dis 178: 1450–1456.
53. Ruhwald M, Bodmer T, Maier C, Jepsen M, Haaland MB, et al. (2008) Evaluating the potential of IP-10 and MCP-2 as biomarkers for the diagnosis of tuberculosis. Eur Respir J 32: 1607–1615.
54. Supriya P, Chandrasekaran P, Das SD (2008) Diagnostic utility of interferon-gamma-induced protein of 10 kDa (IP-10) in tuberculous pleurisy. Diagn Microbiol Infect Dis 62: 186–192.
55. Schreiber T, Ehlers S, Aly S, Holscher A, Hartmann S, et al. (2006) Selectin ligand-independent priming and maintenance of T cell immunity during airborne tuberculosis. J Immunol 176: 1131–1140.