Meta-analysis
Peripheral cytokine and chemokine
alterations in depression: a meta-analysis of
82 studies
K€ohler CA, Freitas TH, Maes M, de Andrade NQ, Liu CS, Fernandes
BS, Stubbs B, Solmi M, Veronese N, Herrmann N, Raison CL, Miller
BJ, Lanctot KL, Carvalho AF. Peripheral cytokine and chemokine^
alterations in depression: a meta-analysis of 82 studies.
Objective: To conduct a systematic review and meta-analysis of studies that measured cytokine and chemokine levels in individuals with major depressive disorder (MDD) compared to healthy controls (HCs).
Method: The PubMed/MEDLINE, EMBASE, and PsycINFO databases were searched up until May 30, 2016. Effect sizes were estimated with random-effects models.
Result: Eighty-two studies comprising 3212 participants with MDD and 2798 HCs met inclusion criteria. Peripheral levels of interleukin-6 (IL-6), tumor necrosis factor (TNF)-alpha, IL-10, the soluble IL-2 receptor, C-C chemokine ligand 2, IL-13, IL-18, IL-12, the IL-1 receptor antagonist, and the soluble TNF receptor 2 were elevated in patients with MDD compared to HCs, whereas interferon-gamma
levels were lower in MDD (Hedge’sg = 0.477,P = 0.043). Levels of
IL-1b, IL-2, IL-4, IL-8, the soluble IL-6 receptor (sIL-6R), IL-5, CCL-3, IL-17, and transforming growth factor-beta 1 were not significantly altered in individuals with MDD compared to HCs. Heterogeneity was large (I2: 51.6–97.7%), and sources of heterogeneity were explored (e.g., age, smoking status, and body mass index).
Conclusion: Our results further characterize a cytokine/chemokine profile associated with MDD. Future studies are warranted to further elucidate sources of heterogeneity, as well as biosignature cytokines secreted by other immune cells.
C. A. K
€
ohler
1,*, T. H. Freitas
1,*,
M. Maes
2,3,4,5,6,
N. Q. de Andrade
1, C. S. Liu
7,8,
B. S. Fernandes
2,9,
B. Stubbs
10,11, M. Solmi
12,13,
N. Veronese
12,14,
N. Herrmann
8,15,
C. L. Raison
16,17, B. J. Miller
18,
K. L. Lanct
^
ot
7,8,15,
A. F. Carvalho
11Translational Psychiatry Research Group and
Department of Clinical Medicine, Faculty of Medicine, Federal University of Ceara, Fortaleza, CE, Brazil,2Deakin
University, IMPACT Strategic Research Centre, School of Medicine, Geelong, Australia,3Department of
Psychiatry, Faculty of Medicine, Chulalongkorn University, Bangkok, Thailand,4Department of
Psychiatry, Faculty of Medicine, State University of Londrina, Londrina, PR, Brazil,5Department of Psychiatry,
Medical University Plovdiv, Plovdiv, Bulgaria,6Revitalis,
Waalre, The Netherlands,7Department of Pharmacology
and Toxicology, University of Toronto, Toronto, ON, Canada,8Neuropsychopharmacology Research Group,
Hurvitz Brain Sciences Program Sunnybrook Research Institute, Toronto, ON, Canada,9Laboratory of Calcium
Binding Proteins in the Central Nervous System, Department of Biochemistry, Federal University of Rio Grande do Sul, Porto Alegre, RS, Brazil,10Physiotherapy Department, South London and Maudsley NHS Foundation Trust, Denmark Hill, London, UK,11Health
Service and Population Research Department, Institute of Psychiatry, Psychology and Neuroscience (IoPPN), King’s College London, London, UK,12Department of
Neurosciences, University of Padova, Padova, Italy,
13Institute of Clinical Research and Education in
Medicine (IREM), Padova, Italy,14Department of
Medicine, DIMED, Geriatrics Section, University of Padova, Padova, Italy,15Department of Psychiatry,
University of Toronto, Toronto, ON, Canada,
16Department of Human Development and Family
Studies, School of Human Ecology, University of Wisconsin-Madison, Madison, WI, USA,17Department
of Psychiatry, School of Medicine and Public Health, University of Wisconsin-Madison, Madison, WI, USA and18Department of Psychiatry & Health Behavior, Augusta University, Augusta, GA, USA
Key words: cytokines; chemokines; inflammation meta-analysis; depression
Andre F. Carvalho, Department of Clinical Medicine, Faculty of Medicine, Federal University of Ceara, Rua Prof. Costa Mendes, 1608, 4°andar, 60430-040, Fortaleza, CE, Brazil.
E-mail: [email protected] or [email protected]
*Contributed equally as first authors.
Accepted for publication December 29, 2016
Summations
•
Evidence indicates that peripheral immune activation may be involved in the pathophysiology of major depressive disorder.•
Herein, we conducted an updated meta-analytic review of 82 studies that measured cytokines and/or chemokines in individuals with major depressive disorder and healthy controls.•
Levels of IL-6, TNF-a, 10, the soluble IL-2 receptor, C-C chemokine ligand 2, IL-13, IL-18, IL-12, the IL-1 receptor antagonist, and the soluble TNF receptor 2 were elevated, whereas interferon-clevels were reduced in individuals with major depressive disorder compared to controls. These results add in the characterization of a putative cytokine/chemokine profile for major depressive disorder.
Considerations
•
A large degree of heterogeneity was evident in this literature. Potential sources of heterogeneity were not consistently reported across included studies.•
Methodological quality has varied across included studies.Introduction
In the past two decades, an increasing body of evi-dence indicates that aberrations in immune-inflam-matory pathways and activation of cell-mediated immunity represent important pathophysiological pathways for the development of major depressive disorder (MDD) (1, 2). In addition, converging experimental and clinical research points that reciprocal neuroimmune interactions may con-tribute to the neurobiology of MDD (3, 4). A low-grade inflammatory response characterized by increased numbers of granulocytes and monocytes (1), as well as the elevated levels of acute phase reactants (e.g., C-reactive protein and hap-toglobin) (5, 6), inflammatory cytokines (7), and possibly chemokines (8), has been demonstrated in groups of individuals with MDD compared to healthy controls (HCs). These peripheral immune abnormalities may influence brain function through several mechanisms. For example, evidence indicates that cytokines may cross the blood-brain barrier, while certain cytokines (e.g., IL-1b) may convey sig-nals to the brain via afferent nerves like the vagus (2, 4). The pathophysiological role of proinflammatory
cytokines in MDD is further supported by preclini-cal research indicating that proinflammatory cytoki-nes may promote depressive-like behaviours, whereas TNF-a and IL-6 receptor knockout mice exhibit resilience to stress-induced depressive-like behaviours (9–11). In addition, a recent meta-analy-sis estimates that~25% of patients with chronic hep-atitis C develop depression after treatment with the proinflammatory cytokine interferon-a (IFN-a) (12). The common denominator among these find-ings is that peripheral immune dysregulation may represent an important pathway for inducing func-tional and structural brain changes that underpin the pathophysiology of MDD. Perhaps as a conse-quence of this, peripheral inflammatory mediators have emerged as promising candidate biomarkers for MDD (13), although evidence of bias may limit inferences derived from the literature on peripheral biomarkers for MDD (14).
A meta-analysis that included 24 studies provided evidence that peripheral levels of tumor necrosis fac-tor-alpha (TNF-a) and interleukin-6 (IL-6) are
sig-nificantly elevated in individuals with MDD
between-study heterogeneity for these estimates was high (7). A more recent cumulative meta-analysis confirmed that peripheral levels of IL-6 are elevated in individuals with MDD and HCs, whereas no con-sistent evidence of changes in TNF-aand IL-1bin patients with MDD compared to controls was found (5). This significant degree of heterogeneity could be explained by a number of factors including but not limited to the following: differences in assay methods across laboratories, medication status, and potential confounders (e.g., body mass index and smoking). Furthermore, it has been increasingly recognized that the phenotypic heterogeneity of MDD may contribute to discrepant findings. For example, melancholic depression is associated with elevated HPA axis activ-ity (15, 16), whereas individuals with atypical depres-sion appear to have higher levels of proinflammatory markers (16). In addition, each individual cytokine/ chemokine may have different functions relevant to the pathophysiology of MDD. For example, some cytokines/chemokines are predominantly proinflam-matory, whereas others are mainly anti-inflamproinflam-matory, and some of these immune mediators have been increasingly implicated in neuroplasticity mechanisms (17, 18). Therefore, the characterization of peripheral levels of a wider array of cytokines and chemokines may be of particular relevance to this field.
Aims of the study
Since the publication of these previous meta-ana-lyses (5, 7, 19, 20), additional studies have been con-ducted examining a wider range of immune biomarkers. Therefore, the aims of this large, collab-orative meta-analysis were to investigate differences in peripheral levels of a wider range of cytokines and chemokines among individuals with major depres-sive disorder compared to healthy controls and to explore potential sources of heterogeneity across studies. We anticipated that the large number of new studies would allow for a more precise charac-terization of the role of cytokines and chemokines as peripheral biomarkers for major depressive disorder.
Methods
This study comprised a between-group meta-analy-sis of studies that compared cytokine or chemokine levels between adults with MDD and healthy con-trols. We complied with the Preferred Reported Items for Systematic Reviews and Meta-analysis (PRISMA) statement (21). The literature search, title/abstract screening, final decision on eligibility after full-text review, and data extraction were inde-pendently performed by two investigators. Ana pri-oridefined yet unpublished protocol was followed.
Search strategy
A systematic search was conducted in the PubMed/ MEDLINE, EMBASE, and PsycINFO databases from inception up until May 30, 2016. The detailed search strings used in this review are presented in the supporting information that accompanies the online version of this article. This search strategy was augmented through tracking the citation of included articles in Google Scholar (22).
Study selection
We included original references published in any language. Eligible studies had to measure periph-eral cytokine or chemokine levels in adult subjects (age ≥ 18 years old) that met either DSM (23) or
ICD (24) criteria for MDD, and a comparison group of healthy controls (HCs). The following exclusion criteria were adopted: (i) studies that reported that participants had medical and/or psy-chiatric comorbidities were excluded (except cur-rent smoking); (ii) studies that included pregnant women or women in the postpartum period; (iii) case reports or case series (N< 10); (iv) studies that assayed the mediators in specimens/tissues other than blood; and (v) studies in animals. The authors of meeting abstracts that met inclusion cri-teria were contacted by e-mail to provide data for analysis (no additional data were provided).
Data extraction
For each cytokine/chemokine, we extracted the means, variance estimates [standard deviation (SD), standard error of the mean (SEM), or 95% confidence interval (CI)], and sample sizes for both MDD and HC groups. From studies that pre-sented only results of the comparison of the MDD and HC groups, we extracted the appropriate mea-sure (z-score or t-score). In studies that provided
median IQR or median range, we estimated
the mean SD following a standard method (25). We also extracted the following data whenever available: (i) first author, (ii) publication year, (iii) gender distribution of study sample (% females), (iv) mean age and BMI, (v) mean illness duration (years), (vi) treatment status (drug-free during assessment and/or treatment-na€ıve), (vii) percent-age of the sample with atypical and/or melancholic depression, (viii) measurement of depressive symp-toms, and (ix) % of current smokers.
Methodological quality of included studies
parameters: (i) study sample≥ 50 participants
(1= Yes; 0=No); (ii) Did the study control results for potential confounders (e.g., age, BMI, gender, race)? (1= Y; 0= No); (iii) Were participants with MDD and HCs age- and gender-matched? (1= Y; 0=No); (iv) Was the time of sample collection specified? (e.g., morning vs. evening) (1= Y; 0=No); (v) Were participants with MDD free of antidepressant drugs during sample collection? (1= Y; 0=No); and (vi) Reporting of either the manufacturer of the test or its parameters (detection limit and coefficient of variation) (1= Y; 0=No). Thus, the score may vary from 0 to 6, with higher scores indicating better methodological quality.
Statistical analysis
Because studies used different measurement meth-ods, we estimated a standardized mean difference and 95% CI (Hedges’sg) for each immune media-tor, which provides an unbiased effect size (ES) adjusted for small sample sizes (26). We assessed the heterogeneity across studies using the Cochran Q test, which provides a weighted sum of the squares of the deviations of individual study ES estimates from the overall estimate. In addition, heterogeneity across studies was quantified with the I2 statistic, which indicates the percentage of total variation across several studies due to heterogeneity and which is considered high when≥50% (27). We
antic-ipated a high degree of heterogeneity. Therefore, we pooled ES using a random-effects model according to the DerSimonian and Laird method (28). Meta-analyses were conducted only for immune mediators with at least three individual datasets.
Studies with statistically non-significant (i.e., negative) results are less likely to be published than studies with significant results (14, 29). To assess publication bias, we inspected a funnel plot graph for asymmetry and calculated the Egger’s regres-sion test for funnel plot asymmetry (30). Evidence of small-study effects (indicative of publication bias) was considered when the P-value of the Egger’s test was <0.1, and the ES of the largest study was more conservative or changed direction when compared with the overall ES estimate (fun-nel plots of ES estimates in which evidence of pub-lication bias was observed are illustrated in Figs S10–S14) (14). The trim-and-fill procedure was used to estimate the ES adjusting for publication bias (31), while the fail-safe N (i.e., the file drawer statistic) was used to determine how many addi-tional studies would be necessary to turn a signifi-cant ES non-signifisignifi-cant (32).
We explored potential sources of heterogeneity across studies for each ES estimate, using either
subgroup (if there were at least three studies in each subgroup) or random-effects meta-regression analy-ses. Meta-regression analyses were conducted only when at least 10 studies provided moderator; this decision was madea prioribecause with fewer data-sets, this analytic tool may provide spurious results (33). The following variables were considered in meta-regression analyses: sample size, mean age of MDD group, mean age of the HC group, differences in mean age (MDD groupminusHC group), mean body mass index (BMI) of MDD group, mean BMI of the HC group, differences in mean BMI (MDD groupminusHC group), % of females in the MDD group, % of females in the HC group, difference in % of females (MDD groupminusHC group), % of current smokers, latitude of the country where the study was executed, depression severity (expressed as a percentage of the cutoff for severe depression in the rating scale), methodological quality of each included study, and mean illness duration in years. Studies were weighted in such a way that investiga-tions with more precise parameters (indicated by sample size and 95% CI) had more influence in meta-regression analyses (34). For statistically sig-nificant ES estimates, we performed sensitivity anal-yses in which we excluded each study from analanal-yses to verify whether a single study turned results non-significant or otherwise changed the direction of the ES. In addition, cumulative meta-analysis was per-formed for significant ES with at least 10 datasets.
All analyses were conducted in Stata MP soft-ware version 14.0 (Stata Corp, College Station, TX, USA) using the metan package. Statistical sig-nificance was considered at an alpha level of 0.05.
Results
Study selection
Following removal of duplicates, the title/abstracts of 4911 unique references were screened for eligibil-ity. A total of 4432 references were excluded, while 479 full texts were retrieved and screened for eligi-bility. Of those articles, 397 were excluded (see Table S1 for reasons for exclusion). Finally, 82 orig-inal studies met inclusion criteria, which provided data from 6010 participants (3212 participants with MDD and 2798 HCs). Figure 1 provides the PRISMA flowchart for study selection.
Characteristics and methodological quality of included studies
studies (42.7%) adjusted results for potential con-founders (e.g., age, gender distribution, depressive symptom scores, or BMI). In addition, most stud-ies (k = 81; 98.8%) either reported the manufac-turer of the assay or provided values of the coefficient of variation (CV) of the test. In addi-tion, most studies (k = 65; 79.3%) provided data regarding medication status, whereas three (3.7%) included only treatment-na€ıve (i.e., never treated with antidepressants) participants with MDD. Finally, most studies did not provide information on illness duration (k =56; 68.3%); the remaining studies included MDD participants with illness duration of 2.97 6.15 (mean SD) years. The methodological quality scores of each study varied from 1 to 6 (median: 4) (Table S2).
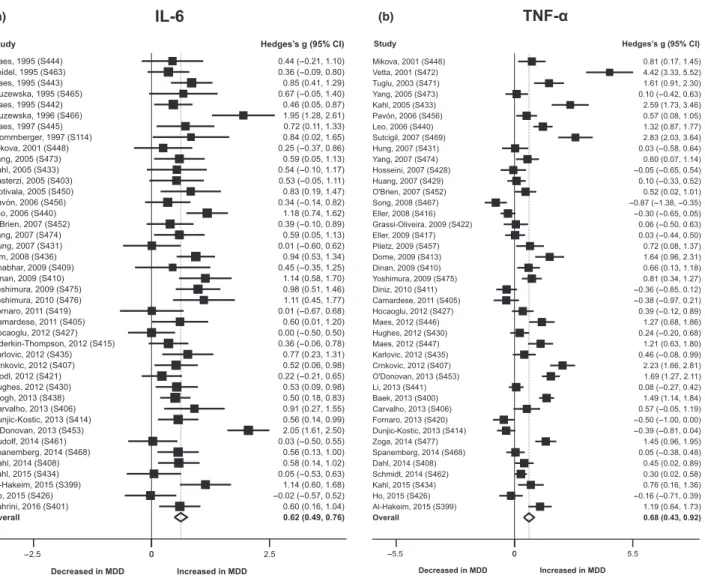
Studies of IL-6
Il-6 measurements were extracted from 42 studies (1587 cases and 1183 controls). Participants with MDD had higher concentrations compared to HCs (g= 0.621; P < 0.001; Table 1 and Fig. 2a). No evidence of small-study effects (which provides an indication of publication bias) was observed. Possible sources for the large heterogeneity (I2 =64.9%) were explored using meta-regression and subgroup analyses (Tables S3 and S4). In meta-regression analyses, differences in gender
distribution (% females) in the MDD and HC
groups emerged as a significant moderator
(P =0.046). Subgroup analyses showed that heterogeneity was smaller in studies that measured IL-6 in serum and whole blood samples compared to plasma, while results suggest that the measure-ment of IL-6 with ELISA is associated with higher heterogeneity compared to other types of assay.
Of 42 studies that measured IL-6, 10 provided adjusted differences in peripheral levels of this cytokine to confounders (e.g., age, gender, BMI, smoking, among other variables specific to the study) (35–44). We re-calculated this ES consider-ing those adjusted values. Then, the overall ES of IL-6 was 0.543 (95% CI= 0.435‒0.651;P <0.001). The I2 value was 49.8% (P <0.001). In addition, we performed a subgroup analysis considering studies which did vs. did not adjust comparisons to confounders. The overall ES for the unadjusted
studies was 0.574 (95% CI = 0.437–0.711;
P < 0.001; k =32), with an I2 of 52.3% (P <0.001). The overall ES for the adjusted stud-ies was 0.467 (95% CI = 0.303–0.631; P <0.001; k = 10), with aI2of 38.6% (P =0.101). Therefore, studies that adjusted to potential confounders had a lower degree of heterogeneity.
In sensitivity analysis, the exclusion of any indi-vidual study from the analysis did not alter the direction or statistical significance of the ES
g
ni
n
e
er
c
S
Included
Eligibi
lit
y
n
oi
t
ac
ifi
t
n
e
dI
Studies included in qualitative synthesis
(N = 82)
Records identified through database searching
(N = 6104)
Additional records identified through other sources
(N = 2)
Records after duplicates removed
(N = 4911)
Records screened
(N= 4911)
Records excluded
(N = 4432)
Full-text articles assessed for eligibility
(N = 479)
Full-text articles excluded, with reasons
(N = 397)
Studies included in meta-analysis
(N = 82)
estimate (Fig. S15). Cumulative meta-analysis indi-cated that ES estimates are consistent across stud-ies since 1996 (Fig. S26).
Studies of TNF-a
TNF-a was investigated across 42 studies, and levels were significantly higher in the MDD group compared to HCs, while there was evidence of small-study effects (g =0.638; P < 0.001; Table 1 and Fig. 2b); the ES was unaltered after adjust-ment for publication bias (Table 1). Heterogeneity was large (I2 = 90.0%). The percentage of current smokers in both the MDD and HC groups moder-ated the ES; in both groups, a higher prevalence of smokers was associated with a higher ES estimate (Table S3). The methodological quality of included studies also emerged as a significant moderator (Table S3). The ES estimate was smaller in studies with better methodological quality. In addition, levels of TNF-a were not significantly altered in individuals with melancholic depression compared to controls (g =0.141;k = 4;P = 0.418). Sensitiv-ity analysis indicated that the exclusion of any sin-gle study (one at a time) did not alter the direction or statistical significance of the ES estimate (Fig. S16). In the cumulative meta-analysis, this ES estimate remained consistent (moderate) after
the addition of the most recent eight studies, which had similar ES estimates (Fig. S27).
Studies of IL-1b
Levels of IL-1bdid not significantly differ between MDD and HC groups across 22 included studies (Hedge’s g = 0.032, P = 0.847; Table 1; Fig. S1). No evidence of small-study effects was observed
(Table 1). The heterogeneity was large
(I2 =89.3%). The mean BMI of participants with MDD emerged as a potential source of heterogene-ity in meta-regression analysis; a larger BMI was associated with a higher ES estimate (Table S3). In addition, subgroup analyses suggest that hetero-geneity is lower in studies that measured this immune mediator in whole blood (compared to studies that assayed IL-1bin serum or plasma) and
in studies that used stimulated leukocytes
(Table S4).
Studies of IFN-c
Data for IFN-c were extracted from 17 studies, and levels were reduced in subjects with MDD compared to the HCs (Table 1; Fig. 3a). There was evidence of small-study effects, but adjustment for publication bias did not change the ES
Table 1. Primary meta-analyses of studies measuring peripheral cytokines and chemokines in individuals with MDD vs. healthy controls Mediator
N
Studies
N
MDD
N
Controls ES (95% CI)
P-value
(overall)* I2 P
-value (Egger)†
Small-study
effects‡ Fail-safe N
Adjusted ES (95% CI)§
IL-6 42 1587 1183 0.621 (0.486–0.755) <0.001 64.9 0.950 N 2497 0.621 (0.486–0.755) TNF-a 42 1620 1457 0.675 (0.431–0.919) <0.001 90.0 0.009 Y 2431 0.675 (0.431–0.919) IL-1b 22 779 727 0.032 ( 0.291–0.354) 0.847 89.3 0.180 N 0 0.152 ( 0.477–0.173) IFN-c 17 700 770 0.477 ( 0.939 to 0.015) 0.043 94.0 <0.001 Y 95 0.477 ( 0.939 to 0.015)
IL-10 17 608 675 0.375 (0.008–0.742) 0.045 89.2 0.277 N 107 0.375 (0.008–0.742)
IL-2 10 357 476 0.108 ( 0.900–0.683) 0.789 95.8 0.918 N 1 0.108 ( 0.900–0.683) IL-4 10 350 450 0.533 ( 1.073–0.007) 0.053 91.0 0.085 Y 41 0.533 ( 1.073–0.007) sIL-2
receptor
10 489 391 0.735 (0.418–1.052) <0.001 77.5 0.741 N 224 0.735 (0.418–1.052) CCL-2 8 285 287 1.718 (0.641–2.794) 0.002 96.3 0.044 Y 144 1.718 (0.641–2.794)
IL-8 7 306 217 0.032 ( 0.346–0.410) 0.869 76.9 0.229 N 0 0.032 ( 0.346–0.410) sIL-6
receptor
7 344 256 0.330 ( 0.008–0.667) 0.055 71.3 0.115 N 12 0.330 ( 0.008–0.667) IL-13 6 243 373 1.836 (0.812–2.861) <0.001 96.0 0.009 Y 255 1.432 (0.445–2.418) IL-18 5 135 143 1.720 (0.379–3.062) 0.012 95.3 0.105 N 114 1.720 (0.379–3.062)
IL-12 4 135 301 1.229 (0.275–2.182) 0.012 92.9 0.609 N 71 1.229 (0.275–2.182) IL-1Ra 4 148 110 0.449 (0.082–0.815) 0.016 51.6 0.986 N 9 0.449 (0.082–0.815) IL-5 4 198 322 0.396 ( 0.072–0.865) 0.097 82.1 0.105 N 18 0.396 ( 0.072–0.865) CCL-3 3 110 98 1.974 ( 0.231–4.179) 0.079 97.5 0.180 N 52 1.974 ( 0.231–4.179) IL-17 3 85 106 0.121 ( 0.537–0.295) 0.569 51.6 0.212 N 0 0.121 ( 0.537–0.295) TGF-b1 3 110 68 1.480 ( 4.756–1.797) 0.376 97.7 0.367 N 5 1.480 ( 4.756–1.797) sTNFR2 3 94 101 1.173 (0.409–1.938) 0.003 83.2 0.368 N 36 1.173 (0.409–1.938) CI, confidence interval; ES, effect size; MDD, major depressive disorder; Y, Yes; N, No; NA, Not applicable; statistically significant results are in bold.
*InZ-test of overall effect.
†In Egger’s test of publication bias.
‡P<0.1 in Egger’s test of publication bias and effect size of the largest study more conservative than the overall effect size or in the opposite direction.
(g = 0.452; Table 1 and Fig. 3a). Heterogeneity was large (I2 =94.0%). Mean BMI of the HC group, publication year, sample size, and mean age of the MDD and HC groups emerged as potential sources of heterogeneity in meta-regression analy-ses (Table S3). Sensitivity analysis revealed that the exclusion of 10 studies from analysis one by one rendered the ES estimate non-significant (Fig. S17). In addition, the cumulative meta-analy-sis indicates that the ES estimates for IFN-chave not been consistent over time (Fig. S28).
Studies of IL-10
IL-10 levels were investigated in 17 studies, and levels were significantly higher in the MDD group compared to HCs, with a small ES (g =0.375, P = 0.045) (Table 1 and Fig. 3b). No evidence of small-study effects was verified (Table 1). Hetero-geneity was large (I2 =89.2%), and subgroup
analyses suggest that heterogeneity is lower in studies that assayed IL-10 in plasma compared to serum. In addition, the ES was significant only in studies that followed a non-matched design (Table S4). Furthermore, IL-10 levels were not sig-nificantly altered in participants with MDD who were antidepressant-free when this cytokine was assayed, whereas these levels remained significantly elevated in participants with MDD who were using antidepressants (Table S4). Sensitivity analyses showed that the exclusion of 11 of 17 studies one at a time rendered the ES estimate non-significant (Fig. S18). In addition, the cumulative meta-analy-sis indicates that the ES has not been conmeta-analy-sistent over time (Fig. S29).
Studies of soluble IL-2 (sIL-2) receptor
We found evidence that sIL-2 receptor levels were significantly higher in the MDD group
(a) (b)
compared to HCs with a moderate ES estimate (Hedge’s g =0.735, P <0.001) (Table 1; Fig. 3c). No evidence of small-study effects was observed, and between-study heterogeneity was large (I2 = 77.5%). Subgroup analyses suggested that heterogeneity was lower in studies that
measured sIL2 in plasma (compared to serum) as well as in studies in which MDD and HC
groups were not age- and gender-matched
(Table S4). In sensitivity analysis, the exclusion of included studies one at a time did not alter the direction or significant of the ES estimate.
(a) (b)
(c) (d)
Moreover, the cumulative meta-analysis indi-cated that this ES estimate has been consistent over time (Fig. S30).
Studies of C-C chemokine ligand 2 (CCL-2)
Levels of CCL-2 were significantly higher in partic-ipants with MDD compared to HCs with a large ES (g = 1.718; P =0.045) (Table 1; Fig. 3d).
There was evidence of small-study effects
(Table 1). However, the ES was not altered after adjustment for publication bias. Heterogeneity was large (I2 =96.3%). The ES was not significant in studies which utilized a matched design (Table S4). In sensitivity analysis, we found that the exclusion of the study by Shen et al. (45) from the analysis turned this ES non-significant (Fig. S20).
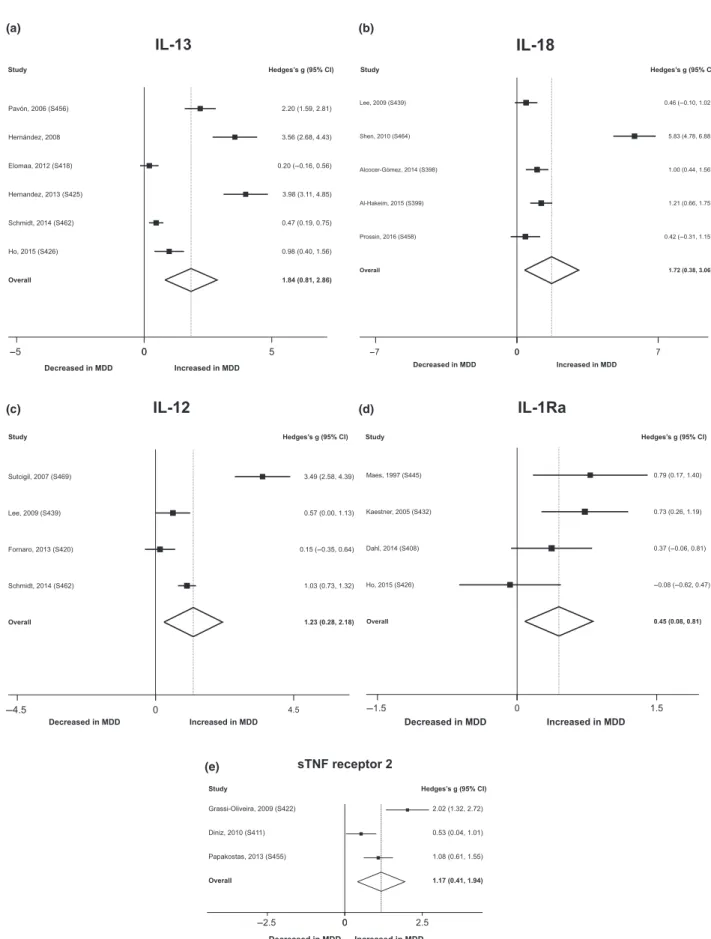
Studies of IL-13
Levels of IL-13 were significantly higher in partici-pants with MDD compared to HCs (g =1.836; P < 0.001) (Table 1; Fig. 4a). The ES estimate remained large even after adjustment for publica-tion bias (g =1.432). The heterogeneity was large (I2 =96.0%), but could not be reliably explored due to the limited number of included studies (k = 6).
Studies of IL-18
Levels of IL-18 were significantly higher in the MDD group compared to the HC group (Table 1; Fig. 4b). The ES estimate was high (g =1.720; P = 0.012), although a limited number of studies were included in this meta-analysis (k = 5). Heterogeneity was large (I2= 95.3%), and no
evi-dence of small-study effects was observed
(Table 1).
Studies of IL-12
Peripheral levels of IL-12 were significantly more elevated in individuals with MDD compared to
HCs, with a large ES estimate (g =1.229;
P = 0.012) (Table 1; Fig. 4c). The heterogeneity was large (I2 =92.9%), and no evidence of small-study effects was observed (Table 1). In addition, sensitivity analysis revealed that this ES could be biased by a possible outlier (46) (Fig. S22).
Studies of IL-1 receptor antagonist (IL-1Ra)
Peripheral levels of IL-1Ra were higher in the
MDD group compared to HCs (g =0.449;
P = 0.016) (Table 1; Fig. 4d). Heterogeneity was
large (I2 =51.6%), while no evidence of small-study effects was observed (Table 1). However, sensitivity analyses revealed that this ES could be biased by at least three possible outliers (42, 47, 48) (Fig. S24).
Studies of soluble TNF receptor 2 (sTNFR2)
Three studies indicate that sTNFR2 levels are higher in individuals with MDD compared to HCs with a large ES (g =1.173; P = 0.003), but high heterogeneity (I2 = 83.2%) (Table 1; Fig. 4e). No evidence of small-study effects was observed. How-ever, sensitivity analysis shows that removal of the study by Papakostas et al. (49) turned this ES esti-mate non-significant (Fig. S25).
Other mediators
Levels of IL-2, IL-4, the soluble IL-6 receptor (sIL-6R), IL-8, IL-5, CCL-3, IL-17, and trans-forming growth factor-b (TGF-b) were measured in at least three studies and were thus meta-ana-lyzed. Levels of these immune mediators did not significantly differ between individuals with MDD and HCs (Table 1). Forest plots for these meta-analyses are provided in the supporting informa-tion (Figs S2–S9).
Discussion
This meta-analysis provides the largest evidence synthesis conducted to date of studies that have investigated peripheral levels of cytokines and che-mokine peripheral levels in individuals with MDD compared to HCs. Our results suggest that levels of IL-6, TNF-a, IL-10, the sIL-2R, CCL-2, IL-13, IL-18, IL-12, and the sTNFR2 can be significantly elevated in individuals with MDD compared to HCs, while IFN-clevels may be slightly reduced in the MDD group compared to HCs.
The results of our meta-analysis add significant evidence to a previous meta-analysis (7), while a recent meta-analysis was limited to studies which investigated IL-1b, TNF-a, and IL-6 (5). The pre-vious meta-analysis found elevated levels of
(a) (b)
(c) (d)
(e)
heterogeneity is large (27). We confirmed that a high level of heterogeneity across studies charac-terizes this evolving field (5, 7). In addition, due to the larger number of included studies, we could more accurately explore potential sources of heterogeneity than has previously been possible.
A significant proportion of individuals with MDD exhibits a high prevalence of comorbid med-ical (e.g., metabolic) and psychiatric conditions (51, 52), which may contribute to immune activa-tion in MDD. For example, it has been postulated that comorbid obesity may lead to a more perni-cious outcome in MDD in part due to shared immune-inflammatory pathways (53, 54). There-fore, wea priori excluded studies in which
partici-pants with MDD had clearly identified
comorbidities and examined the influence of other relevant confounders. This approach identified the fact that mean BMI values of the MDD group (IL-1b and IFN-c), mean BMI of the HC control group (IFN-c), and current smoking (TNF-a) sig-nificantly moderated these estimates. These find-ings are consistent with the hypothesis that adiposity-driven inflammation may contribute to MDD-related morbidity (55, 56). In addition, it
has been postulated that smoking and an
unhealthy lifestyle (e.g., poor diet) could be rele-vant sources of immune activation in MDD (57).
Cytokines and chemokines have been classically subdivided as anti-inflammatory and proinflamma-tory. However, emerging evidence indicates that this subdivision may be overly simplistic. For example, IL-6 may activate a classical pathway and a trans-signaling pathway, which may have predominantly anti- and proinflammatory activi-ties respectively (58). We found elevated IL-6 levels in participants with MDD compared to HCs. The sIL-6R was examined in relatively few studies, and its peripheral levels were more elevated in the MDD group compared to HCs at the trend level. It is worthy to note that IL-6 was cytokine more extensively investigated in this meta-analysis, with a consistent moderate ES observed in cumulative meta-analysis. In addition, IL-6 and IL-1b may contribute to the pathophysiology of a subset of patients with MDD via excessive release of corti-cotrophin-releasing hormone (CRH) and by the promotion glucocorticoid receptor resistance, which may ultimately impair the negative feedback regulation of the HPA axis (59, 60).
We found evidence that IFN-cmay be reduced in participants with MDD compared to HCs. However, the ES was small and sensitivity analyses pointed to significant outliers. Furthermore, levels of IFN-c were most often close to the limit of detection of previously available assay kits, which
may lead to analytical variability. In addition, pre-vious studies found elevated levels of IFN-c in stimulated peripheral blood mononuclear cells (PBMCs) of individuals with MDD compared to healthy controls, which may provide a more accu-rate measure of this cytokine (61, 62).
Ronald Smith was the first to propose a macro-phage theory for depression in the early 1990’s (63). Macrophages and their counterparts in the CNS are crucial cells of the innate immune system, which can alter and adapt their phenotypes depending on their prime activity (a M1-activated phenotype has a primary role in acute defense against pathogens, whereas a M2 phenotype is pri-marily involved in clearing damaged tissues and repairing activities) (64). Evidence pointing to a role of M1 cells (including microglial cells and CNS macrophages) in MDD has accumulated (2, 65). A clear limitation of this meta-analysis rests on fact that the periphery may not reflect patho-physiological events in the CNS. However, preclin-ical studies indicate that the blockade of the trafficking of peripheral monocytes to the brain reduced proinflammatory cytokine production and decreased depressive-like behaviours in rodent stress models (66). Thus, peripheral M1 cells could be a main source of elevated cytokines in MDD (4). This meta-analysis evidenced elevated levels of CCL-2, IL-6, IL-12, TNF-a, and IL-1b, which are immune mediators secreted by M1 macrophages albeit not selectively (67).
The inflammatory response is tightly controlled at critical set points, and the maintenance of a healthy immune state is not a passive state, but may require an active expression of immunoregu-latory genes (68). Reguimmunoregu-latory T-cells (TRegs) are master immune regulators and play a significant role in immune tolerance (69). We found an eleva-tion of IL-10 levels in individuals with MDD com-pared to HCs. This cytokine is predominantly secreted by TRegs (70). However, subgroup analy-ses found that this cytokine was not elevated in antidepressant-free participants with MDD, which may underscore an indirect effect of antidepressant drugs. In addition, TGF-bthat is another biosig-nature cytokine of TRegs was not significantly altered in participants with MDD compared to HCs. Thus, a relative lack of counter-regulatory immune mechanisms may contribute to peripheral inflammation in MDD.
moderators (e.g., physical activity and diet qual-ity) (57) were not provided by included studies and thus could not be controlled for. Notwith-standing, we could not investigate whether length of disease and number of affective episodes as possible moderators of ESs estimates due to the lack of data across studies, a previous meta-analy-sis, which used a different definition had found suggestive that some differences in peripheral levels of cytokines may occur in acute compared to chronic MDD relative to HCs (50). Further-more, the current use of antidepressant drugs did not emerge as a significant moderator in our anal-yses. However, our exploratory meta-regressions could have limited power to detect this effect, and previous evidence indicates that antidepressant drugs may impact peripheral cytokine levels at follow-up (50). It has been postulated that melan-cholic depression is associated with an overactive HPA axis and possibly lower inflammation due to the modulatory effects of cortisol (15, 71). We found that few studies have categorized patients in melancholic vs. atypical depression, although we found that TNF-a levels did not differ when individuals with melancholic depression were
compared to HCs. In addition, cytokines/
chemokines appear to be involved in the patho-physiology of suicidal behaviour (72). Further-more, technical challenges in the assessment of certain mediators (e.g., IL-2 and IFN-c) (73) as well as differences in the standardization of assays across different laboratories could have con-tributed to the heterogeneity of some estimates. It is worthy to note that although a predefined pro-tocol was followed, we did not publish or other-wise registered it in a public database. Finally, the methodological quality of included studies has varied, and in our exploratory meta-regression analyses, this factor emerged as a significant mod-erator of differences in TNF-alevels between par-ticipants with MDD and HCs.
In conclusion, this meta-analysis indicates that several cytokines and CCL-2 are elevated in MDD. Our results confirm that cell-mediated immune activation may be an important patho-physiological aspect of MDD. In addition, our results provide directions for further research. For example, emerging preclinical evidence and a recent theoretical framework indicate that TH17 cells could play a significant role in the biology of depression (74, 75). However, few studies have investigated peripheral levels of IL-17, IL-17F, and IL-22, which are biosignature cytokines of TH17 cells (76). Thus, the characterization of the precise peripheral immune profile associated with MDD remains a work in progress.
Acknowledgements
CAK is supported by a postdoctoral fellowship award from the Coordenacß~ao de Aperfeicßoamento de Pessoal de Nıvel Superior (CAPES, Brazil). MM is supported by a visiting research fellowship from the Conselhor Nacional de Desen-volvimento Cientıfico e Tecnologico (CNPq; Brazil). AFC is supported by a research fellowship award from the Conselho Nacional de Desenvolvimento Cientıfico e Tecnologico (CNPq; Brazil).
Declaration of interests
In the past 3 years, CLR has served on the scientific advisory board for Usona Institute. In addition, he has served on the speaker’s bureau of Merck and Sunovion and on the advisory board of Otsuka and Pamlab. All other authors report no con-flict of interests.
References
1. Maes M. Evidence for an immune response in major
depression: a review and hypothesis. Prog Neuropsy-chopharmacol Biol Psychiatry 1995;19:11–38.
2. Miller AH, Raison CL. The role of inflammation in
depression: from evolutionary imperative to modern treat-ment target. Nat Rev Immunol 2016;16:22–34.
3. HaroonE,FleischerCC,FelgerJC et al. Conceptual con-vergence: increased inflammation is associated with increased basal ganglia glutamate in patients with major depression. Mol Psychiatry 2016;21:1351–1357.
4. WohlebES,FranklinT,IwataM,DumanRS. Integrating neuroimmune systems in the neurobiology of depression. Nat Rev Neurosci 2016;17:497–511.
5. HaapakoskiR,MathieuJ,EbmeierKP,AleniusH,Kivimaki
M. Cumulative meta-analysis of interleukins 6 and 1beta, tumour necrosis factor alpha and C-reactive protein in patients with major depressive disorder. Brain Behav Immun 2015;49:206–215.
6. MaesM,ScharpeS, VANGrootelL et al. Higher alpha
1-antitrypsin, haptoglobin, ceruloplasmin and lower retinol binding protein plasma levels during depression: further evidence for the existence of an inflammatory response during that illness. J Affect Disord 1992;24:183–192. 7. DowlatiY,HerrmannN,SwardfagerW et al. A
meta-ana-lysis of cytokines in major depression. Biol Psychiatry 2010;67:446–457.
8. StuartMJ,BauneBT. Chemokines and chemokine recep-tors in mood disorders, schizophrenia, and cognitive impairment: a systematic review of biomarker studies. Neurosci Biobehav Rev 2014;42:93–115.
9. DantzerR,O’ConnorJC,FreundGG,JohnsonRW,Kelley
KW. From inflammation to sickness and depression: when the immune system subjugates the brain. Nat Rev Neu-rosci 2008;9:46–56.
10. SimenBB, Duman CH,Simen AA,Duman RS. TNFalpha
signaling in depression and anxiety: behavioral conse-quences of individual receptor targeting. Biol Psychiatry 2006;59:775–785.
11. Chourbaji S, Urani A, Inta I et al. IL-6 knockout mice
exhibit resistance to stress-induced development of depres-sion-like behaviors. Neurobiol Dis 2006;23:587–594. 12. UdinaM,CastellviP,Moreno-EspanaJ et al.
Interferon-induced depression in chronic hepatitis C: a systematic review and meta-analysis. J Clin Psychiatry 2012;73:1128–
13. Thase ME. Using biomarkers to predict treatment response in major depressive disorder: evidence from past and present studies. Dialogues Clin Neurosci 2014;16:539–
544.
14. Carvalho AF, Kohler CA, Brunoni AR et al. Bias in
peripheral depression biomarkers. Psychother Psychosom 2016;85:81–90.
15. Gold PW. The organization of the stress system and its
dysregulation in depressive illness. Mol Psychiatry 2015;20:32–47.
16. Lamers F, Vogelzangs N, Merikangas KR, de Jonge P,
BeekmanAT,PenninxBW. Evidence for a differential role
of HPA-axis function, inflammation and metabolic syn-drome in melancholic versus atypical depression. Mol Psy-chiatry 2013;18:692–699.
17. StuartMJ,SinghalG,BauneBT. Systematic review of the neurobiological relevance of chemokines to psychiatric disorders. Frontiers Cellular Neurosci 2015;9:357. 18. SochockaM,DinizBS,LeszekJ. Inflammatory response in
the CNS: friend or foe? Mol Neurobiol 2016. doi: 10.1007/ s12035-016-0297-1 [Epub ahead of print].
19. HowrenMB,LamkinDM,SulsJ. Associations of depres-sion with C-reactive protein, IL-1, and IL-6: a meta-analy-sis. Psychosom Med 2009;71:171–186.
20. Hiles SA,Baker AL,DE MalmancheT,AttiaJ. A
meta-analysis of differences in IL-6 and IL-10 between people with and without depression: exploring the causes of heterogeneity. Brain Behav Immun 2012;26:1180–1188.
21. Liberati A, Altman DG, Tetzlaff J et al. The PRISMA
statement for reporting systematic reviews and meta-ana-lyses of studies that evaluate healthcare interventions: explanation and elaboration. BMJ 2009;339:b2700. 22. BakkalbasiN,BauerK,GloverJ,WangL. Three options
for citation tracking: Google Scholar, Scopus and Web of Science. Biomed Digit Libr 2006;3:7.
23. ASSOCIATION AP. DSM 5. American Psychiatric Asso-ciation; 2013.
24. ORGANIZATION WH. The ICD-10 classification of mental and behavioural disorders: diagnostic criteria for research; 1993.
25. HozoSP,DjulbegovicB,HozoI. Estimating the mean and variance from the median, range, and the size of a sample. BMC Med Res Methodol 2005;5:13.
26. Lau J,IoannidisJP,SchmidCH. Quantitative synthesis in
systematic reviews. Ann Intern Med 1997;127:820–826. 27. PatsopoulosNA,EvangelouE,IoannidisJP. Heterogeneous
views on heterogeneity. Int J Epidemiol 2009;38:1740–
1742.
28. Dersimonian R, Laird N. Meta-analysis in clinical trials.
Control Clin Trials 1986;7:177–188.
29. Carvalho AF, Kohler CA, Fernandes BS et al. Bias in
emerging biomarkers for bipolar disorder. Psychol Med 2016;46:2287–2297.
30. EggerM,Davey SmithG,SchneiderM,MinderC. Bias in meta-analysis detected by a simple, graphical test. BMJ 1997;315:629–634.
31. Duval S, TweedieR. Trim and fill: a simple funnel-plot-based method of testing and adjusting for publication bias in meta-analysis. Biometrics 2000;56:455–463.
32. Rosenthal R. The file drawer problem and tolerance for null results. Psychol Bull 1979;86:638.
33. HigginsJP,ThompsonSG. Controlling the risk of spurious
findings from meta-regression. Stat Med 2004;23:1663–
1682.
34. Thompson SG, Higgins JP. How should meta-regression
analyses be undertaken and interpreted? Stat Med 2002;21:1559–1573.
35. KroghJ,BenrosME,JorgensenMB,VesteragerL,Elfving
B, Nordentoft M. The association between depressive
symptoms, cognitive function, and inflammation in major depression. Brain Behav Immun 2014;35:70–76.
36. O’DonovanA,RushG,HoatamG et al. Suicidal ideation is associated with elevated inflammation in patients with major depressive disorder. Depress Anxiety 2013;30:307–
314.
37. Dunjic-Kostic B, Ivkovic M, Radonjic NV et al.
Melan-cholic and atypical major depression–connection between cytokines, psychopathology and treatment. Prog Neu-ropsychopharmacol Biol Psychiatry 2013;43:1–6.
38. Elderkin-ThompsonV,IrwinMR,HellemannG,KumarA.
Interleukin-6 and memory functions of encoding and recall in healthy and depressed elderly adults. Am J Geri-atr PsychiGeri-atry 2012;20:753–763.
39. Kahl KG, Bester M, Greggersen W et al. Visceral fat
deposition and insulin sensitivity in depressed women with and without comorbid borderline personality disorder. Psychosom Med 2005;67:407–412.
40. MotivalaSJ,Sarfatti A,OlmosL,IrwinMR. Inflamma-tory markers and sleep disturbance in major depression. Psychosom Med 2005;67:187–194.
41. Mikova O, Yakimova R, Bosmans E, Kenis G, Maes M.
Increased serum tumor necrosis factor alpha concentra-tions in major depression and multiple sclerosis. Eur Neu-ropsychopharmacol 2001;11:203–208.
42. MaesM,BosmansE,DEJonghR,KenisG,Vandoolaeghe
E,NeelsH. Increased serum IL-6 and IL-1 receptor
antag-onist concentrations in major depression and treatment resistant depression. Cytokine 1997;9:853–858.
43. MaesM,MeltzerHY,BosmansE et al. Increased plasma
concentrations of interleukin-6, soluble interleukin-6, sol-uble interleukin-2 and transferrin receptor in major depression. J Affect Disord 1995;34:301–309.
44. Leo R, DI Lorenzo G, Tesauro M et al. Association
between enhanced soluble CD40 ligand and proinflamma-tory and prothrombotic states in major depressive disor-der: pilot observations on the effects of selective serotonin reuptake inhibitor therapy. J Clin Psychiatry 2006;67:1760–1766.
45. ShenY,LuP,WeiL,HuX,ChenW. Fluoxetine treatment for major depression decreases the plasma levels of cytoki-nes. Afr J Biotechnol 2010;9:7346–7351.
46. SchmidtFM,LichtblauN,MinkwitzJ et al. Cytokine levels
in depressed and non-depressed subjects, and masking effects of obesity. J Psychiatr Res 2014;55:29–34.
47. KaestnerF,HettichM,Peters M et al. Different
activa-tion patterns of proinflammatory cytokines in melancholic and non-melancholic major depression are associated with HPA axis activity. J Affect Disord 2005;87:305–311.
48. HoPS,YehYW,HuangSY,LiangCS. A shift toward T
helper 2 responses and an increase in modulators of innate immunity in depressed patients treated with escitalopram. Psychoneuroendocrinology 2015;53:246–255.
49. PapakostasGI,SheltonRC,KinrysG et al. Assessment of a multi-assay, serum-based biological diagnostic test for major depressive disorder: a pilot and replication study. Mol Psychiatry 2013;18:332–339.
50. GoldsmithDR,RapaportMH,MillerBJ. A meta-analysis of blood cytokine network alterations in psychiatric patients: comparisons between schizophrenia, bipolar dis-order and depression. Mol Psychiatry 2016;21:1696–1709.
51. Kessler RC, Merikangas KR, Wang PS. Prevalence,
52. VancampfortD,CorrellCU,WampersM et al. Metabolic syndrome and metabolic abnormalities in patients with major depressive disorder: a meta-analysis of prevalences and moderating variables. Psychol Med 2014;44: 2017–2028.
53. DuYJ,YangCJ,LiB et al. Association of
pro-inflamma-tory cytokines, cortisol and depression in patients with chronic obstructive pulmonary disease. Psychoneuroen-docrinology 2014;46:141–152.
54. Mansur RB,BrietzkeE,McIntyreRS. Is there a
“meta-bolic-mood syndrome”? A review of the relationship between obesity and mood disorders. Neurosci Biobehav Rev 2015;52:89–104.
55. Capuron L, Lasselin J, Castanon N. Role of
adiposity-driven inflammation in depressive morbidity. Neuropsy-chopharmacology 2017;42:115–128.
56. Liu CS,Carvalho AF,McIntyre RS. Towards a
“meta-bolic” subtype of major depressive disorder: shared patho-physiological mechanisms may contribute to cognitive dysfunction. CNS Neurol Disord Drug Targets 2014;13:1693–1707.
57. BerkM,WilliamsLJ,JackaFN et al. So depression is an inflammatory disease, but where does the inflammation come from? BMC Med 2013;11:200.
58. MaesM,AndersonG,KuberaM,BerkM. Targeting
clas-sical IL-6 signalling or IL-6 trans-signalling in depression? Expert Opin Ther Targets 2014;18:495–512.
59. MillerAH,MaleticV,RaisonCL. Inflammation and its
discontents: the role of cytokines in the pathophysiology of major depression. Biol Psychiatry 2009;65:732–741.
60. Horowitz MA, Zunszain PA, Anacker C, Musaelyan K,
ParianteCM. Glucocorticoids and inflammation: a
dou-ble-headed sword in depression? How do neuroendocrine and inflammatory pathways interact during stress to con-tribute to the pathogenesis of depression? Mod Trends Pharmacopsychiat 2013;28:127–143.
61. MaesM,ScharpeS,MeltzerHY et al. Increased neopterin and interferon-gamma secretion and lower availability of L-tryptophan in major depression: further evidence for an immune response. Psychiatry Res 1994;54:143–160. 62. Seidel A, Arolt V, Hunstiger M, Rink L, Behnisch A,
Kirchner H. Cytokine production and serum proteins in depression. Scand J Immunol 1995;41:534–538.
63. Smith RS. The macrophage theory of depression. Med
Hypotheses 1991;35:298–306.
64. KalkmanHO,FeuerbachD. Antidepressant therapies
inhi-bit inflammation and microglial M1-polarization. Phar-macol Ther 2016;163:82–93.
65. YirmiyaR,RimmermanN,ReshefR. Depression as a
micro-glial disease. Trends Neurosci 2015;38:637–658.
66. WohlebES,McKimDB,SheridanJF,GodboutJP.
Mono-cyte trafficking to the brain with stress and inflammation: a novel axis of immune-to-brain communication that influences mood and behavior. Frontiers Neurosci 2014;8:447.
67. Mills CD. Anatomy of a discovery: m1 and m2
macro-phages. Front Immunol 2015;6:212.
68. Nathan C. Points of control in inflammation. Nature
2002;420:846–852.
69. SakaguchiS,YamaguchiT,NomuraT,OnoM. Regulatory T cells and immune tolerance. Cell 2008;133:775–787.
70. Sakaguchi S, Miyara M, Costantino CM, Hafler DA.
FOXP3+regulatory T cells in the human immune system. Nat Rev Immunol 2010;10:490–500.
71. StetlerC,MillerGE. Depression and
hypothalamic-pitui-tary-adrenal activation: a quantitative summary of four decades of research. Psychosom Med 2011;73:114–126.
72. Black C, Miller BJ. Meta-Analysis of Cytokines
and Chemokines in Suicidality: distinguishing Suicidal Versus Nonsuicidal Patients. Biol Psychiatry 2015;78: 28–37.
73. EllerT,VasarV,ShlikJ,MaronE. The role of IL-2 and soluble IL-2R in depression and antidepressant response. Curr Opin Investig Drugs 2009;10:638–643.
74. SlyepchenkoA,MaesM,KohlerCA et al. T helper 17 cells
may drive neuroprogression in major depressive disorder: proposal of an integrative model. Neurosci Biobehav Rev 2016;64:83–100.
75. BeurelE,HarringtonLE,JopeRS. Inflammatory T helper
17 cells promote depression-like behavior in mice. Biol Psychiatry 2013;73:622–630.
76. Korn T, Bettelli E,Oukka M, Kuchroo VK. IL-17 and
Th17 cells. Annu Rev Immunol 2009;27:485–517.
Supporting Information
Additional Supporting Information may be found in the online version of this article:
Fig. S1.Forest plot of studies that investigated IL-1b.
Fig. S2.Forest plot of studies that investigated IL-2.
Fig. S3.Forest plot of studies that investigated IL-4.
Fig. S4.Forest plot of studies that investigated soluble IL-6 receptor (sIL-6 receptor).
Fig. S5.Forest plot of studies that investigated IL-8.
Fig. S6.Forest plot of studies that investigated IL-5.
Fig. S7.Forest plot of studies that investigated CCL-3.
Fig. S8.Forest plot of studies that investigated IL-17.
Fig. S9.Forest plot of studies that investigated TGF-b1.
Fig. S10.Funnel plot of studies that investigated TNF-a.
Fig. S11.Funnel plot of studies that investigated IFN-c.
Fig. S12.Funnel plot of studies that investigated IL-4.
Fig. S13.Funnel plot of studies that investigated CCL-2.
Fig. S14.Funnel plot of studies that investigated IL-13.
Fig. S15.Sensitivity analysis for the meta-analysis of studies that investigated IL-6.
Fig. S16.Sensitivity analysis for the meta-analysis of studies that investigated TNF-a.
Fig. S17.Sensitivity analysis for the meta-analysis of studies that investigated IFN-c.
Fig. S18.Sensitivity analysis for the meta-analysis of studies that investigated IL-10.
Fig. S19.Sensitivity analysis for the meta-analysis of studies that investigated soluble IL-2 receptor (sIL-2 receptor).
Fig. S20.Sensitivity analysis for the meta-analysis of studies that investigated CCL-2.
Fig. S21.Sensitivity analysis for the meta-analysis of studies that investigated IL-13.
Fig. S22.Sensitivity analysis for the meta-analysis of studies that investigated IL-18.
Fig. S23.Sensitivity analysis for the meta-analysis of studies that investigated IL-12.
Fig. S24.Sensitivity analysis for the meta-analysis of studies that investigated IL-1 receptor antagonist (IL-1Ra).
Fig. S25.Sensitivity analysis for the meta-analysis of studies that investigated sTNF receptor 2.
Fig. S26.Cummulative meta-analysis of studies that investigated IL-6.
Fig. S27.Cummulative meta-analysis of studies that investigated TNF-a.
Fig. S28.Cummulative meta-analysis of studies that investigated IFN-c.
Fig. S30.Cummulative meta-analysis of studies that investigated soluble IL-2 receptor (sIL-2 receptor).
Fig. S31.Cummulative meta-analysis of studies that investigated CCL-2.
Fig. S32.Cummulative meta-analysis of studies that investigated IL-13.
Fig. S33.Cummulative meta-analysis of studies that investigated IL-18.
Fig. S34.Cummulative meta-analysis of studies that investigated IL-12.
Fig. S35.Cummulative meta-analysis of studies that investigated IL-1 receptor antagonist (IL-1Ra).
Fig. S36.Cummulative meta-analysis of studies that investigated soluble TNF receptor 2 (sTNF receptor 2).
Table S1.Excluded studies, with reasons.
Table S2.Characteristics of included studies.
Table S3.Meta-regressions of inflammatory markers in subjects with MDD versus healthy controls (HC).